Skip to content

Crude Oil Peak

Menu
  • Home
    • About
    • Disclaimer
  • OECD imports
    • France
    • Germany
    • Italy
    • Japan oil imports
    • OECD Europe
    • OECD Pacific
    • South Korea
    • UK
    • US Imports
  • Australian graphs
    • Australian electricity supply graphs
    • Australian crude oil production
    • Australian crude oil reserves
    • Oil import dependency
    • Oil and fuel imports
    • ULP prices
    • Industry stocks
    • End use of oil
    • WA crude oil
    • WA domestic gas
    • East coast conventional gas
    • Geoscience Australia March 2010
    • Geoscience Australia 2005/2006
    • Gippsland
    • LPG
    • Petrol rationing in WW2
  • Oil reserves
    • OPEC paper barrels
    • Kuwait Reserves
    • Strategic Oil Reserve
  • Global Peak
    • Algeria peak
    • Angola peak oil
    • Argentina peak
    • Azerbaijan peak
    • Brazil
    • Brunei peak
    • Canada and tar sands
    • Caspian peak
    • China Peak Oil
    • Deepwater peak
    • Egypt
    • Gabon peak
    • India peak oil
    • Indonesia peak
    • Iran Peak
    • Libya peak oil
    • Malaysia-peak
    • Mexico peak
    • Norway peak oil
    • Qatar peak
    • Russia peak
    • Saudi Arabia export peak
    • Sudan Peak
    • Syria
    • Tunesia
    • UAE peak
    • UK Peak
    • US Peak
    • Vietnam peak
    • Venezuela peak
    • Yemen
  • Energy Transitions
    • Germany energy transition
    • Japan Energy Transition
    • UK Energy Transition
    • US
  • Fuel Shortages
    • China Fuel Shortages
    • Egypt Diesel shortages
    • India petrol price hike
    • Malawi fuel shortage
    • Nepal
    • Nigeria fuel shortage
    • Pakistan petrol shortage
    • Russia
    • Tanzania fuel shortage
    • Uganda Fuel Shortage
    • Yemen fuel shortages
  • I told you so
    • Top Ryde Shopping Centre
    • North South Bypass Tunnel (Clem7) Brisbane
    • Airportlink Brisbane
    • Cross City Tunnel
    • Lane Cove Tunnel
    • Too late for Metro tunnels
    • Australian car manufacturing closing down
    • How the first phase of peak oil brought Virgin Australia into minus after 2008
  • Solutions
    • Night trains
    • Electric Rail on Freeways
    • LNG locomotive conversion
    • Electric trolley buses
    • Walk to school
  • Oil crises
    • Oil crisis 1973
    • My experience oil crisis 1979
    • Historical Oil Disruptions
  • Food and Oil
    • Farm Costs Australia
    • Food crises and political instability
  • Global warming
    • Storms of my Grandchildren
    • Extreme weather events
    • Global warming and petrol lines
    • Compensation claims from global warming damage
    • Sea level rises
    • Why coal seam gas will not reduce CO2 emissions
Menu

NSW power price spikes and administered price caps in May 2024

Posted on May 16, 2024

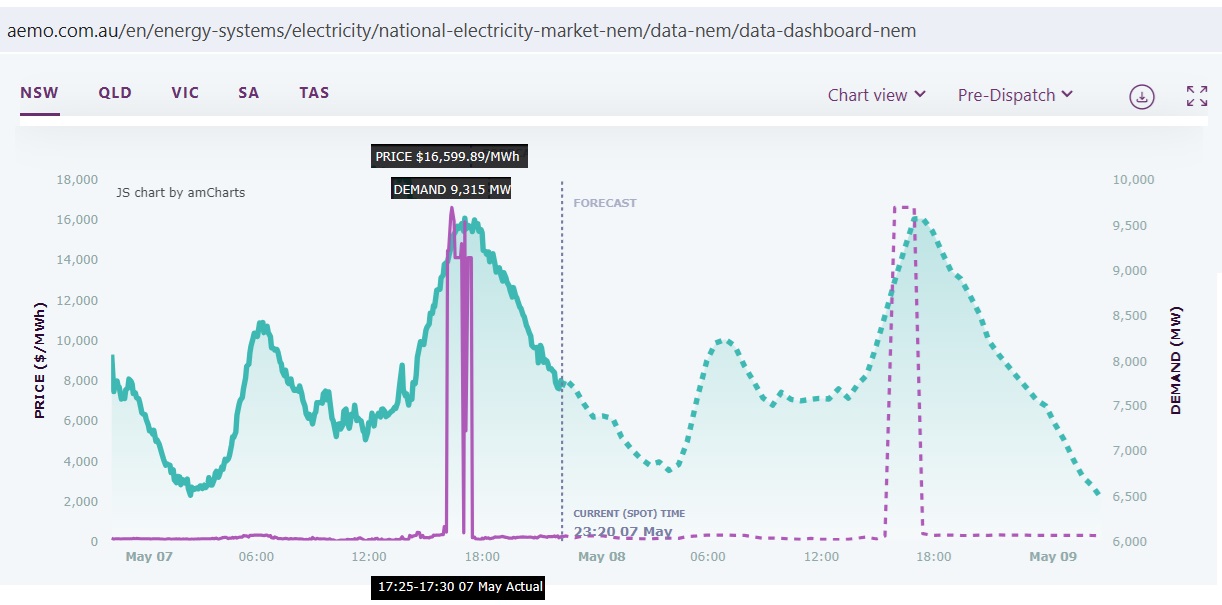
This post describes a series of price spikes in NSW which happened between Tuesday the 7th and Wednesday the 8th of May 2024. The following Fig 1 and Fig 2 are screen shots of AEMO’s dashboard (Australian Energy Market Operator)
https://aemo.com.au/en/energy-systems/electricity/national-electricity-market-nem/data-nem/data-dashboard-nem

Fig 1: May 7th price spikes up to 16,600 $/MWh at peak hour. Demand 9,300 MW
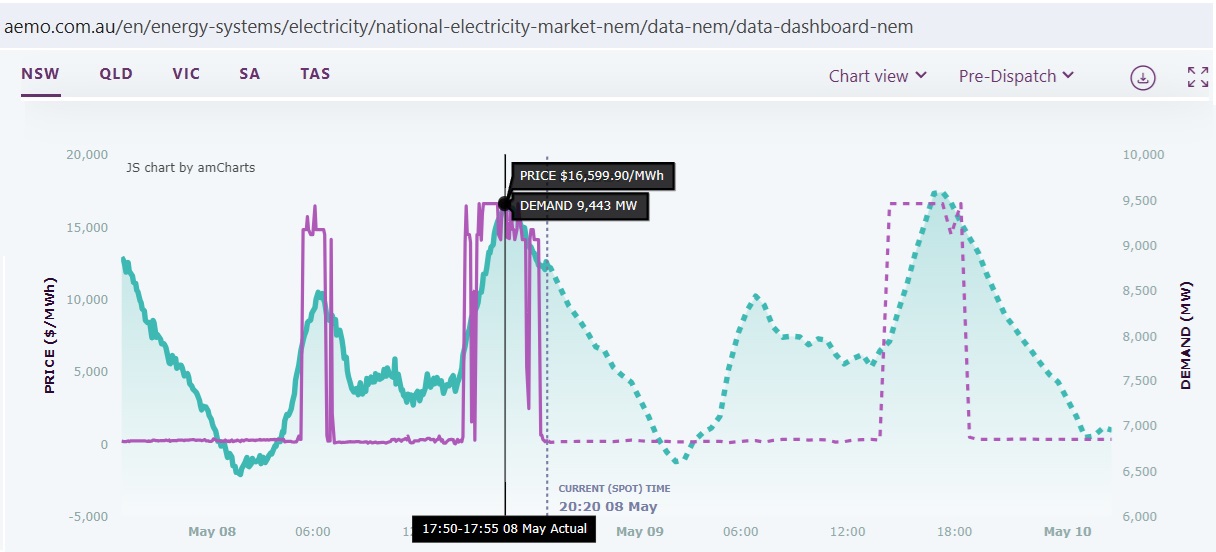
Fig 2: May 8th price spikes both in the morning (!) and afternoon

These 2 price spikes were not short lived but lasted for 1 hr 15 min in the morning (14,900 $/MWh) and 4 hrs 10 min (14,200 $/MWh), unprecedented.

AEMO had to impose administered price caps according to its NEM rules:

116554 ADMINISTERED PRICE CAP 09/05/2024 03:55:11 AM
AEMO has determined that the rolling sum of the uncapped spot prices for
the NSW1 region over the previous 2016 trading intervals has exceeded
the cumulative price threshold (CPT) of $1,490,200.00.

In accordance with Clause 3.14.2(b) of the National Electricity Rules,
AEMO has determined that an administered price period will commence at
the trading interval starting 0405 hrs on 09 May 2024 and will continue
through to the end of that trading day
https://aemo.com.au/market-notices

The CPT is calculated over 7 days
• the sum of the regional reference prices (spot prices) in the energy market for the previous 2,016 trading intervals (equivalent to seven days) exceeds the cumulative price threshold (CPT); or
• the sum of the ancillary service prices for a market ancillary service for the previous 2,016 trading intervals (equivalent to seven days) exceeds the CPT.
https://aemo.com.au/-/media/files/electricity/nem/security_and_reliability/dispatch/policy_and_process/guide-to-administered-pricing.pdf

Let’s have a look at how this developed over time:
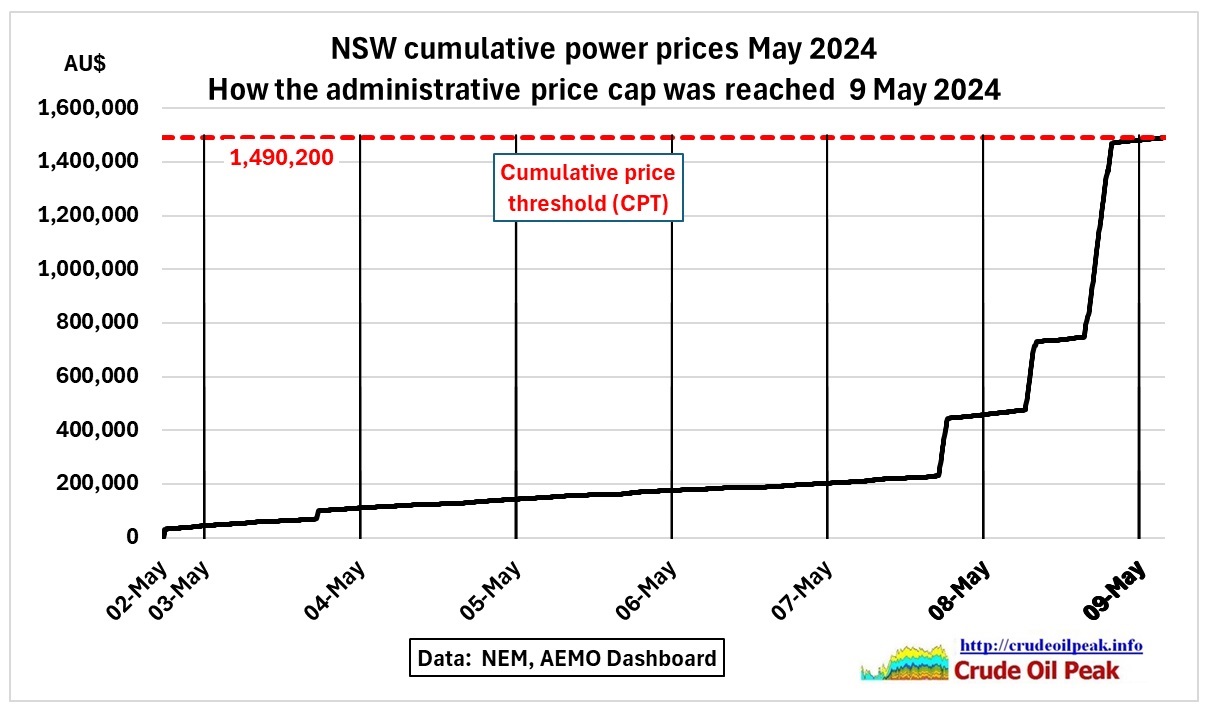
Fig 3: Consecutive price spikes add up and hit the threshold on May 9th

How did that happen? In the following Fig 4 the price spikes have been drawn in a generation-by-fuel graph.

Fig 4: NSW power generation by fuel and periods of price spikes between vertical lines

We see 3 price spikes coincide with demand peaks and limited generation from coal. At the time of the peaks the combined capacity factor of all coal plants was 62%-64%, 51%-53% and 48%-57% respectively.
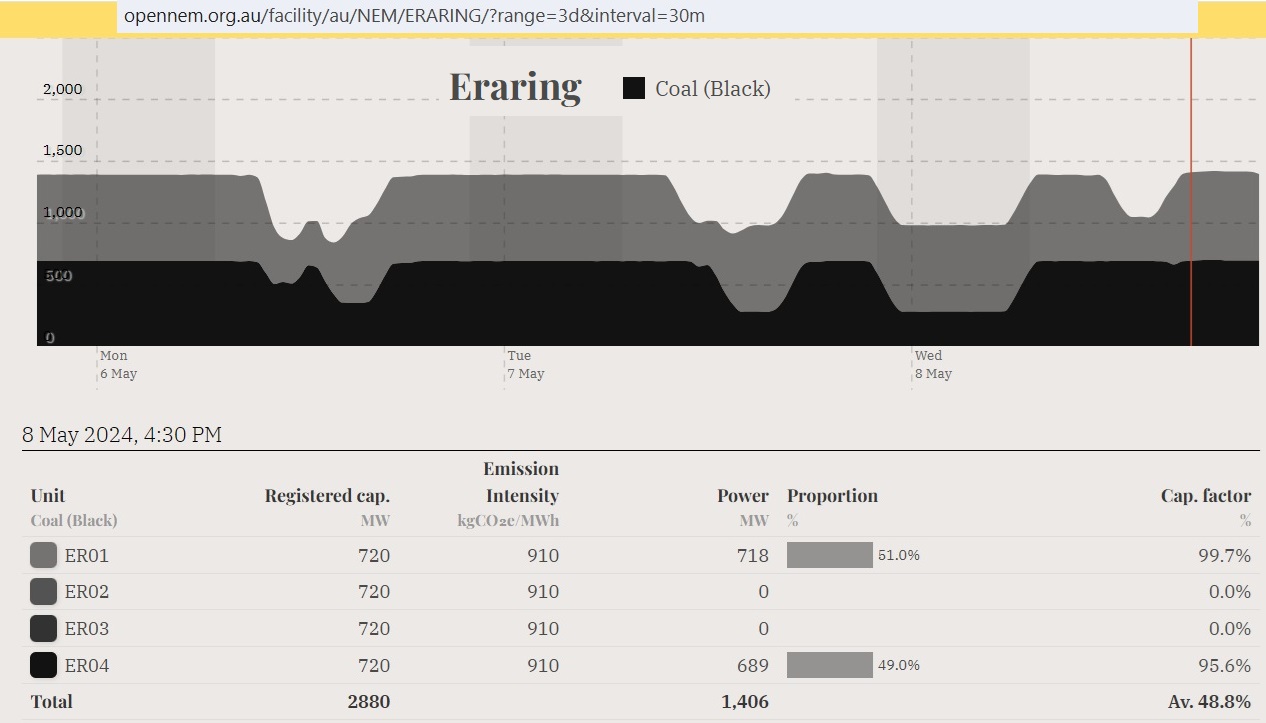
Fig 5: Only two of Eraring’s four units were in operation

Unit ER02 was on an unplanned maintenance since May 2nd and ER03 had experienced an unplanned forced outage on May 3rd. Unit ER04 did not reach its rated capacity.
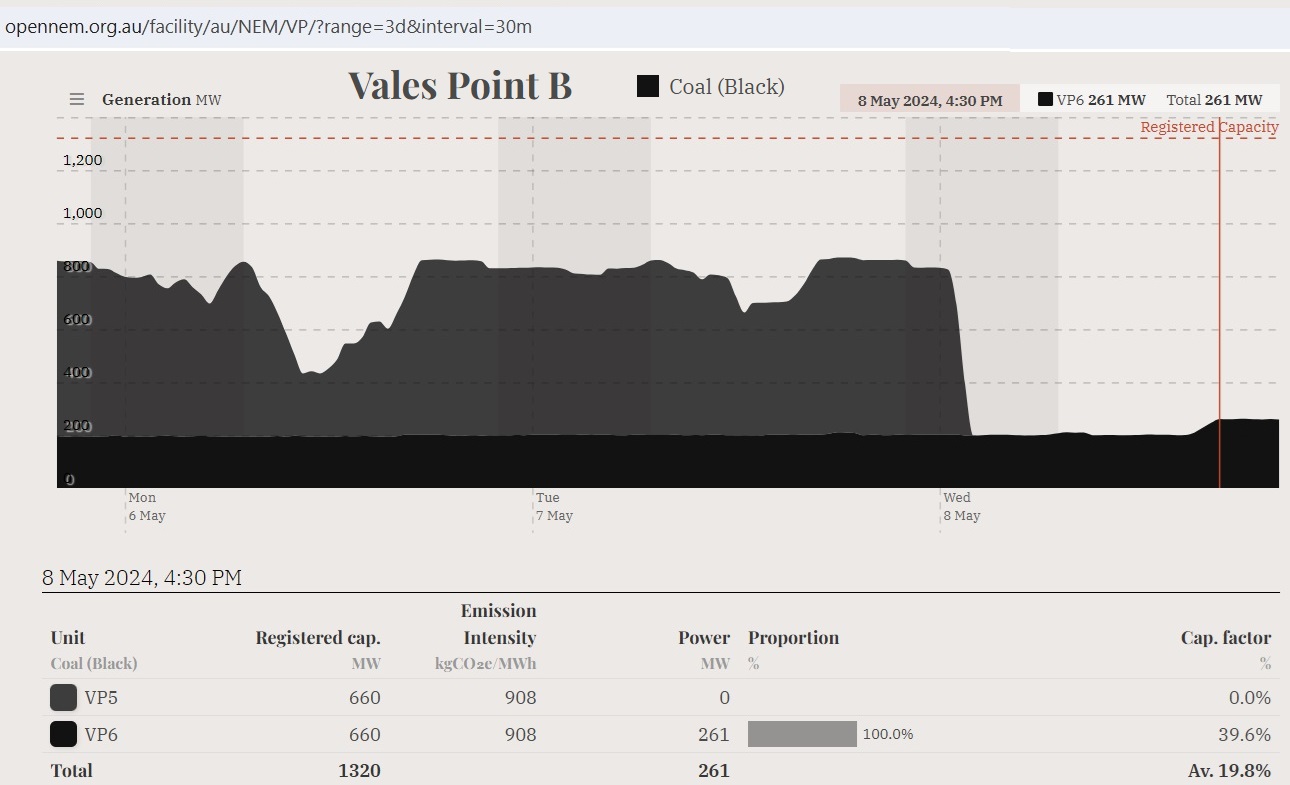
Fig 6: Vales Point VP5 tripped on 8 May 1:30 am

7/10/2022
Sale of Vales Point: How will Czech brown coal baron Pavel Tykac with
business registered in Liechtenstein impact on NSW coal and energy markets?
http://crudeoilpeak.info/sale-of-vales-point-how-will-czech-brown-coal-baron-pavel-tykac-with-business-registered-in-liechtenstein-impact-on-nsw-coal-and-energy-markets
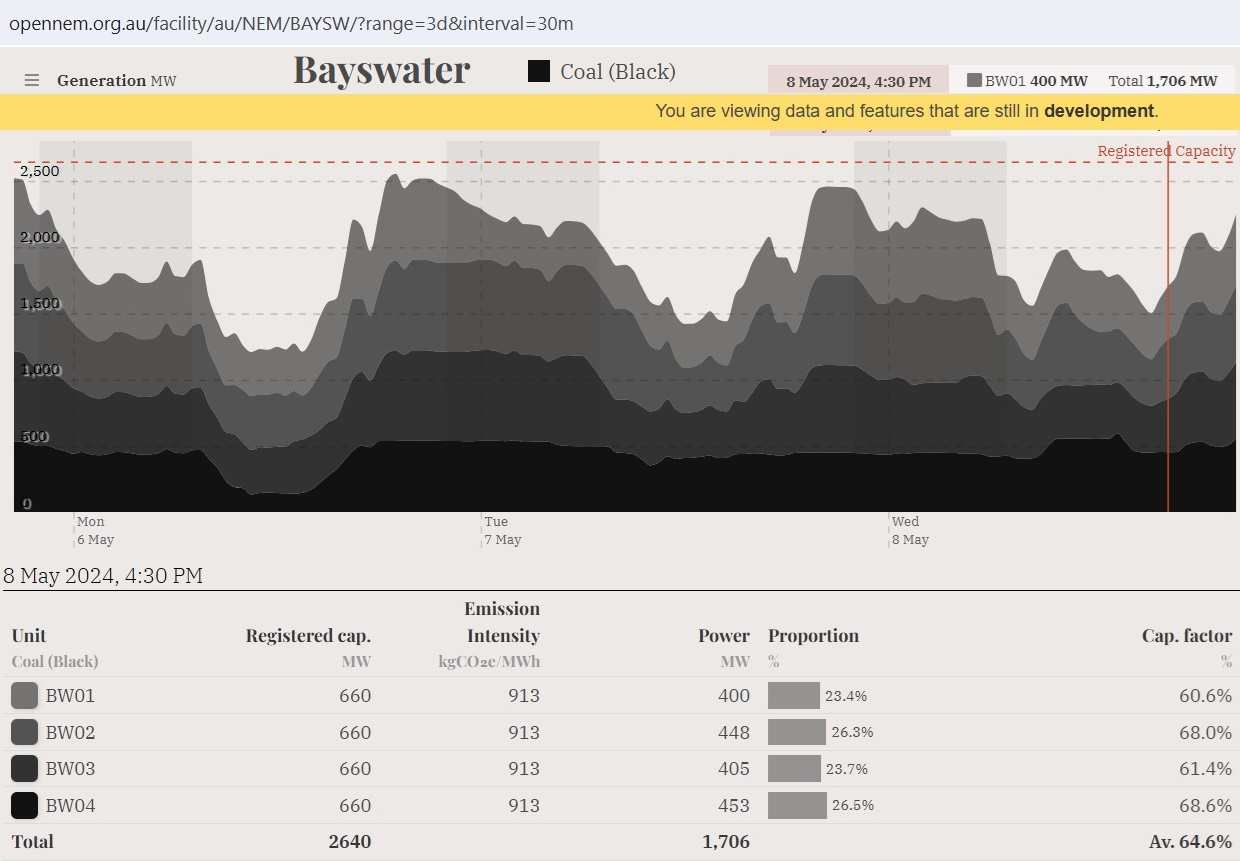
Fig 7: Bayswater was running at 65% of its capacity at the critical time of 4:30 pm on May 8th
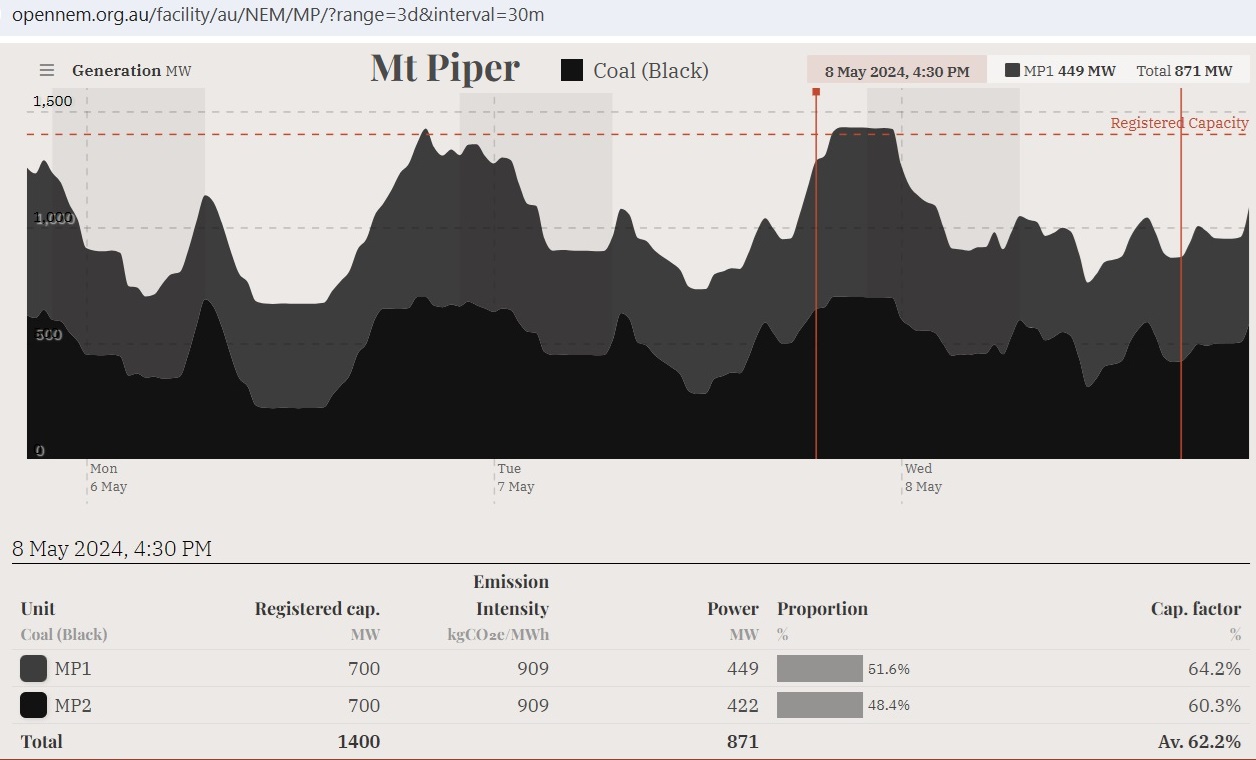
Fig 8: Mt Piper was generating on a bumpy plateau on May 8th, not exceeding 70%
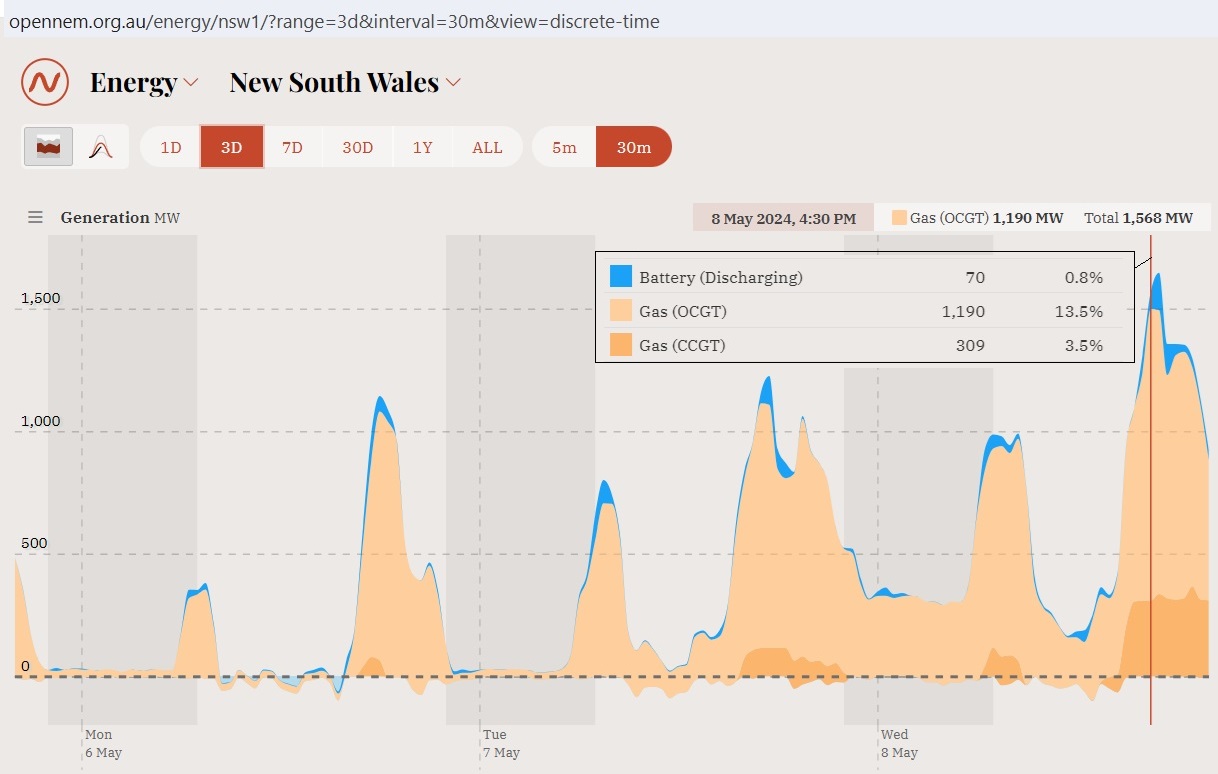
Fig 9: NSW depends heavily on gas peaking plants
https://wattclarity.com.au/articles/2024/05/08may-review-nsw-gas-gen-bidding/
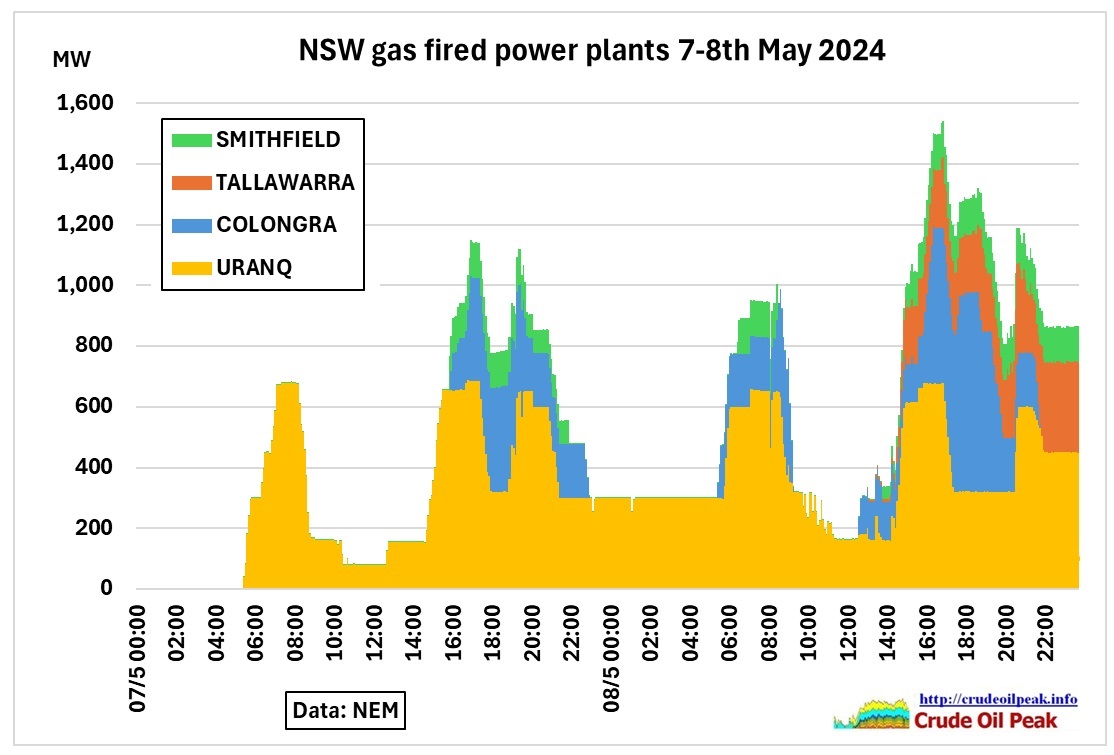
Fig 10: Gas fired peakers. Tallawarra B was not in operation since Apr 9th

Delving deeper, into gas-fired peaker performance in NSW on Tue 7th May and Wed 8th May
10 May 2024
https://wattclarity.com.au/articles/2024/05/08may-review-nsw-gas-gen-bidding/
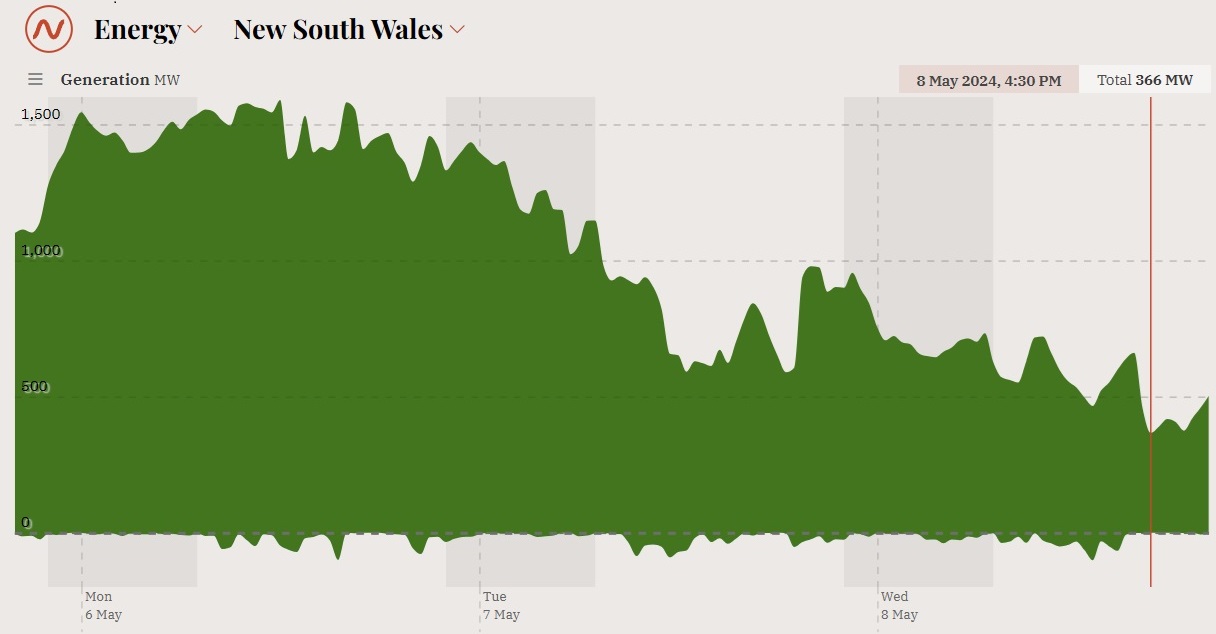
Fig 11: Generation from wind declined over 3 days
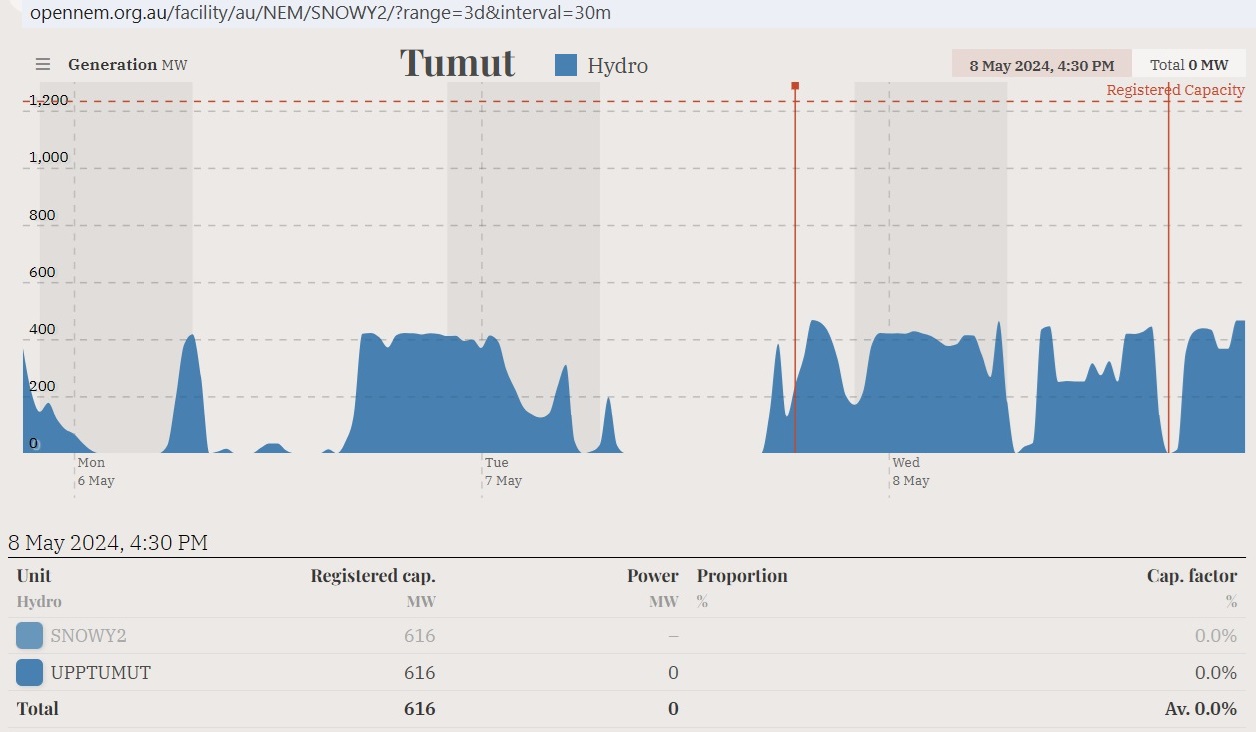
Fig 12: Upper Tumut had a drop in generation of 400 MW at the beginning of the afternoon peak May 8th

There were 3 Lack of Reserve warnings

Fig 13: Table showing Lack of Reserve (LOR) warnings 8 May 2024

Summary:

The price spikes are indicators that the NSW power supply has severe problems to cope with multiple and simultaneous challenges like peak demand after sunset (in winter), unplanned outages of coal fired power plants, lack of wind and availability of gas fired plants.

Key data & graphs

  • Net oil importers
  • Oil Exports
  • Crude oil imports
  • Downloads
  • Latest Graphs
  • Oil price analysis
  • US drilling rig count
  • International drilling rig count
  • Australian fuel prices
  • Diary
  • International oil companies
  • US tight oil production
  • China peak oil
  • World liquids supply – demand balance
  • Tankers arriving and departing in Sydney
  • Australian oil and fuel imports

Latest posts

  • Asia Pacific peak oil update 2025, consumption 5x higher than production
  • Australian jet fuel stock floating offshore while fuel prices are flying away
  • Australian Diesel imports in August dropped from high in May
  • First early hot summer day in spring 2026 and power prices spike at a whopping AUD 23k per MWh
  • Energy Minister Bowen firm in refusing Russian fuel imports but keeps options open for diesel imports from Russian dependent India
  • Australian Energy Minister Bowen downplays diesel supply risk after Saudi Arabia visit

Archives

©2026 Crude Oil Peak | Design: Newspaperly WordPress Theme