 .
.
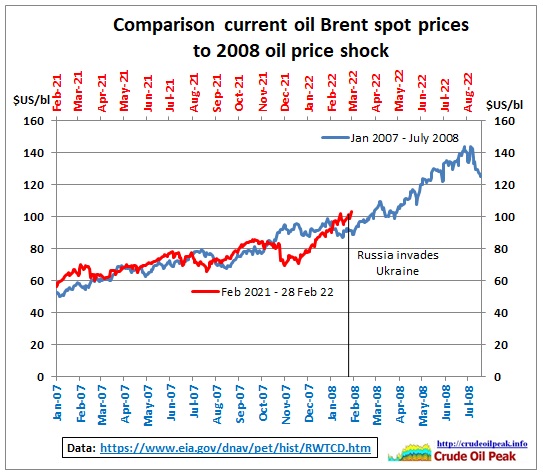
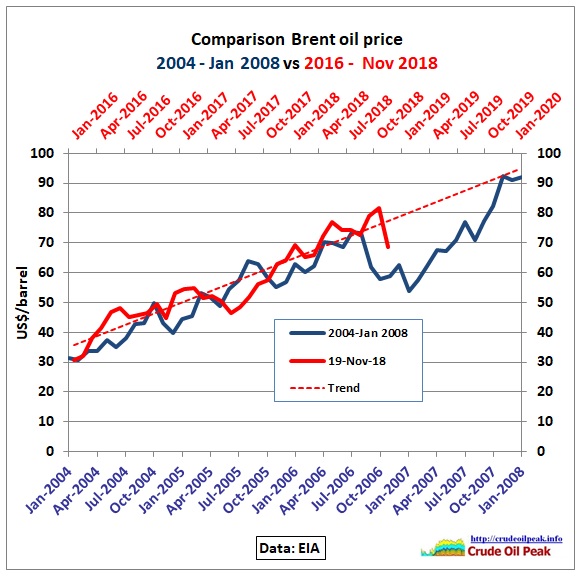
Update May 2021 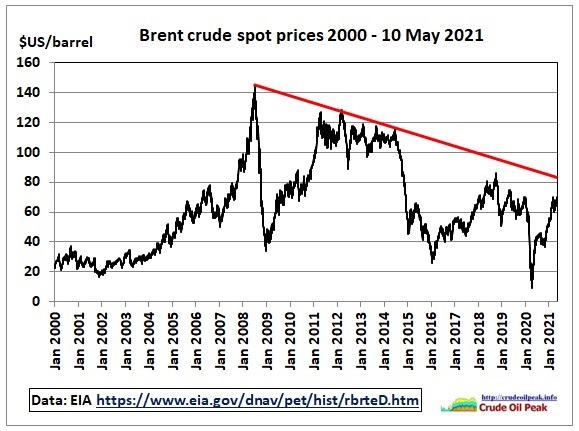 The red trend line connects the price shock in 2008 with the peaks in the high oil price period. The economy, now further damaged by Covid, may not tolerate the high oil price spikes of the past. Data from here: https://www.eia.gov/dnav/pet/hist/rbrteD.htm

https://www.eia.gov/dnav/pet/hist/LeafHandler.ashx?n=PET&s=W_EPC0_SAX_YCUOK_MBBL&f=W
https://www.eia.gov/dnav/pet/hist/LeafHandler.ashx?n=PET&s=RWTC&f=W

Update March 2020
Update January 2020

Update September 2019
Update November 2018

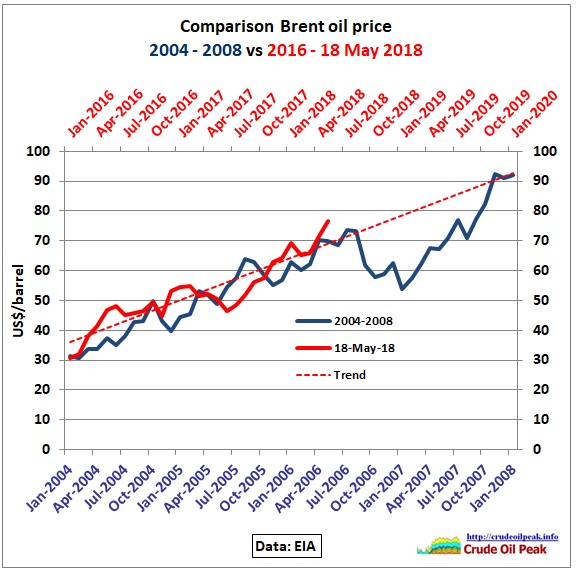
Update May 2018
March 2018
November 2016
Analysis from Wood Mackenzie
“All five of the major oil-producers in region – Iran, Iraq, Kuwait, Saudi Arabia and the UAE – will run a fiscal deficit in 2016. Deficits will range from 4% of GDP in Iran, to ~20% of GDP in both Saudi Arabia and Iraq by our estimates. Given the size of fiscal deficits, these economies face years in the red unless there is a sustained recovery in prices. It will be 2020 before all are back in the black or running a fiscal surplus, based on our expectation for the oil price to return to $85/bbl (real) in 2020.”
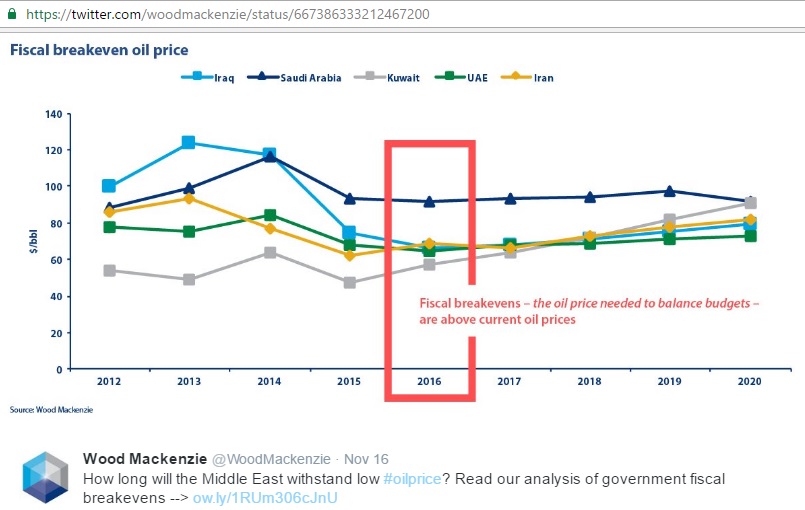
“The key to fiscal sustainability is access to capital – either a cushion of reserve assets, or the ability to issue government debt in international markets. Kuwait and the UAE have vast reserve assets allowing them to comfortably sustain fiscal deficits well beyond 2020. While Saudi Arabia has a healthy cushion of reserve assets, these are being eroded fast. According to official data from the Saudi monetary authority (SAMA), the kingdom burned through SAR 716 billion ($191 billion) in reserve assets between August 2014 and September 2016. Iran, on the other hand, has limited reserves but a relatively small deficit to finance. Indeed, the 2016 shortfall could be covered eight times over by their reserves.
Iraq is facing the greatest test. Having depleted most of the $18 billion Iraq Development Fund, Iraq is relying on emergency loans from the IMF and the central bank to purchase short dated government debt. Access to international capital markets is limited. And the country’s debt stock is already elevated. Iraq cancelled an auction last year because of the high yield demanded by investors.”
“To stem the depletion of reserve assets, Saudi Arabia issued $4 billion in local bonds and $17.5 billion in international bond markets this year. Abu Dhabi issued $5 billion in bonds in April, the first issue for seven years. And even Iran is considering debt issuance in international markets after a 14-year hiatus.”
November 2015

http://money.cnn.com/interactive/economy/the-cost-to-produce-a-barrel-of-oil/index.html?iid=EL
October 2015

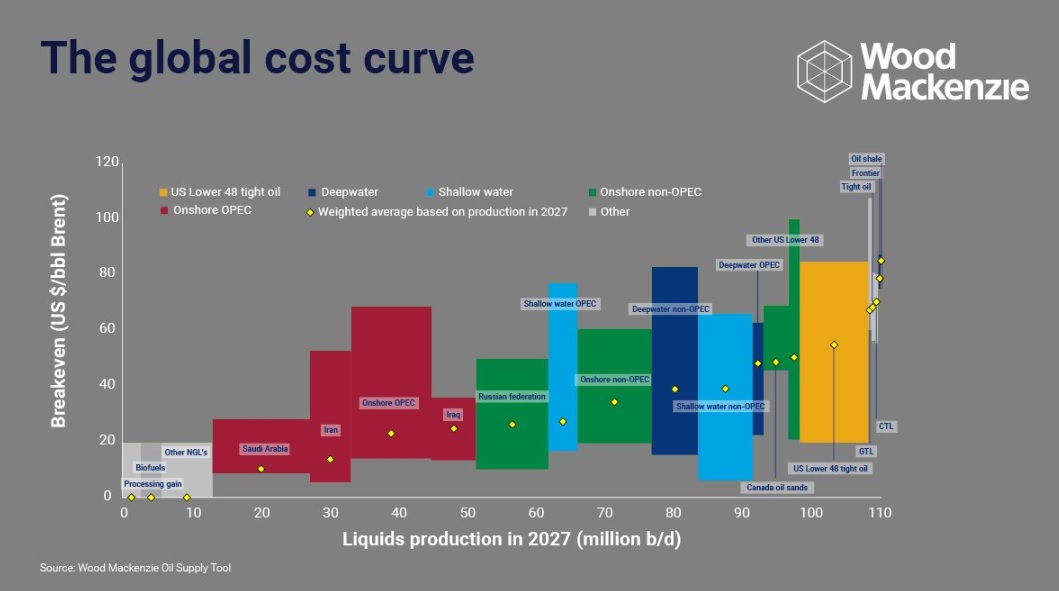
“The graph shows the cost curve for remaining discovered liquids resources as of 2015: crude oil, condensate and NGL. The curve is made up of over 20,000 unique assets by considering each asset’s break-even price and remaining liquids resources.
September 2015
US shale oil

From: http://www.artberman.com/the-party-is-over-for-tight-oil-but-raymond-james-says-party-on-dude/
March 2015
Mapping the new landscape
February 2015
http://www.apicorp-arabia.com/Research/Commentaries/2015/Commentary_V10_N1-2_2015.pdf

http://investors-corner.bnpparibas-ip.com/markets-strategy/crude-oil-market-briefing-lower-longer/
15/2/2015
Free oil! Next stop free oil crunch
http://crudeoilpeak.info/free-oil-next-stop-free-oil-crunch
2/2/2015
Peak affordable oil
http://crudeoilpeak.info/peak-affordable-oil
January 2015
IMF Regional Economic Outlook 21/1/2015
Learning to live with cheaper oil amid weaker demand

.

http://www.imf.org/external/pubs/ft/reo/2015/mcd/eng/pdf/mreo0115.pdf
January 2015
Analysis by Chris Cook (former director of the International Petroleum Exchange). Extract from an article in the European Tribune:
The Great Transfusion
In 2007/8 a colossal pyramid of US bank debt backed by real property collapsed when the burden of debt became too great for the US population to support. As has been said if debt cannot be paid, then it will not be paid and this debt has not gone away.
The visible wounds of the US economy – the damaged private banks – have now healed through being recapitalised, but invisible internal bleeding continues into unsustainable and unrepayable property debt.
This requires a continuing transfusion of new dollars which have until recently been provided by the US Federal Reserve Bank (‘Fed’) in exchange for financial assets such as government bonds. This Fed economic policy of a programme of dollar creation and asset swaps is known as ‘Quantitative Easing’ or QE.
These dollars had to end up somewhere, and apart from conventional investments, new types of funds were created which enabled investors who feared inflation to invest in gold and commodities.
Perhaps the most sought after commodity as a protection against inflation is and was crude oil. A colossal amount of dollar lending – no one knows how much – was therefore made via investment banks to Saudi Arabia, and possibly to other GCC nations, by US funds in return for oil loans made through ‘prepay’ sale and re-purchase agreements.

This simple chart shows how the US Fed Quantitative Easing (QE) and Twist programmes of dollar creation are almost perfectly correlated to the US WTI crude oil benchmark price: itself linked to the Brent/BFOE benchmark oil price.
It is clear that when the QE transfusion ended in late 2014 the US financial bubble in crude oil prices collapsed – as I predicted it would. Another macro-economic effect has been that since the US dollar bleeding continued, the dollar transfusion must necessarily come from somewhere else. We therefore see the dollar exchange rate strengthening as dollars drain out of US creditor nations causing dollar shortages.
….
Mr Al-Naimi recently gave a major interview in relation to Saudi oil market strategy. Perhaps the most widely reported remarks related to the new Saudi strategy of maintaining market share even in the face of a decline in the oil price to $20/barrel.
In my analysis, Mr Al-Naimi’s bullish posture is based upon the fact that Saudi Arabia can maintain market share simply by delivering crude oil into the market the economic value of which has already been pre-sold to investors.
I believe that Mr Al-Naimi’s confidence is based firmly upon Saudi experience of monetising their reserves invisibly to the market for the last five years.
Through the use of prepay credit the Saudis and US have essentially turned the conventional oil market on its head. Market participants such as Iran, Russia and Venezuela wrongly believe that Saudi Arabia’s oil supply still actively determines the market price. But the reality is that the Saudis are now passively allowing the market price to determine supply.
The market price is in reality now set – based upon an easily manipulated crude oil benchmark price – by financial intermediaries who profit commercially from volatility, on behalf of governments who profit politically from the economic damage caused to producers by massive swings in oil prices.
http://www.eurotrib.com/story/2015/1/1/195652/1093
Full MEES Interview With Saudi Oil Minister Ali Naimi
21/12/2014
Extract:
NAIMI: He [head of Rosneft] provided information about the Russian oil industry. In the end, he said he could not make any reductions because their wells are old, and if they reduce, the wells will not come back up. The minister confirmed that Russia was not willing to cut
MEES: Is it true that if the price falls, there are some fields in Russia and elsewhere that cannot produce?
NAIMI: The problem with old fields around the world is that they need continuous investment in new wells, and they cannot shut in old wells, because if they do, they will not come back up. So they are wary in that respect, particularly in West Siberia, where they have been producing for a long time and the wells there are declining. Their production of around 10mnb/d depends on high revenue, which is no longer there. That is the opposite of fields in the Gulf, which are still young. We have a lot of scope to continue, and our production costs are low – $4/B or $5/B at most. There is a difference between drilling a well in our areas and drilling a well in other areas. Also, Brazil’s sub-salt wells, west African wells and Arctic wells are high cost. So sooner or later, however much they hold out, in the end, their financial affairs will limit their production. Will this be in six months, in one year, two years, three years? God knows. I say that the Gulf countries, and particularly the kingdom [Saudi Arabia], have the ability to hold out.
MEES: To what level would oil prices have to fall to halt the growth in US shale oil production, and how long would prices have to stay there?
NAIMI: Shale oil rocks are not homogenous. Some areas have higher porosity than others. Areas that have good porosity can produce at $20-30/B. But some places need $80-90/B to make it. What is certain now is that they have begun to remove rigs. You remove the rigs so you do not drill wells, so how are you going to produce? The other fact is that shale oil wells have 80% decline rates in the first year. That is why they have to keep the rig drilling.
….
http://oilpro.com/post/9223/mees-interview-saudi-oil-minister-ali-naimi
December 2014

http://www.eia.gov/forecasts/steo/
December 2014


.
http://blog-imfdirect.imf.org/2014/12/22/seven-questions-about-the-recent-oil-price-slump/
.
November 2014
From Goldman Sachs (November 2014 update)

https://assetmanagement.gs.com/content/dam/gsam/pdfs/us/en/CEF/mlp-energy-renaissance-fund/fund-materials/mlp-energy-renaissance-investment-commentary.pdf
Extract from:
The 2014 Oil Price Crash Explained

“Prior to 2009, the production peaks were of the order 74 Mbpd. Post 2009 peaks of the order 77 Mbpd were achieved. About 3 Mbpd new capacity has been added. In May 2011 there is a significant and curious excursion to lower production not accompanied by a fall in price. This coincides with Libya coming off line for the first time and the loss of 1.6 Mbpd production. It seems possible that this coincided with weak demand and the fortuitous loss of production cancelling weak demand leaving price unchanged.
The EIA are always running a few months behind with their statistics these days, not ideal in a rapidly changing world. Thus we do not yet have the data to see the recent crash in the oil price. But we know the price has fallen below $80 and production is unlikely to be significantly changed. So, how do we explain production of roughly 77 Mbpd and a price below $80?”

“Figure 6 updates Phil Hart’s model to take account of the oil supply and price movements of the last 5 years. Capacity expansion is achieved by adding 3 Mbpd to the former, well-defined supply-price curve (blue arrow). There is no a-priori reason that this curve should hold in the new supply-price regime, but for the time being that is all I have to work with. The red lines, as described in the caption to Figure 1, conceptually represent inelastic demand where high price marginally suppresses demand for oil. The recent past has seen oil priced at $110 with supply running at about 77 Mbpd as defined by the right hand red coloured demand curve. Reducing demand by about 1 Mbpd brings the price below $80 / bbl (red arrow).”
http://www.theautomaticearth.com/the-2014-oil-price-crash-explained/
3rd quarter 2014

“In 1940 as the Great Depression was ending, one hour’s work for an American engaged in manufacturing could buy 20% of a barrel of oil, or approximately eight gallons. Bearing in mind that a single gallon has the equivalent energy of 200 to 300 man hours of labor, this already seems like a small fortune, but in what I am calling “The Golden Age of Income” the affordability of oil increased so steadily that by the end of 1972, just before OPEC and the troubles in the Middle East began, one hour’s work controlled 1.1 barrels, over a five-fold increase, the greatest surge of real wealth in U.S. history. By the second oil shock of 1979, however, oil affordability was back at a new low. Next began a quite different leg up, far less smooth and this time driven by declining oil prices and despite increasingly modest increases in income per hour. A new high in affordability was reached at 1.2 barrels per hour worked at the astonishingly low price of $16 a barrel in 1999 at today’s dollar equivalent. The final leg that I have been obsessing about now for six years was the great decline in affordability from 1999 until today that took affordability of oil back precisely to where we began in 1940″
http://www.gmo.com/websitecontent/GMO_QtlyLetter_3Q14_full.pdf
October 2014

"The chart above shows a conceptual description and approximation in the developments
of full life cycle costs tranches [ CAPEX {inclusive returns} + OPEX] for global
crude oil production [rh scale] together with the oil price [Brent and lh scale].
2014YTD (June 2014).
The full life cycle costs tranches should not be confused with operating expenditures (OPEX).
It is as OPEX surpasses gross revenues the operation becomes unprofitable and
producing installations/wells becomes shut in, plugged and abandoned"
http://fractionalflow.com/2014/10/19/world-crude-oil-production-and-the-oil-price/
September 2014
 http://www.etf.db.com/ESP/SPA/Download/Research-Commodities/49ed1993-2706-4c0c-8b1d-18018db690a2/Commodities-Quarterly.pdf
March 2014

.

http://www.dgm.gov.do/Conferencias_Internacionales/Latinvep/kepes.pdf
September 2013
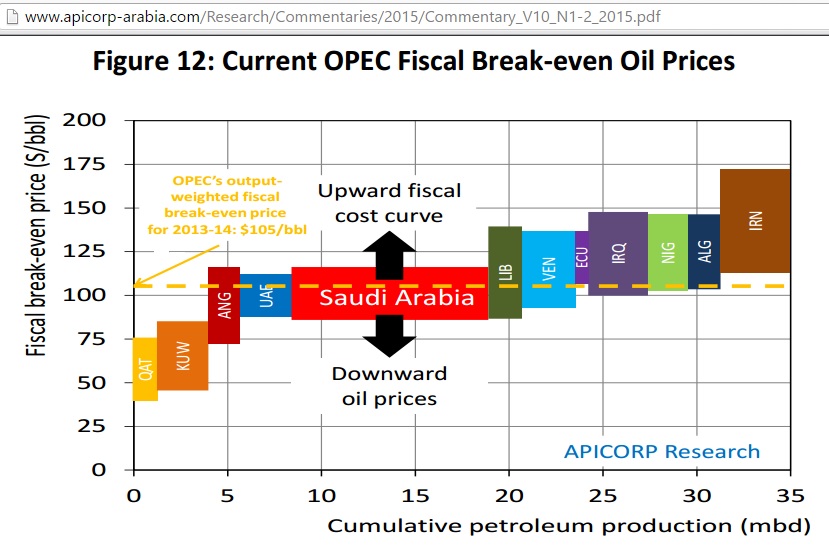
Economic Commentary by Ali Aissaoui, Senior consultant at APICORP (Arab Petroleum Investments Corporation) “In itssimplest definition a fiscal breakeven price isthe oil price that balances an oil‐exporting country’s budget. However, as simple as it sounds, its determination involves many different parameters. Production and export volumes are the key determinants of the revenues governments receive from royalty and petroleum taxes. These revenues are complemented by ordinary (non‐hydrocarbon) fiscal receipts as well as investment income from current account surpluses managed through a sovereign wealth fund (SWF). All or part of the revenue is spent on public goods through budgetary and extra‐budgetary operations, or transferred into a fiscal stabilization fund (FSF).” 
http://www.apic.com/Research/Commentaries/2013/Commentary_V08_N08-09_2013.pdf
November 2012
Key graphs from “The Economics of Oil Dependence” by New Economics Foundation (nef)


August 2012
Prof. James Hamilton
Oil demand rises, global production stalls, volatility here to stay
Hamilton: “On the other hand, I think we understand pretty clearly the main factors behind the overall increase in oil prices since 2005. Demand for oil, particularly from the emerging economies, has grown significantly, and we have had a hard time increasing global production. The single most likely outcome is that both conditions will continue to be with us. The most likely scenario is that the next decade will look something like the last, with oil prices volatile but exhibiting an upward trend.” http://www.economonitor.com/blog/2012/08/james-hamilton-oil-demand-rises-global-production-stalls-volatility-here-to-stay/?utm_source=contactology&utm_medium=email&utm_campaign=EconoMonitor%20Highlights%3A%20A%20Labor%20of%20Love
May 2012
by IMF Extracts from: Global Economy Learns to Absorb Oil Price Hikes  1. Stronger demand The reason for the current price hikes differs from the past. Increases in the 1970s and 1980s were caused largely by sharp disruptions to world supply. In contrast, a prime reason for the increases since 2000 has been stronger-than-expected demand from emerging market economies. 2. Central bank policies Central banks and economies have become more adept at dealing with price shocks. In the 1970s and 1980s, oil price rises triggered fears of inflation, and workers would try to protect themselves by demanding higher nominal wage increases. This had the effect of setting off wage-price spirals. 3. Recycling the benefits of oil profits The revenues from oil exports are flowing back to oil-importing economies. This helps bring down interest rates for households and firms, and so supports investment and growth in these economies. 4. Greater efficiency Oil price shocks do not have the same impact as in the past because economies have become more efficient in the use of energy. The amount of energy it takes to produce a dollar of income has been steadily declining for 40 years. This decline in energy intensity is expected to continue.
  5. Diversification Countries have increasingly diversified their energy sources over recent decades. They import energy from many more places than in the 1970s. They also use more varied forms of energy. This makes them less vulnerable to disruptions from any one supplier or source of energy. Oil supplies remain a concern Despite the reduced impact of high oil prices in recent years, large, abrupt price changes remain difficult to absorb, particularly if they come from supply disruptions. Recent geopolitical developments offer plenty of examples of such disruptions.
  The impact of supply disruptions The effects of major supply disruptions can be particularly damaging under current conditions because there is limited spare capacity to increase oil production, and inventory levels in importing countries are low. This will compound the difficulties facing many households already reeling from the financial crisis, with higher prices for gasoline and heating oil adding to the pain inflicted by high unemployment and low wages. Future supply disruptions may turn out to be costly not just because of the immediate loss of oil supplies, but because of the fears they trigger about a more permanent loss. Response of oil suppliers The response by oil suppliers to higher prices has been slow despite many years of rising and high prices. Bringing additional oil capacity to the market remains a challenge for various reasons including geology, geography, technology, and regulation. Liquidity trap? Simulations of the IMF’s large-scale models show that oil supply disruptions would reduce growth in the United States and Europe, an unwelcome prospect given already weak conditions in those economies. An additional worry is that even oil price increases due to stronger demand from emerging markets may have negative, short-run effects in the current climate as the increased incomes and savings of oil exporters from the higher prices are not recycled immediately or fully into increased demand for goods produced by oil-importing countries. http://www.imf.org/external/pubs/ft/survey/so/2012/num052512a.htm==========
June 2012
Where are US gas prices going? Have you ever wanted to know where the average price of a gallon of gasoline in the United States was headed next? All you need to do is enter that current [Brent] price in our tool, and we’ll estimate how much the average price of a gallon of gasoline will be in the U.S. within the next several weeks. The formula is: gas price [US$/gallon] = 0.84 (Federal + State taxes of 50 cents plus markups and other costs of 30 cents) + 0.025 x Brent price [US$]  http://politicalcalculations.blogspot.com.au/2012/06/where-are-us-gas-prices-going.html#.UpFeNMSkxAo
May 2012
by Goldman Sachs
 Click to enlarge
Breakeven oil prices of non-producing and recent on-stream oil assets http://www.docstoc.com/docs/119164686/Goldman-Sachs—360-projects-to-change-the-world
Jan 2012
by Citi Bank: Oil in 2012
 http://www.citibank.com/ipb/europe/pdfs/monthly_0212.pdf
==========
November 2011
How the cost of oil breaks down

http://www.bbc.com/news/business-15462923
June 2009
What price can America afford? by Steven Kopits, Douglas-Westwood  Three rules for policy History then provides us three rules by which to avoid recession caused by oil prices, notably: • Crude oil expenditures should not exceed 4% of GDP • Oil prices should not increase by more than 50% year-on-year • Oil price increases should not be so great that a potential demand adjustment should have to reach 0.8% of GDP on an annual basis, as shedding demand at this rate has generally been associated with recession. http://www.douglas-westwood.com/files/files/438-06-09_-_Research_Note_-_Oil_-_What_Price_can_America_Afford_-_DWL_website_version.pdf
2009
Causes and Consequences of the Oil Shock of 2007–08 James Hamilton, University of California Whereas historical oil price shocks were primarily caused by physical disruptions of supply, the price run-up of 2007-08 was caused by strong demand confronting stagnating world production. Although the causes were different, the consequences for the economy appear to have been very similar to those observed in earlier episodes, with significant effects on overall consumption spending and purchases of domestic automobiles in particular. In the absence of those declines, it is unlikely that we would have characterized the period 2007:Q4 to 2008:Q3 as one of economic recession for the U.S. The experience of 2007-08 should thus be added to the list of recessions to which oil prices appear to have made a material contribution. http://muse.jhu.edu/journals/brookings_papers_on_economic_activity/v2009/2009.1.hamilton.html
The graph shows the cost curve for remaining discovered liquids resources as of 2015: crude oil, condensate and NGL. The curve is made up of over 20,000 unique assets by considering each asset’s break-even price and remaining liquids resources.
The resources are split by supply segment groups – as shown by the coloured boxes. The width and height of the boxes represent the remaining resources as of 2015 and the range of breakeven 60% of the production lies within respectively. The resources for producing fields are included in the labelled grey box. The boxes – supply segment groups – can be compared based on a weighted average Brent break-even price to define their relative competitiveness.
Rystad Energy estimates that oil sands and the Arctic are the most expensive supply segments with an average breakeven of ~80 USD/bbl. Within offshore, shelf has the lowest average break-even price at ~60 USD/bbl, only marginally higher than Onshore Row.