
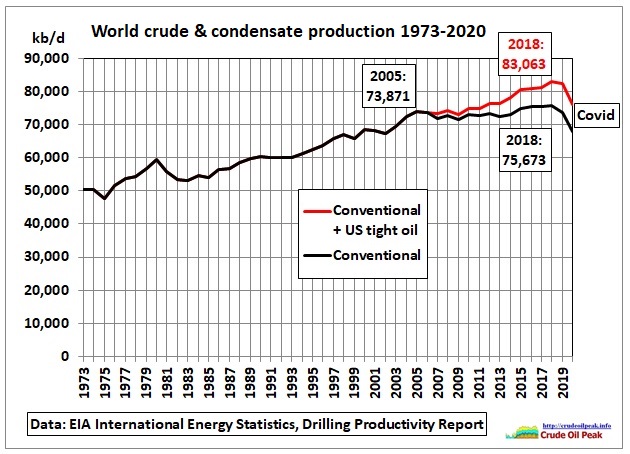
.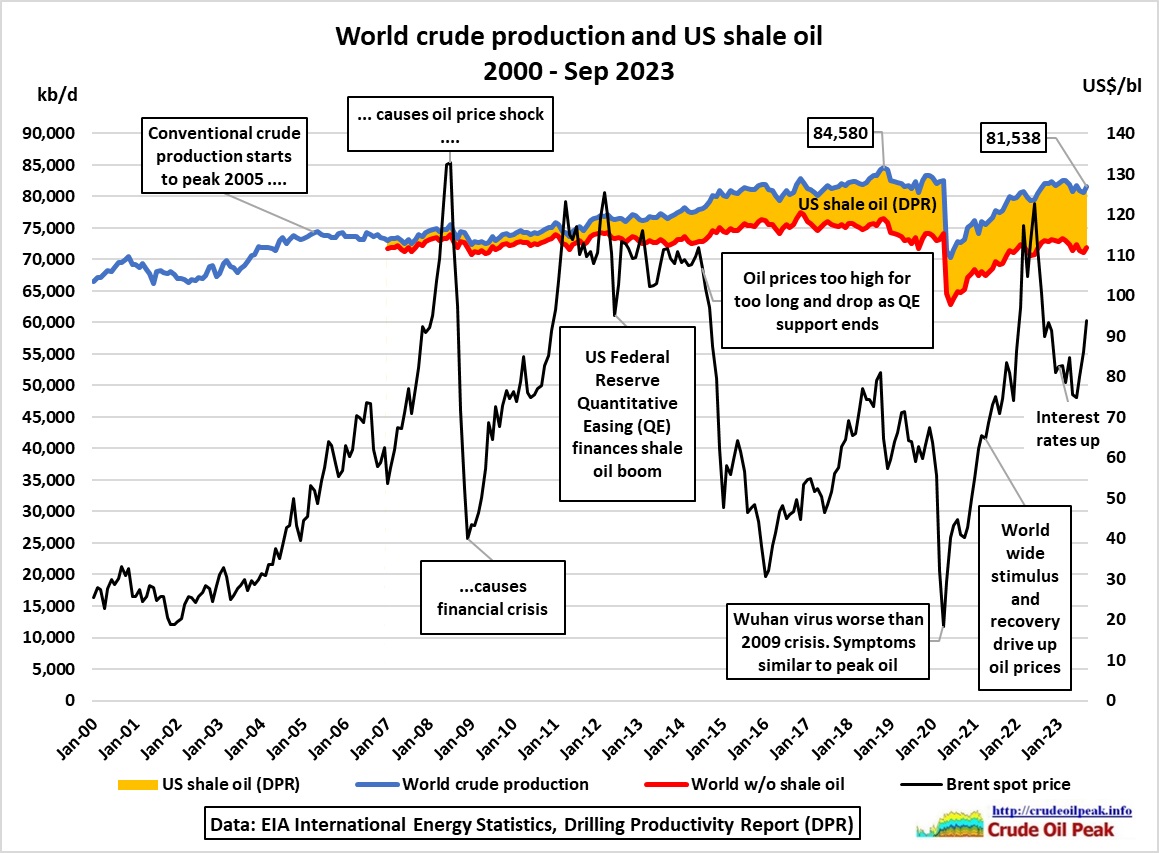 US shale oil seems to cover up peaking crude oil production in the rest of the world since 2018
4 Mar 2024
https://crudeoilpeak.info/us-shale-oil-seems-to-cover-up-peaking-crude-oil-production-in-the-rest-of-the-world-since-2018
.
3 May 2022
Will the world ever reach peak crude production of November 2018 again?
https://crudeoilpeak.info/will-the-world-ever-reach-peak-crude-production-of-november-2018-again-part-1
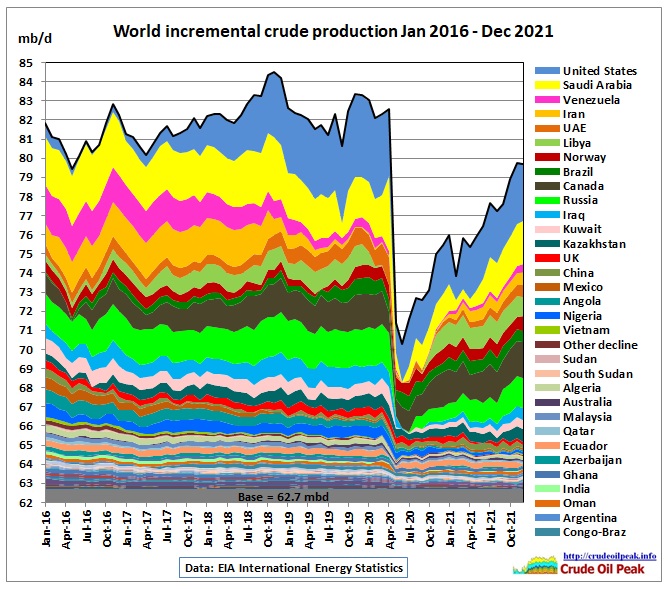
Update with data up to December 2021
Update with data up to Dec 2020
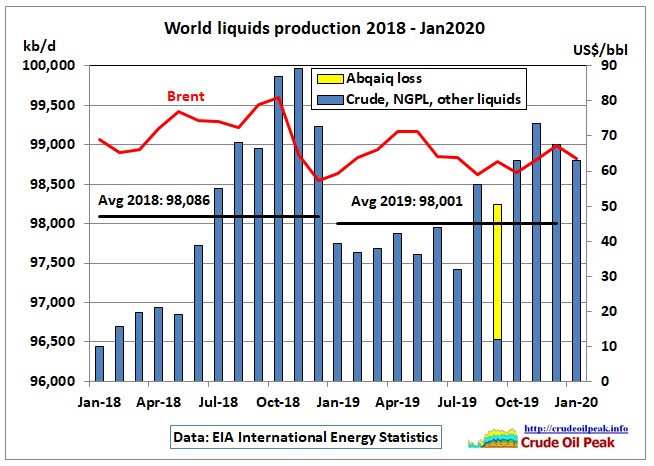
Update May 2020 with EIA data up to Jan 2020
Update May 2019 with data up to December 2018

More details are here:
10/6/2019
World crude production outside US and Iraq is flat since 2005
http://crudeoilpeak.info/world-crude-production-outside-us-and-iraq-is-flat-since-2005
Update September 2018 with data up to May 2018
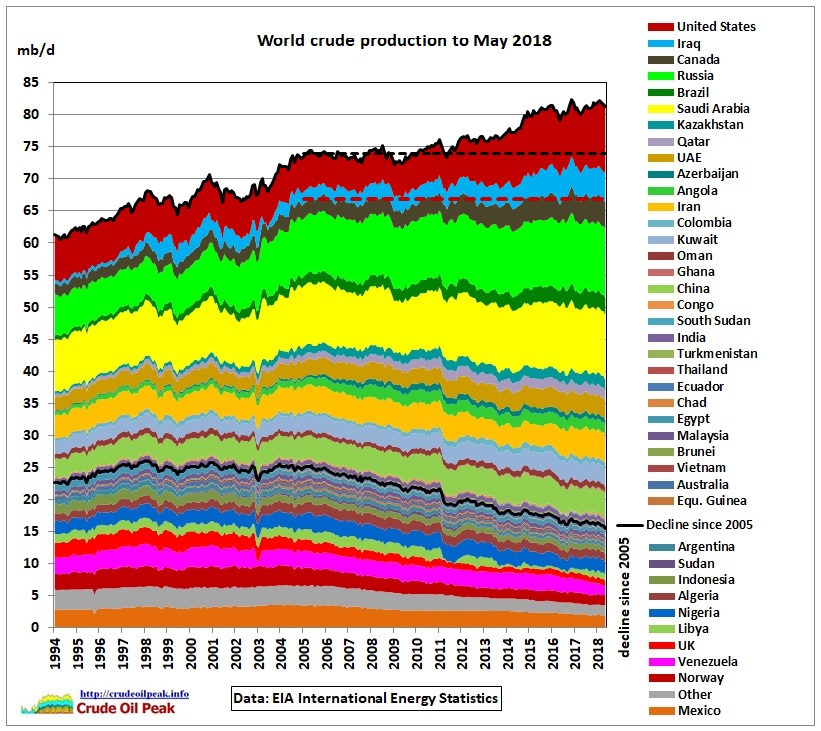
Horizontal black dashed line: 2005 production level
Horizontal red dashed line: 2005 production level excl. US and Iraq
Therefore, growth since 2005 has basically come from US shale oil and Iraq’s Basra oil. More details:
18/9/2018
What happened to crude oil production after the first peak in 2005?
http://crudeoilpeak.info/what-happened-to-crude-oil-production-after-the-first-peak-in-2005
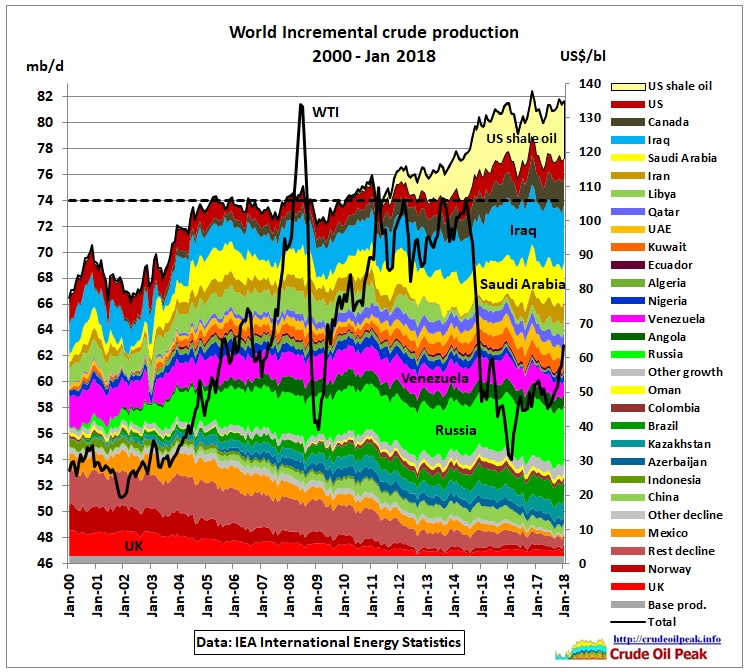
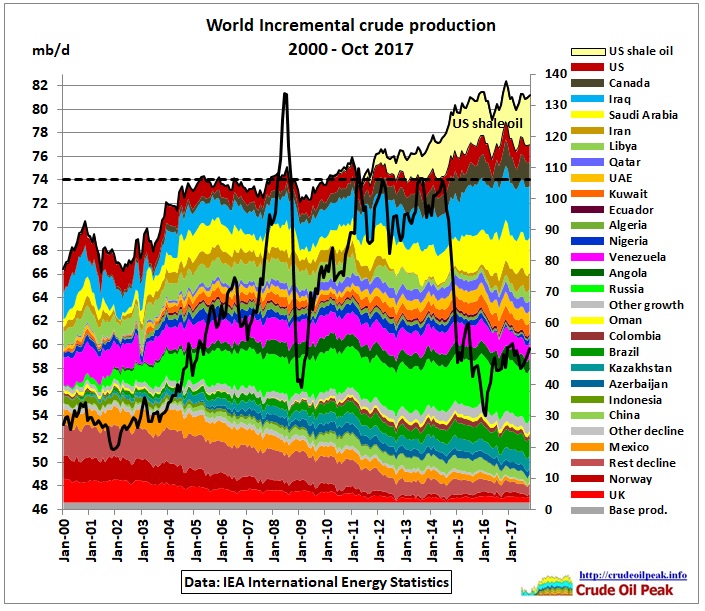
Update May 2018 with data up to Jan 2018
Update February 2018 with data up to Oct 2017
 .
.
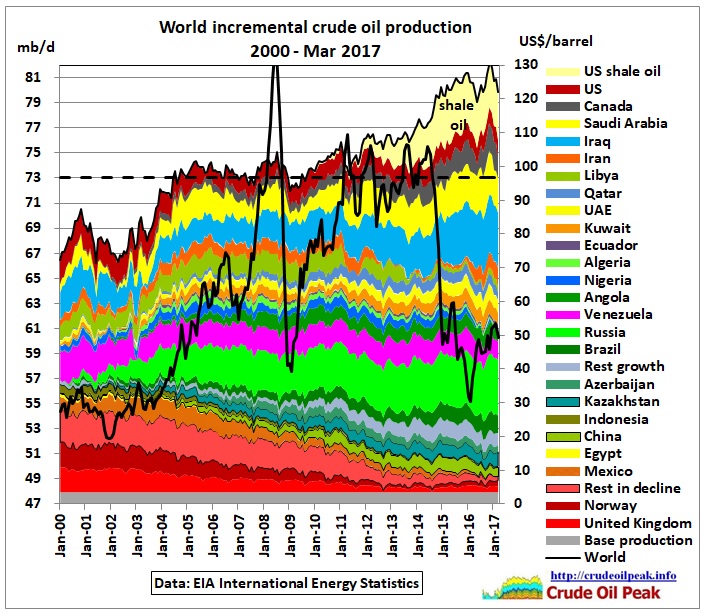
Update August 2017 with data up to March 2017
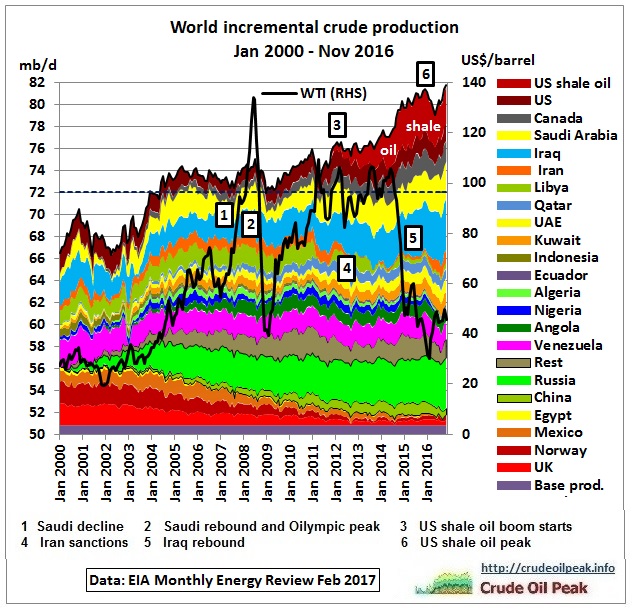
Update February 2017
With November 2016 data
Update August 2016
11/9/2016
Incremental crude production update August 2016
http://crudeoilpeak.info/incremental-crude-production-update-august-2016
Update April 2016
http://www.eia.gov/totalenergy/data/monthly/
Update February 2016

15/2/2016
World outside US and Canada doesn’t produce more oil than in 2005
http://crudeoilpeak.info/world-outside-us-and-canada-doesnt-produce-more-crude-oil-than-in-2005
Update January 2016

Data: https://www.jodidata.org/
October 2015

Incremental world petroleum and other liquids production from Jan 2011 to Sep 2015 and projection to Dec 2016. “Other Non-OECD” contains seasonal ethanol from Brazil. OPEC’s production also contains seasonal crude burn for power generation during ever hotter summers. Iran is supposed to produce 500 kb/d more in 2016 due to sanctions being lifted.
For the 2nd half of 2016, EIA also assumes higher US production which means higher oil prices at that time.
Data are from here: http://www.eia.gov/forecasts/steo/
Update June 2015

In February 2015, crude oil production outside Canada (tars sands) and the US (shale oil) was back to 2014 levels
Update June 2015


Contrary to public misinformation the Middel East countries Kuwait, Saudi Arabia, Qatar and Oman reduced their production by 620 kb/d between August and November 2014.
Increase: Libya (only temporary), UK: seasonal, US from tight oil, Iraq – the only country in the ME which had under produced oil in the 1980s and 1990s with a low depletion (reason for invasion).
Note that after August 2014 (previous graph below) the EIA adjusted all data upwards back to April 2009. For August 2014 this adjustment was 666 kb/d

Update June 2015

Update May 2015

Update May 2015

Data are from these webpages:
EIA International Energy Statistics
http://www.eia.gov/cfapps/ipdbproject/IEDIndex3.cfm
Canadian Association of Petroleum Producers
http://www.capp.ca/publications-and-statistics/publications/258990
Venezuela Ministerio del Poder Popular de Petróleo y Mineria
Petróleo y Otros Datos Estadísticos (PODE)
http://www.menpet.gob.ve/secciones.php?option=view&idS=21
.
Update April 2015

Data from JODI database: http://www.jodidb.org/TableViewer/tableView.aspx?ReportId=2411
for the top 30 producers. However, data for Libya go up to March 2014 only and data for Syria and Colombia are not available. So these 3 countries are excluded from the graph
Update Dec 2014

More details in:
11/12/2014
World on drip of unconventional oil
http://crudeoilpeak.info/?p=6681
Update October 2014

Update Jan 2014
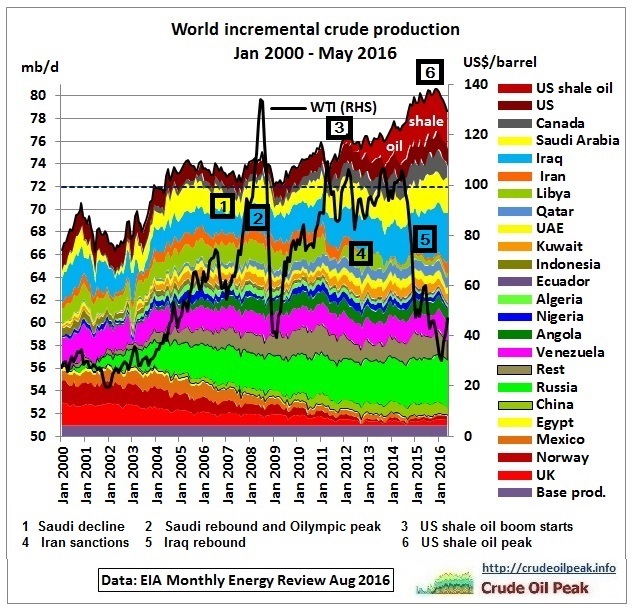
 US incremental is crude oil production above the minimum for the period Jan 2001 and Sep 2013 (3,980 kb/d in Sep 2008). The growth in global crude production of the last 2 years came entirely from US shale oil while the rest of world was actually in decline, similar to the period 2005-2007, only starting from a slightly higher level. The ROW average line shows we are back to 2005 levels
Update September 2013

Update April 2013

Excluding the US, rest-of-world crude production in 2H2012 was not higher than in 2005
http://crudeoilpeak.info/excluding-the-us-rest-of-world-crude-production-in-2h2012-was-not-higher-than-in-2005
Update Jan 2013
 Update Sep 2012
Update 17/5/2012
Incremental crude oil production update Jan 2012

http://crudeoilpeak.info/incremental-crude-oil-production-update-january-2012
Update 20/12/2011

Update 20/9/2011

Source of data: http://omrpublic.iea.org/
We can clearly see that Saudi Arabia was not able to respond to Libya’s production losses within 30 days as defined by the IEA to qualify as spare capacity. The total production loss February 2011 to July 2011 of Libya plus Saudi Arabia was 126 mb. Only half of this loss, 60 mb, was released by the IEA from strategic reserves. The report on the release dated 15/9/2011 is here: http://www.iea.org/index_info.asp?id=2074
Update 13/7/2011
 Back to 2005:
In March 2011, global crude oil production was 73,497 kb/d, slightly below 73,784 Kb/d in March 2005, and practically the average achieved during the last 6 years, which was 73,400 kb/d. We see that the oil “saved” in decline periods (red) was more or less consumed in growth periods (dark blue). The worsening zig-zag course around the average and high oil price volatility show that the world cannot manage peak oil well. The oil war in Libya is a counterproductive response to limited oil supplies, which has exposed OPEC’s lack of spare capacity. It is one of the negative feed back loops of peak oil.
Please note that the EIA has continued publishing international crude oil data – contrary to earlier announcements – but we cannot be sure whether that will continue. Also, EIA crude oil data for 2010/11 are much higher than those from the IEA (see below)
—————
Update 11/6/2011
After the Energy Information Administration (EIA, US Department of Energy) discontinued to update their international petroleum statistics, this page uses now data from the International Energy Agency (IEA, Paris) – Monthly Oil Market Report (table 3) http://omrpublic.iea.org/
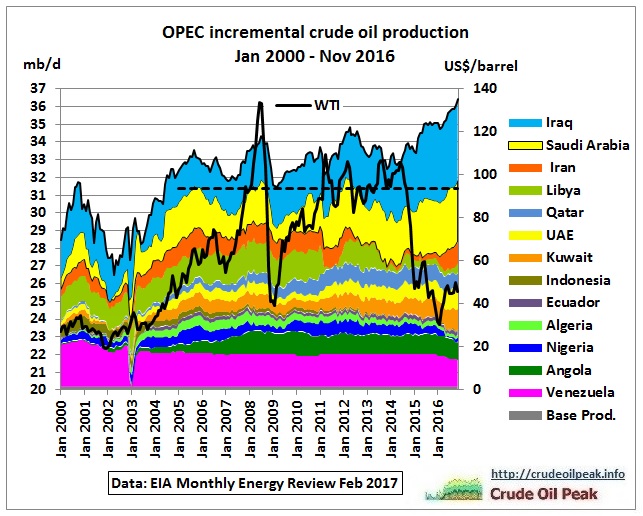
We start with OPEC crude, as this is shown separately (while other countries have their natural gas liquids contained in oil)
 Venezuela: note that in March 2006, the IEA started to include heavy crude from Orinoco.
This reduces the 2005 crude oil peak – see below the EIA data
We can clearly see what I call the Oilympic peak in July 2008 with an additional 800 kb/d from Saudi Arabia for China. Since then, OPEC production has dropped, for various reasons, by around 3 mb/d while demand, despite the temporary drop during the GFC, has remained strong.

Note that these are incremental changes since January 2001. The base production is the sum of the lowest country production data in this period. Countries with huge fluctuations like Venezuela, Iraq and now Libya feature prominently. Saudi Arabia is supposed to be a swing producer. But compare the recent slow rise in Saudi production with the fast incremental supply surge during the Iraq war.

Saudi Arabia did not increase production in February – April 2011 to compensate for Libyan oil production losses.
Comparison EIA – IEA
One cannot mix data from different organisations so the above graphs use IEA data only, back to 2001. The following graph shows the differences:
 The difference has progressively grown to around 2.3 mb/d, not a negligible volume. We got to keep this in mind when comparing the new set of IEA graphs with the previous EIA based graphs.
Historic Record:
Update 22/4/2011 The EIA, International Energy Statistics, published Saudi crude oil production revisions for 2010 which are not in line with other data providers IEA, OPEC and JODI

The black curve is the March 2011 version of the EIA data, the red curve revisions done in April 2011. These are very different from the monthly reports of the
IEA (blue) http://omrpublic.iea.org/
OPEC (brown) http://www.opec.org/opec_web/en/publications/338.htm
JODI database (yellow) http://www.jodidb.org/WDS/TableViewer/tableView.aspx?ReportId=2411
Even before the April 2011 update EIA data tended to be too high for 2010

The latest is now:
“Immediate reductions in EIA Energy Data and Analysis Programs Necessitated by FY2011 Funding Cut”
“Terminate updates to EIA’s International Energy Statistics.”
http://gregor.us/wp-content/uploads/2011/04/Full-EIA-Press-Release.pdf
I strongly recommend the reader saves the JPG files on this page as a historic document.
——————
December 2010 version, updated 18/3/2011.
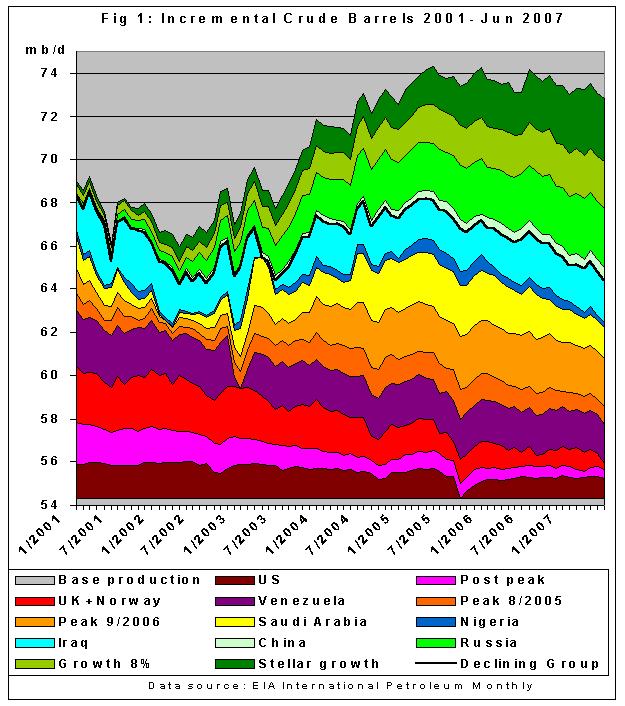
The graphs show only incremental crude oil production relative to January 2001 with data from http://www.eia.doe.gov/cfapps/ipdbproject/IEDIndex3.cfm
Production profiles can be stacked in many different ways, from bottom Fig 1c: decline wedge first, then peaking, Saudi Arabia,growing group, Venezuela and Iraq on top

Fig 1d: for detailed description, see http://www.crudeoilpeak.com/?p=1149

Fig 7: Details of growing group, in August 2008 BTC pipeline attack, conflict in Georgia, later technical problems in the ACG oil field. Angola, Brazil, Kazachstan and Azerbaijan are the only 4 countries who managed growth (around 600 Kb/d) since July 2008. All are dependent on offshore oil.

Fig 8: Details of OPEC

OPEC: Saudi Arabia could not produce more oil in the boom year 2008 than in 2005

We can clearly see the gradual decline of Non-OPEC after 2004, although there was a recent recovery, mainly from the US rebouncing from hurricanes. Russia and other growing countries also have helped lift the production back to its 2003- 2005 level.
Let’s now stack OPEC on top of Non-OPEC

The subsystem excluding Iraq, Saudi Arabia and Angola (which joined OPEC in December 2006) has come back to its peak level in 2005/06. And looking at the subsystem excluding Angola we see that Saudi Arabia was not able to lift production to 2005 levels. It was Russia and the growing group which did it.
We are now on the 3rd hump on the bumpy production plateau
(1) 2005, the start year of the peaking, interrupted by Katrina and followed by decline in Saudi Arabia
(2) 2008, the Oilympic peak followed by the collapse of Lehman Brothers
(3) 2010, the money printing peak, followed by unrest in North Africa and the ME
—————-

Annual crude production in 2005 and 2010 were basically on the same level but average oil prices in 2010 were 40% higher
—————-

The above graph shows a group of countries labelled “Other” in the International Petroleum Monthly
2007
First incremental graph
9/10/2007 Did Katrina hide the real peak in world oil production?
http://www.theoildrum.com/node/3052