Update to Feb 2021
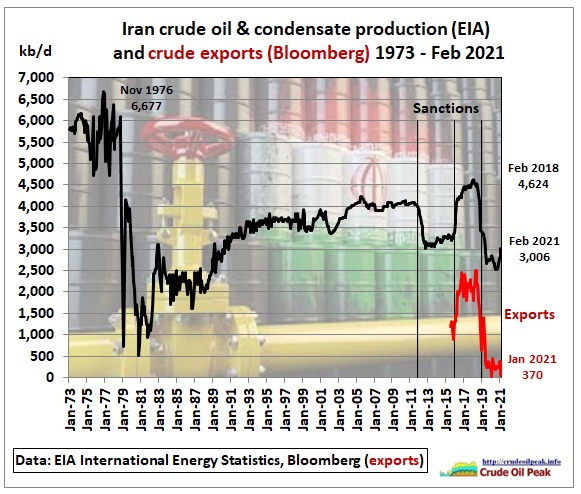 Iran’s export data are from Bloomberg https://www.bloomberg.com/news/videos/2021-05-26/iran-oil-won-t-be-in-market-until-well-into-q3-analyst-video
Tanker Trackers have much higher exports. They contain condensate from gas fields and other natural gas liquids like LPG. There are huge uncertainties in data due to transponders of tankers turned off and transshipments e.g. in the Strait of Malacca
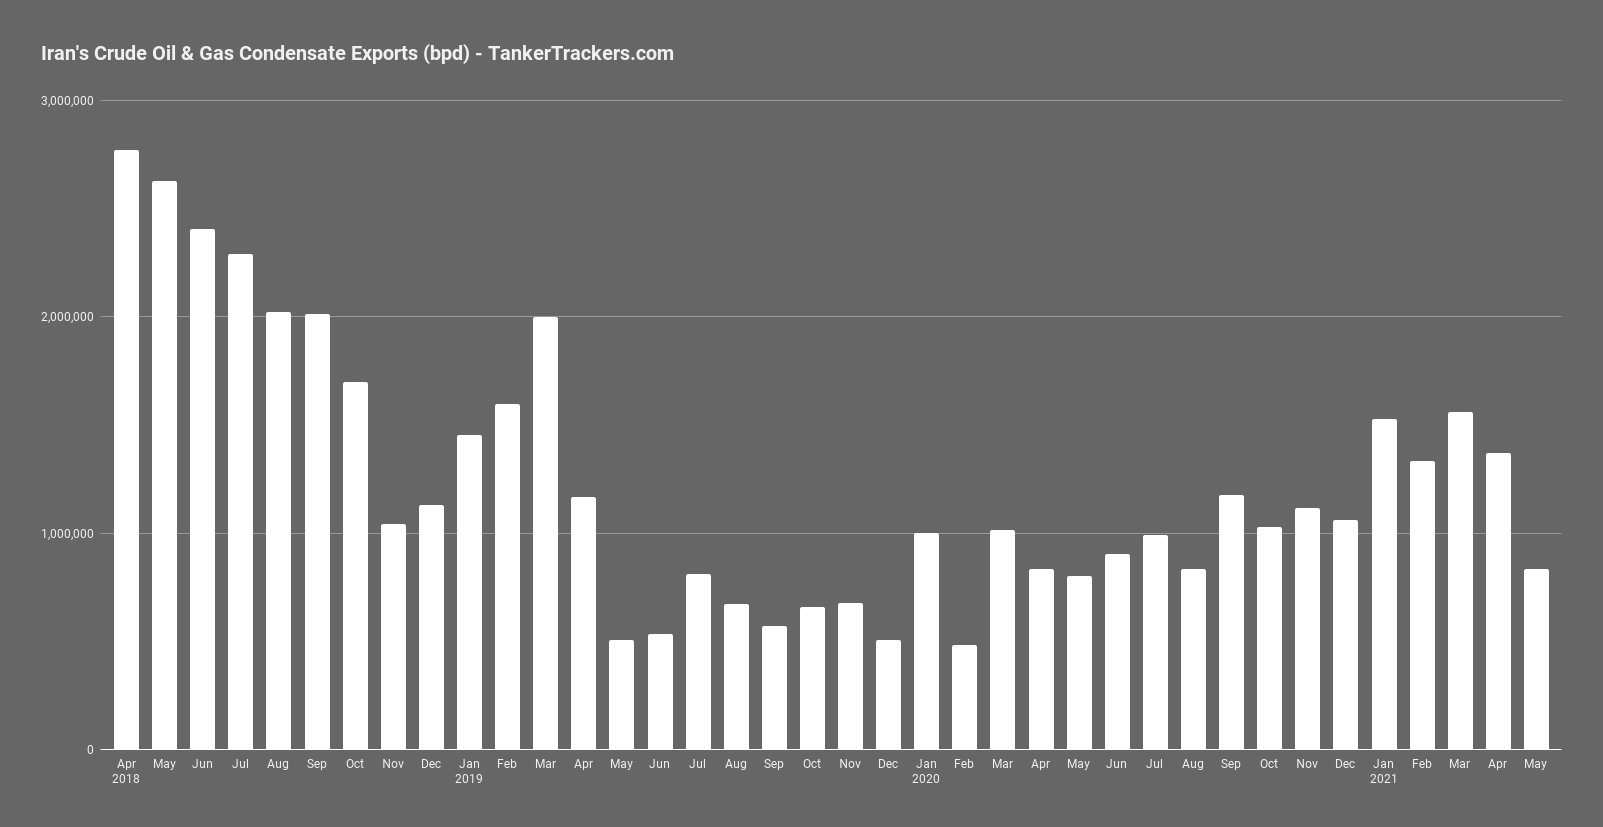
https://twitter.com/TankerTrackers/status/1403280955062771713/photo/1
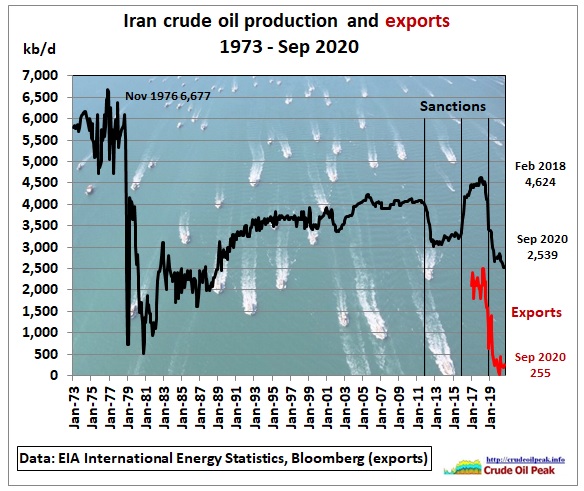
Update Sep 2020
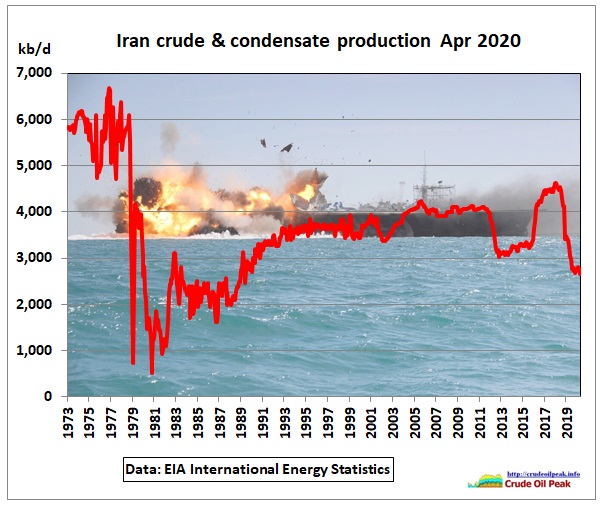
Update April 2020
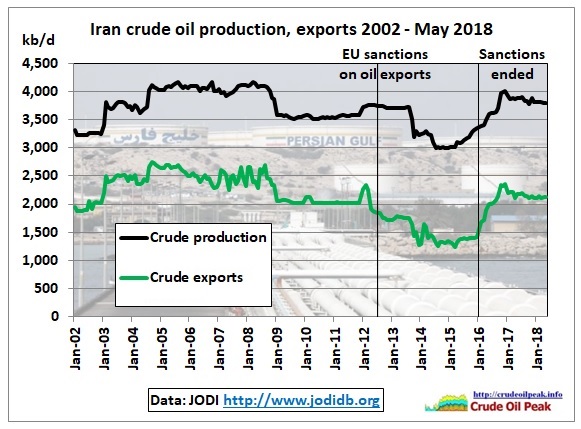
Update May 2018
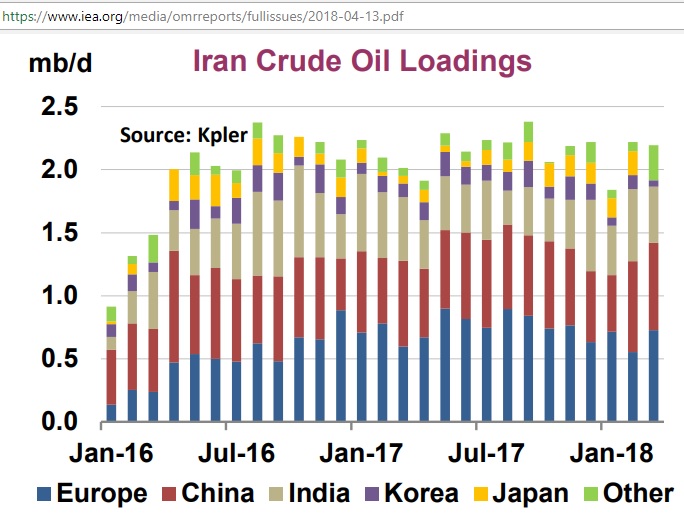
Update Mar 2018
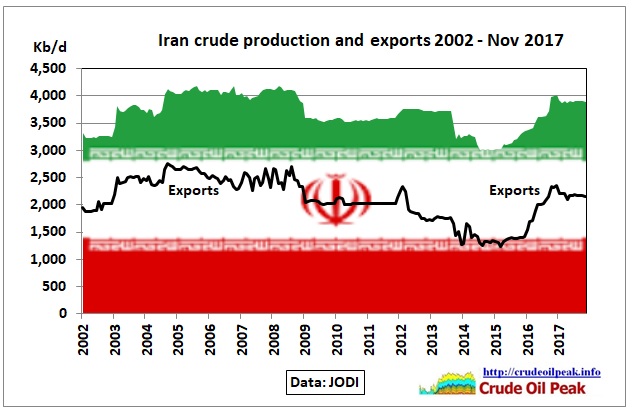
Update November 2017
Update December 2016
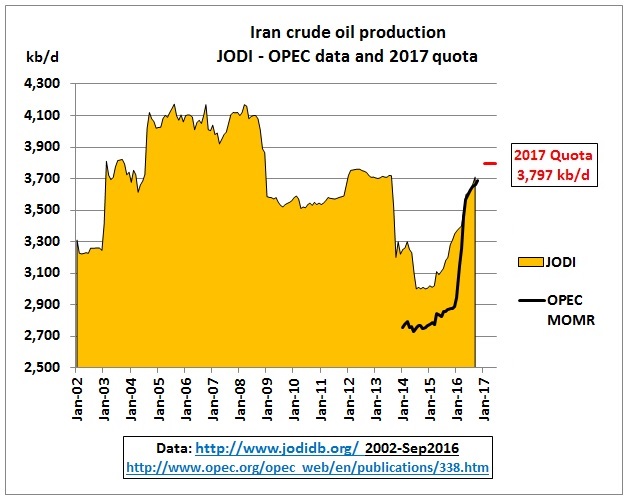
Graph from
8/12/2016
OPEC’s 2017 production cuts: a confusing numbers game (part 1)
http://crudeoilpeak.info/opecs-2017-production-cuts-a-confusing-numbers-game-part-1
Update February 2016
LARGEST GROWTH IN IRAN’S OIL PRODUCTION IN 2017; UNLIKELY TO REACH PRE-SANCTION LEVELS
23/2/2016
Rystad Energy’s latest research expects Iranian crude oil production to rise to 3.4 million barrels per day in 2017, from approximately 2.8 million barrels per day in 2015, reflecting the largest growth in oil production for almost a decade.
However, Rystad Energy’s analysis predicts that output will not reach the pre-sanction level, which is above 3.7 million barrels per day, mainly due to the country’s lack of new investment and declining production rate from maturing fields.

Update Dec 2015 with IEA data from Monthly Oil Market Report

June 2015 Update BP Statistical Review  Update May 2015
Extract from the recent IAEA report H. Possible Military Dimensions 63. Previous reports by the Director General have identified outstanding issues related to possible military dimensions to Iran’s nuclear programme and actions required of Iran to resolve these The Agency remains concerned about the possible existence in Iran of undisclosed nuclear-related activities involving military related organizations, including activities related to the development of a nuclear payload for a missile. Iran is required to cooperate fully with the Agency on all outstanding issues, particularly those which give rise to concerns about the possible military dimensions to Iran’s nuclear programme, including by providing access without delay to all sites, equipment, persons and documents requested by the Agency http://isis-online.org/uploads/isis-reports/documents/iaea-iranreport-05292015.pdf
Cumulative production of low enriched uranium continues to grow – graph attached from:  http://www.isis-online.org/uploads/isis-reports/documents/ISIS_Analysis_IAEA_Report_May_29_2015_Final.pdf Update Dec 2014
Iran’s fiscal break even oil price:  http://www.marketwatch.com/story/iran-venezuela-russia-may-face-pain-from-cratering-oil-prices-2014-12-01
Updated July 2014  http://www.eia.gov/countries/cab.cfm?fips=ir
Updated Nov 2013  Iran’s proven and probable (2P) remaining technical reserves (dark blue) have declined since 1970 to 75 Gb, compared to Iraq’s 2P reserves of 105 Gb (declining red line)
Updated 26/10/2013  Update 26/4/2013
 http://www.eia.gov/todayinenergy/detail.cfm?id=11011
Update November 2012
 http://omrpublic.iea.org/omrarchive/13nov12full.pdf
Update September 2012  http://online.wsj.com/article/SB10000872396390443589304577637743226236760.html
Update August 2012
 Iran’s 2nd and last oil peak http://crudeoilpeak.info/irans-2nd-and-last-oil-peak
Update July 2012

 http://omrpublic.iea.org/omrarchive/12jul12full.pdf
..  ..
..

..

17/8/2011 Iran crude oil decline to 2016
http://crudeoilpeak.info/iran-crude-oil-decline-to-2016

Petrol queues getting worse everyday – Tehran September, 2010 http://www.youtube.com/watch?v=Nzg7BXpWMjQ
Riot police in Tehran when regime cuts economic subsidies – Iran 19 Dec. 2010
http://www.youtube.com/watch?v=0O5gsRw5Ueo
Iranian riot police out in force as food and fuel subsidies end 19/12/2010 http://www.guardian.co.uk/world/2010/dec/19/iranian-riot-police-subsidies-end PRESIDENT Mahmoud Ahmadinejad has taken a big political gamble. 20/12/2010 http://www.theaustralian.com.au/news/world/prices-to-soar-as-iran-cuts-subsidies/story-e6frg6so-1225974109120 Why are there these problems? This graph explains everything:

Increasing local consumption will intersect with a declining production curve some time in this decade. In the following post I had used IEA data: 3/7/2010 Iran needs $130 oil to balance budget by 2015 when crude oil production is down by 700 Kb/d http://crudeoilpeak.info/iran-crude-oil-production-to-decline-by-700-kbd-by-2015-budget-neutral-oil-price-130 Dr. Ali Samsam Bakhtiari (rest his soul in peace) told me and others in ASPO in 2006 that Iran may no longer export oil by 2015. This is no secret as it follows from his estimate presented at the International Workshop On Oil Depletion IWOOD 2003 in Paris: A realistic view of long term Middle East production capacity http://www.peakoil.net/conferences/iwood-2003-paris Ali’s estimate for Iran from that presentation forms the underlay (blue area) for the above graph. Apparently he expected a collapse of oil production similar to what happened before and after the fall of the Shah:

Excerpts from Dr. Bakhtiari’s presentation to the Australian Senate Hearing on oil supplies in July 2006:
| Senator MILNE— ………..Let us assume there is a geopolitical crisis and Iran decides to stop supplying into that 81 million barrels a day. What impact would that have?Dr Samsam Bakhtiari—At present I think that Iran is supplying roughly two million barrels of oil for exports. In the case of some geopolitical problem, you would have to take the two million out of the 81 million. That in itself would not be very harsh. Why? Because major consuming countries have their strategic petroleum reserves. They could start taking it out of their reserves.What would be impacting heavily on the price is the psychological impact of any geopolitical happening, whether in the Persian Gulf or in South-East Asia. Because the leeway in [transition phase] T1 is extremely small—as I have tried to mention to you—the slightest impact geopolitically will have enormous consequences. If you had in Saudi Arabia, for example, or anywhere else, some two million to three million barrels of spare capacity—that you usually had before—then people would not be so worried about this geopolitical impact. But you do not have spare capacity anymore.I will give you just one example of what we in NIOC [National Iranian Oil Company] did in 1975 after the first price shock, when the price went from roughly $2 per barrel to $11 per barrel. To find out what the real price was NIOC set up an auction, saying, ‘We have a few barrels and we are going to auction these barrels, so whoever is interested should give us a bid.’ Through the bids, we found out what the real price was. Some bids were up to $41. There were people who were willing, at $11 per barrel, to pay $41.CHAIR—If I understand you correctly, you are saying that we should be investing now as a matter of priority in public transport.Dr Samsam Bakhtiari—Certainly, yes. Right now. As soon as possible. Start tomorrow on public transport. It is better than starting the day after tomorrow. You also have the problem that, at some stage, you will not be able to invest that easily. The further we go down the line, investment gets more difficult. People who think they will undertake projects in 10 years time do not realise the problems of making these projects.http://www.aph.gov.au/Parliamentary_Business/Committees/Senate_Committees?url=@Hansard/S9515.pdf |
Independent petroleum geologist Jeffrey J Brown http://www.aspousa.org/worldoil2010/Speakers.cfm?bid=1022 reminds us continuously: “Here is Sam’s forecast for Iranian net oil exports, showing actual net exports through 2006 (the 2007, 2008 and 2009 data points fall between his middle case and high case):”

“The projected 2005 to 2015 net export rate of change is shown, -4.9%/year–within a range from -11.9%/year to +2.1%/year. The actual observed net export rate of change, for 2005 to 2009, has been -1.4%/year.” http://www.theoildrum.com/node/7272#comment-753038 The above graph is from this article: A Quantitative Assessment of Future Net Oil Exports by the Top Five Net Oil Exporters http://graphoilogy.blogspot.com/2008/01/quantitative-assessment-of-future-net.html Iran’s oil reserves Iran’s 2P technical oil reserves are 60 Gb compared to “political” reserves of 140 Gb as calculated by Jean Laherrere, a French petroleum engineer:

http://aspofrance.viabloga.com/files/JL_Nice2010long.pdf
See also under OIL RESERVES, OPEC’s PAPER BARRELS. ————- Impact of Iran’s oil peak in the 2nd oil crisis 1979 ———————  Between 1965 and 1979, global oil production more than doubled from 31.8 mb/d to 66 mb/d. Iran’s oil production tripled between 1965 and 1973, but then peaked up to 1976, long before the revolution year of 1979. Iran had overproduced. Their production to reserve ratio in the 1970s of 3.8% pa was more than 3 times that of rivalling Saudi Arabia at 1.3% pa The following graph shows incremental production after the 1st oil crisis in 1973:

Above the horizontal axis we have countries with growing production, below the axis countries with decreasing production. All data are relative to production levels in 1973, using data from the BP Statistical Review. (1) Growing countries (green areas) increased steadily, irrespective of oil crises, recessions or otherwise (2) By 1979 that growing group had increased oil production by +8.3 mb/d, far exceeding decline elsewhere, including Iran, of -4.7 mb/d. (3) In the same year, Saudi Arabia, Iraq and other Middle East countries had increased production by 4 mb/d compared to 1973 (4) But the Iranian revolution in 1979/80 brought the whole system out of balance. In 1980, decline in Iran and elsewhere, including Kuwait and Libya had reached -7.9 mb/d while production in the growing group had increased to just +9.1 mb/d due to annual growth slowing down from +1.4 mb/d pa to just +800 kb/d pa. (5) A year later, in 1981, the balance had tipped. Decline and/or production cuts amounted to -11 mb/d while the growing group made just +9.9 mb/d. On the graph we see the cross-over point where the mirrored decline curve goes above the “Rest Eurasia” area. Saudi Arabia, then a swing producer, kept the system alive. (6) In the following years up to 1985/86 we can clearly see that decline exceeded growth
Conclusion: Some claim the 2nd oil crisis was artificial. This cannot be supported by oil statistics. The Iranian oil peak between 1973 and 1976, the following production decline – exacerbated by the revolution-, as well as production declines and/or production cuts in other countries brought the global oil supply system out of balance and out of rhythm until the mid 80s. The next peaking event was the peaking of the West Siberian oil fields in Russia in 1987, which can also be seen on the graph.