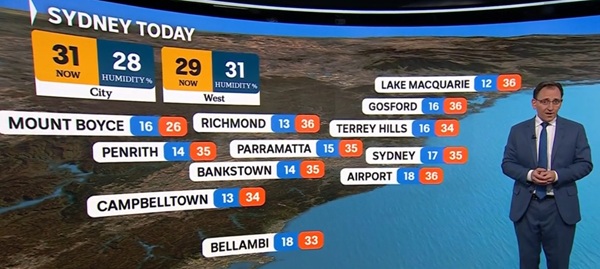
NSW was surprised by an early, short heatwave of 35 degrees in Sydney, followed by a rainy day
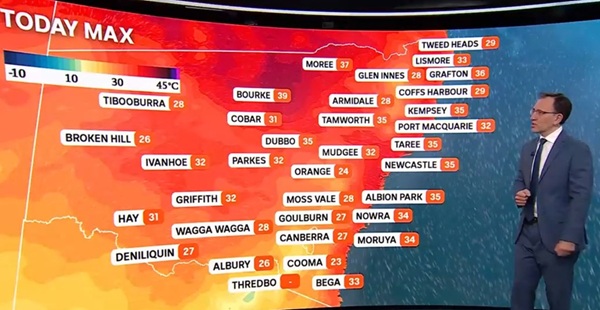
No cooling sea breeze. Temps from the coast to the West 35 degrees
4 coal units were offline: Mount Piper MP02, Eraring ER01 and ER03, Bayswater BW03, very likely still under maintenance?
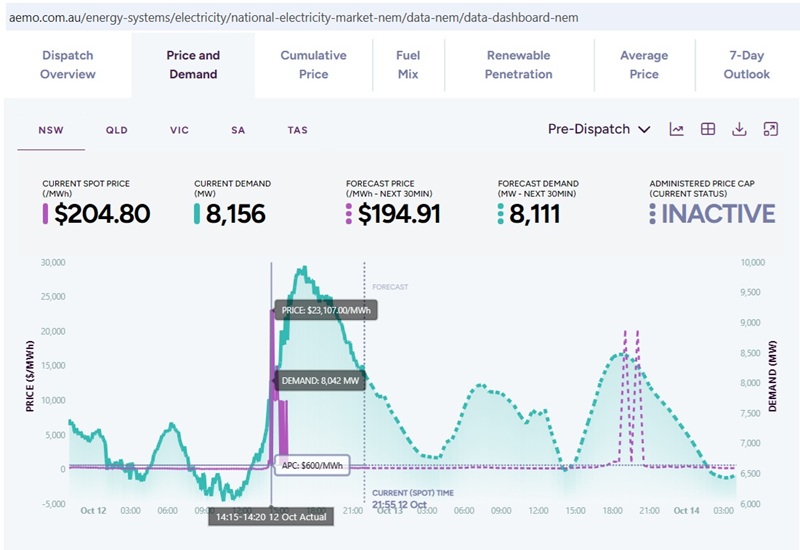 Fig 1: Prices $23,107/ MWh spiked at 2:20 and 2:30 pm, at$15,000 at 2:50 pm
And $10,000 spikes continued several times until 3:35
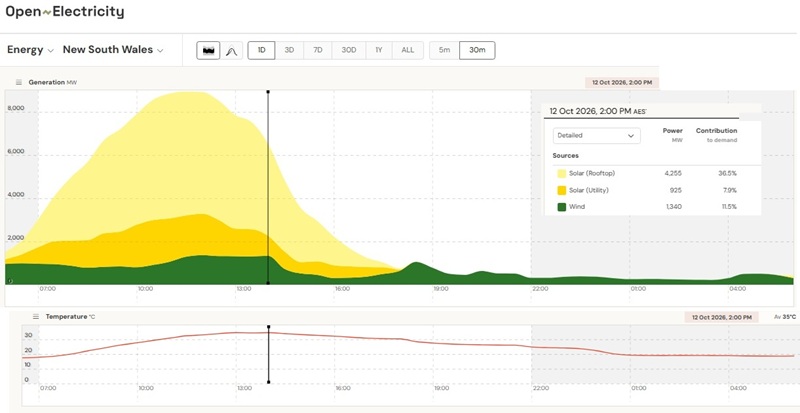 Fig 2: Solar power dropped early as clouds moved in
But temperature remained high throughout the whole afternoon. As rooftop waned, domestic demand usually covered by these PV panels had to go to the grid and increased measured demand there.
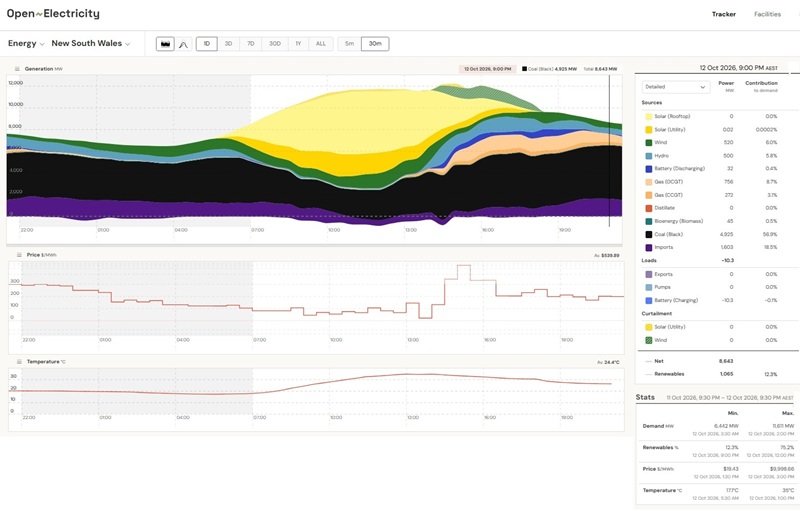 Fig 3: Power generation by fuel including imports
Coal power was 3,700 MW at 2 pm and ramped up to 5,000 MW by 21:30
VP 1,012 of 1,320 MW
MP 731 of 700 MW
ER 1,212 of 1,440 MW
BW 2,030 of 1,980 MW
Total 4,985 of 5,540 MW = 90% Not much room there to generate more.
Lower aggregate coal unit availability, feeding into spikes in futures pricing (at least for 2026 Q4)
12 Oct 26
https://wattclarity.com.au/articles/2026/10/12oct-coalavailability-tightens/
A quick look at coal unit availability (yesterday – Monday 12th Oct – and in the coming days)
13 Oct 26
https://wattclarity.com.au/articles/2026/10/12oct-coalavailability/
Gas came to the rescue and some hydro. Batteries discharged early (while the sun was still shining) to make profits from high prices so there was not much charge leftover for the late evening. The curtailing of wind at that critical time of the day can only be explained by limitations in transmission lines.
A pattern is emerging … (poorly tuned Demand Response and/or forecasts?) see-sawing Demand and gyrating NSW Price
12 Oct 26
https://wattclarity.com.au/articles/2026/10/12oct-seesaw-nsw-volatility/
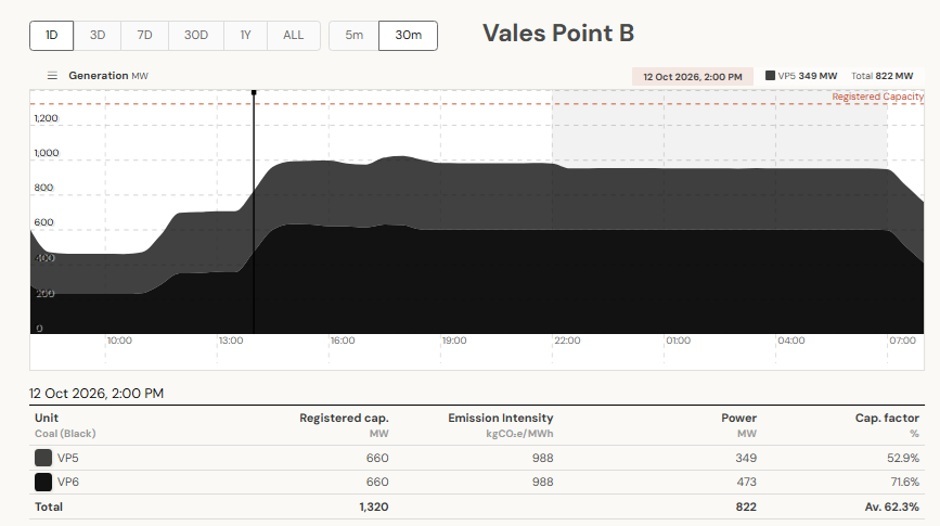 Fig 4: Vales Point at 2pm near to max
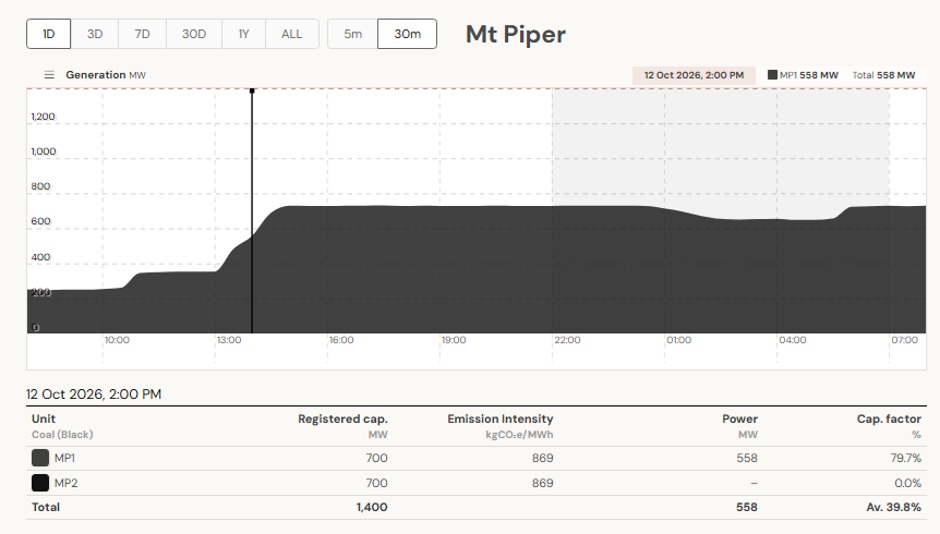 Fig 5: Mt Piper at 2pm near to max
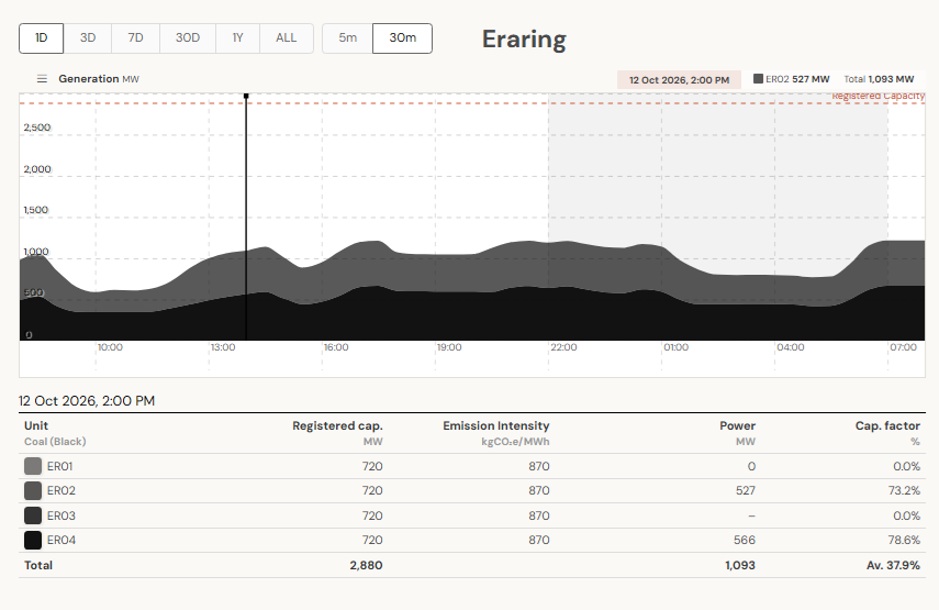 Fig 6: Eraring on bumpy plateau
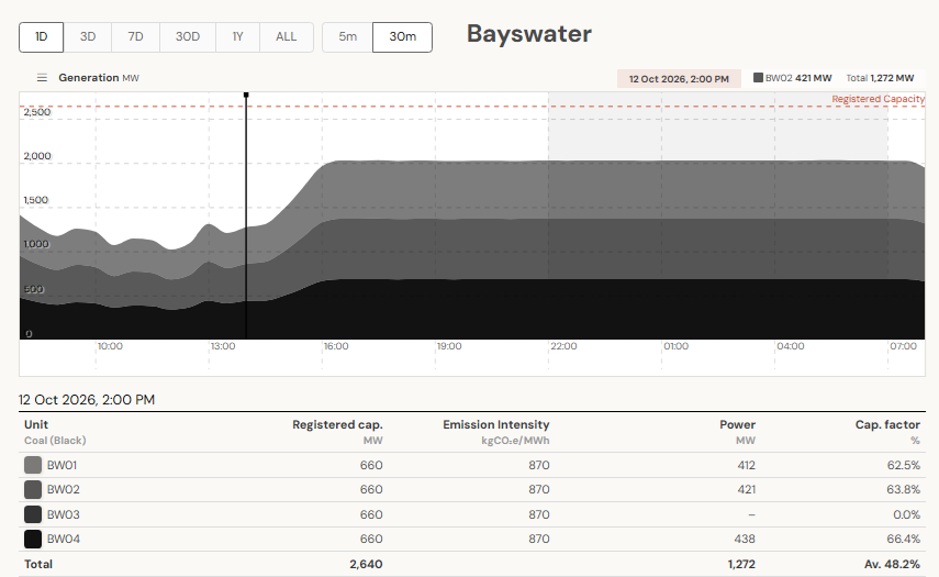 Fig 7: Bayswater was able to ramp up more than the other plants but only up to 6 pm
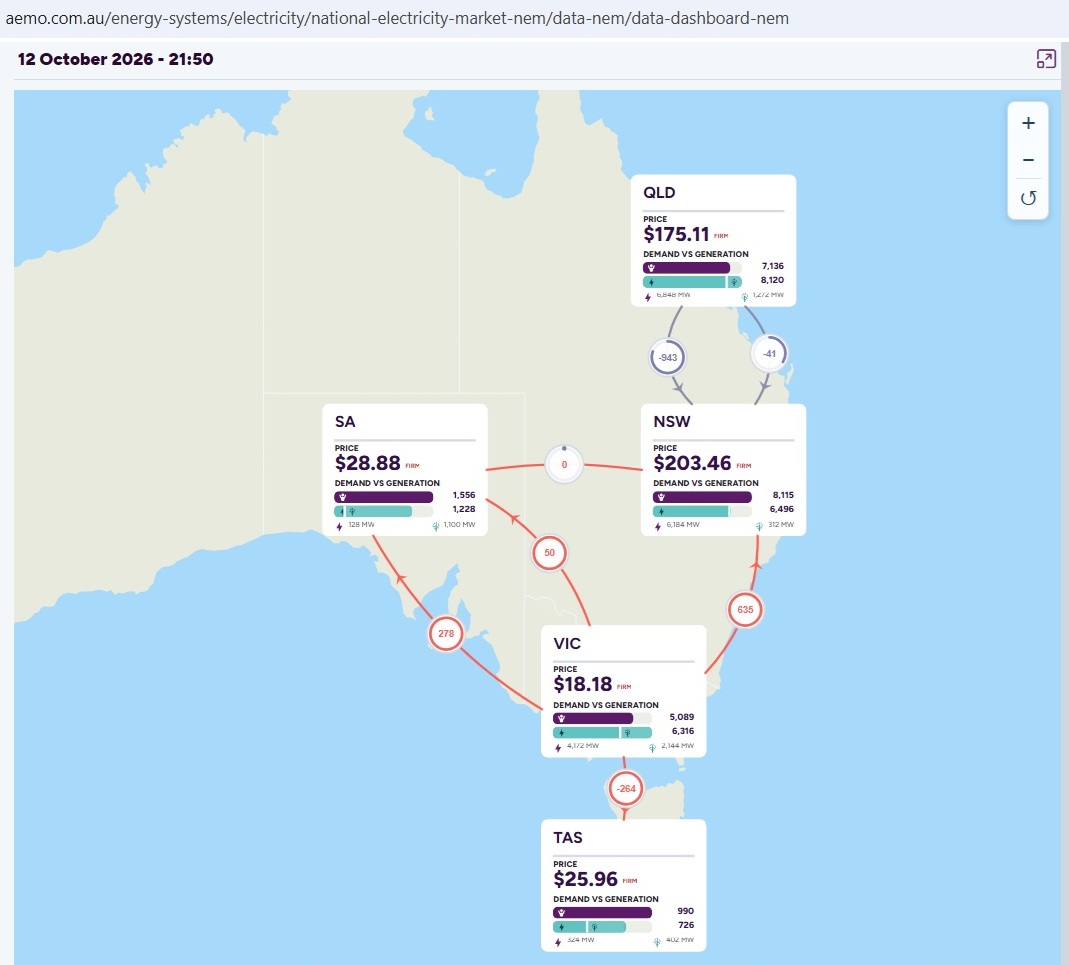 Fig 8: NSW is utterly dependent on power imports from both Queensland and Victoria
Outlook (for the next day in hindsight)
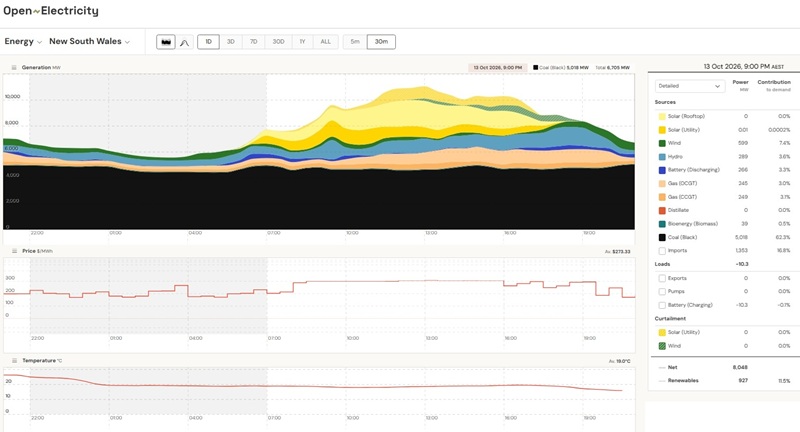 Fig 9: NSW generation next day, 13th Oct. Rainy day.
Less sun, no wind, coal generation flat at 90% of available capacity. Gas and hydro compensate. Batteries marginal contribution as there was not sufficient solar power for recharging.
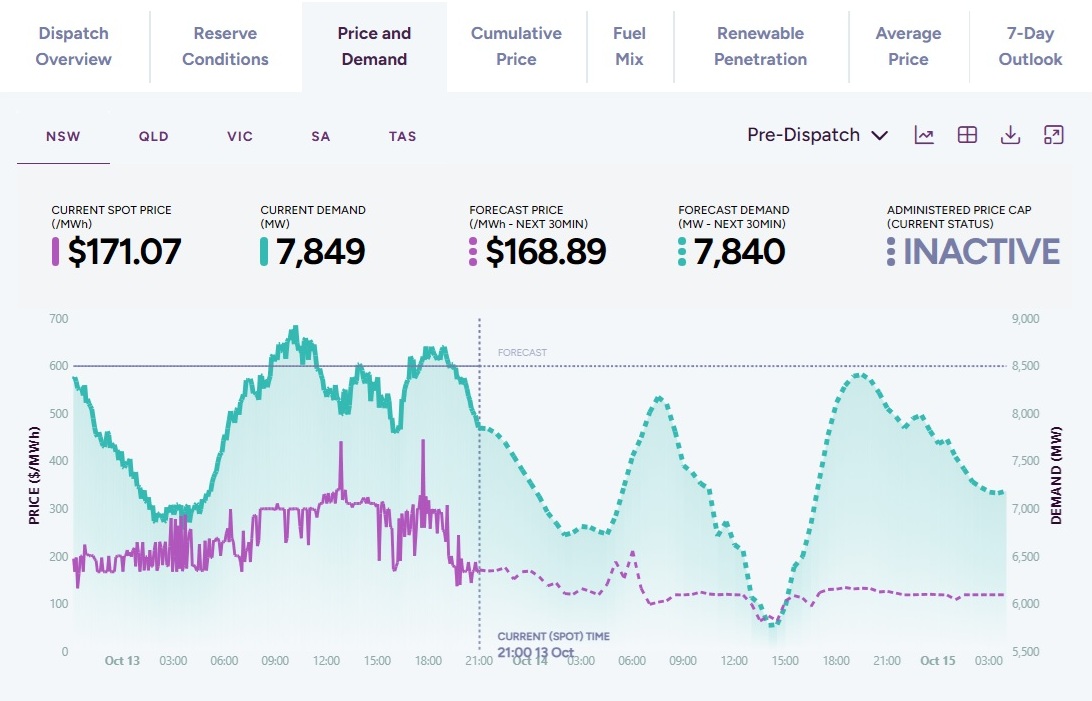 Fig 10: Prices between $200 and $300 with 2 spikes at $400/MWh
Conclusion:
We are going to experience many different weather events, many yet unknown and unmodeled. In critical periods every MW counts. Demand must be reduced. We cannot afford increasing power demand which will just push up prices. For several months we had an endless debating club on immigration. No one has calculated which visa class will require how much power in the next years and where in the grid. And it is an untested assumption that EVs can always be recharged from solar power. Data centres are another problem.