Tuesday, 4th February 2025
 Fig 1: Temperatures in the Sydney basin 4 Feb 2025
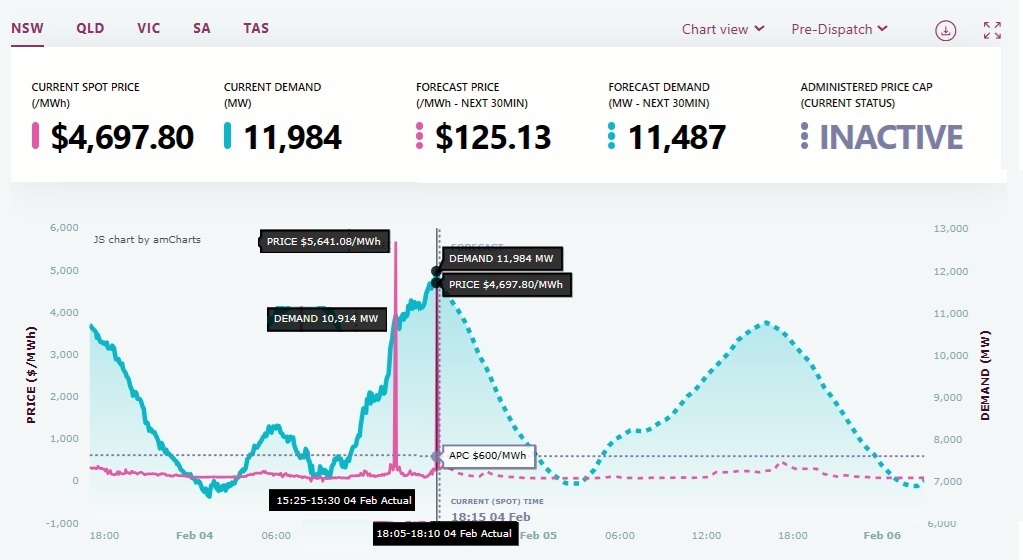 Fig 2: 2 price spikes up to $ 5,600 /Mh in the afternoon and evening
The first spike at 3:30 resulted from an early ramp-up of hydro plus gas peaker for a short period of power exports (see Fig 3 the area under the time axis) to Victoria which suffered from a sudden drop of coal and wind generation.
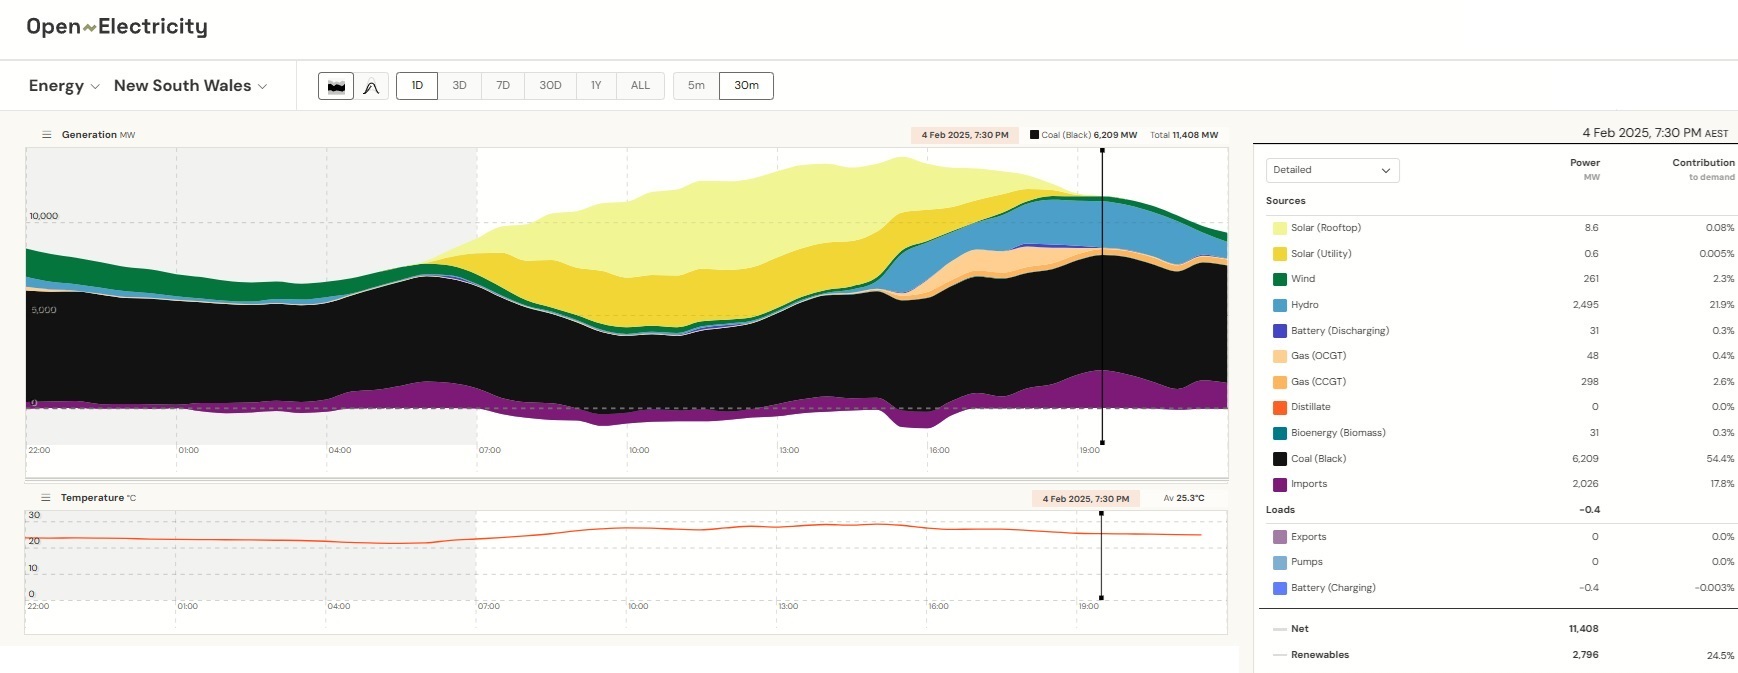 Fig 3: NSW power generation by fuel type (lower panel with temps)
At 7:30 pm in round numbers:
(a) coal 6,200 MW,
(b) pumped hydro 2,500 MW. Another problem at Snowy2:
More work stops on Snowy 2.0 as union warns of lengthy delays to $12 billion project
More underground work at the Snowy 2.0 pumped hydro project has now stopped as a union raised further safety fears over “last resort” refuge chambers designed to protect workers on tunnelling projects in an emergency.
https://www.abc.net.au/news/2025-01-29/more-work-stops-on-snowy-hydro/104873152
(c) imports a whopping 2,000 MW, of which 1,200 MW from Qld
(d) wind only 260 MW
(e) CCGT gas 300 MW
(f) batteries negligible at 30 MW
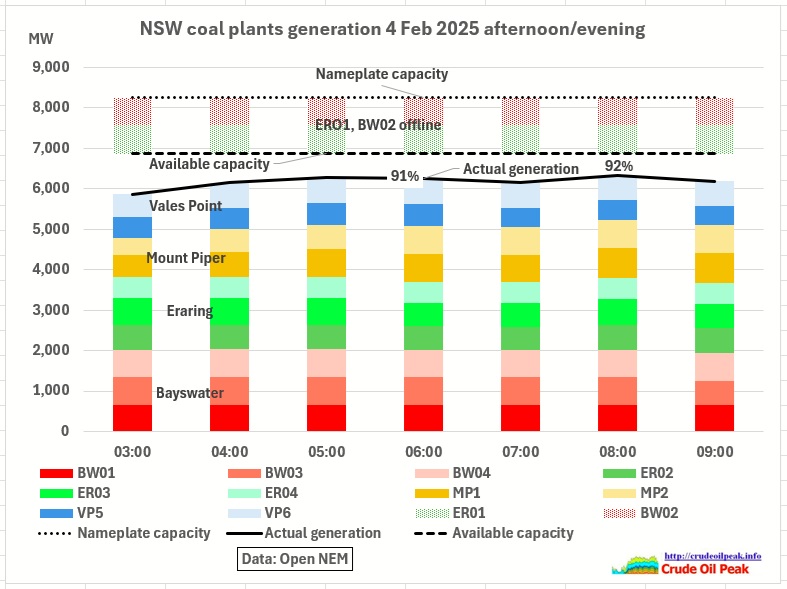 Fig 4: NSW coal plant generation by unit
Eraring ER01 was offline since 3 February 10:30 pm. That was 36 hrs after ER04 had come back. Eraring has continuing problems to keep all 4 units running at the same time.
Here is a list of Eraring problems by WattClarity
https://wattclarity.com.au/articles/tag/eraring-power-station/
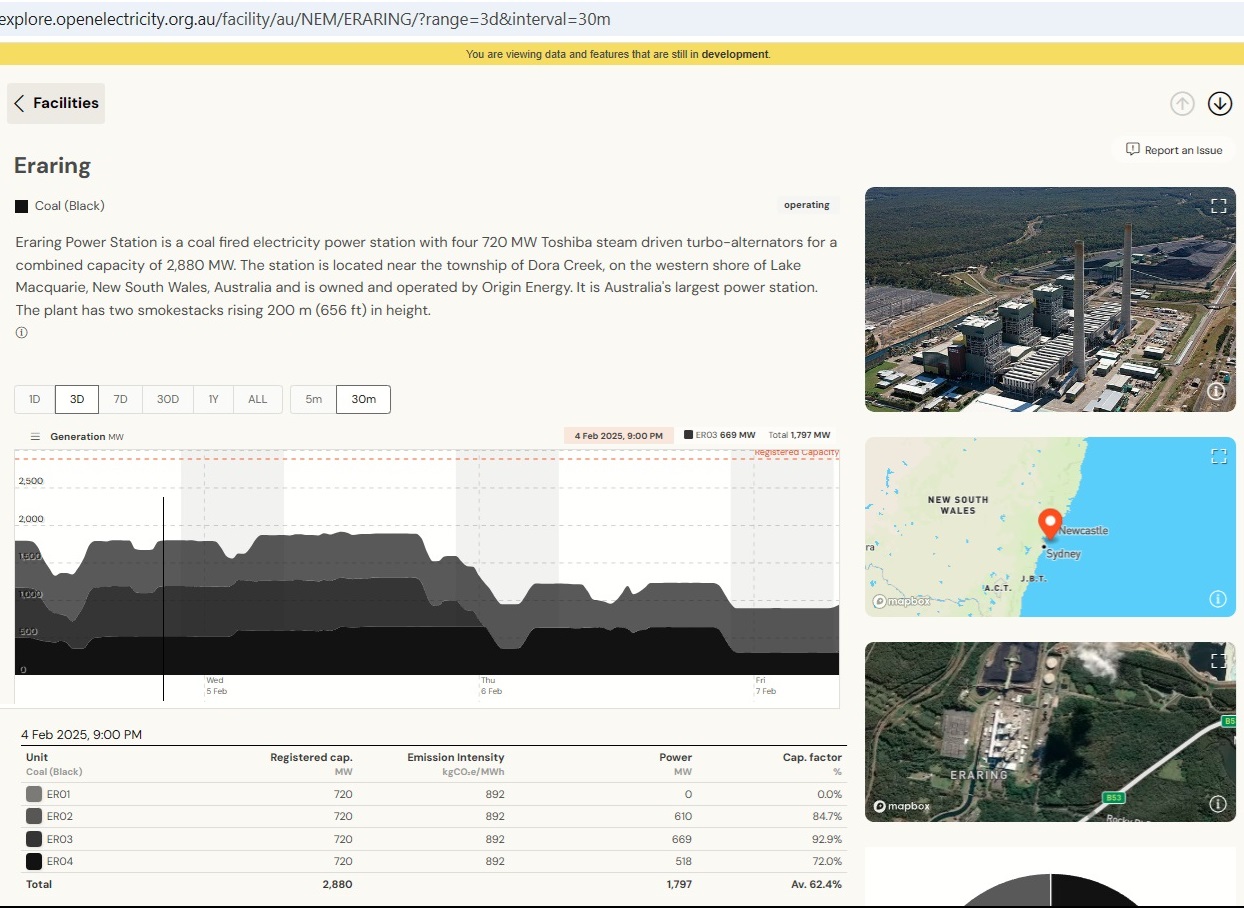 Fig 5: Eraring generation 4-7 February
We see that ER03 went again offline on 6 Feb midnight.
Remember that the NSW is underwriting the operation of Eraring
https://www.energy.nsw.gov.au/nsw-plans-and-progress/regulation-and-policy/agreement-eraring
but only up to 6 TWh pa. The generation in the last 12 months was 15.2 TWh
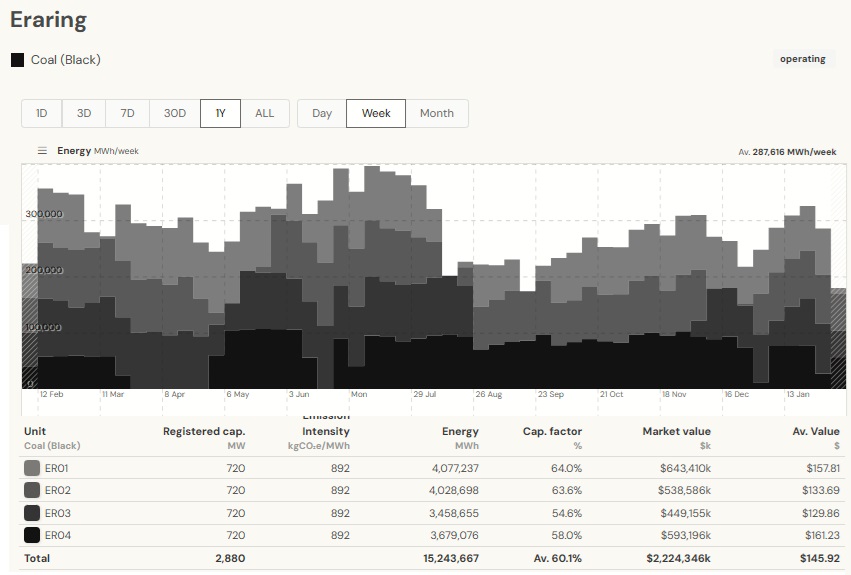 Fig 6: Eraring weekly generation by unit over last 12 months
The capacity factors for units 3 and 4 are quite low. This has of course also to do with the fact that during daytime solar power is taking over. The factors for other coal plants: Bayswater 70%, Mt Piper 61% and Vales Point 56% (even worse)
According to the underwriting agreement Origin Energy must advise the NSW government by March (very soon) whether it wants to trigger Generator Engagement Project Agreement for the next financial year.
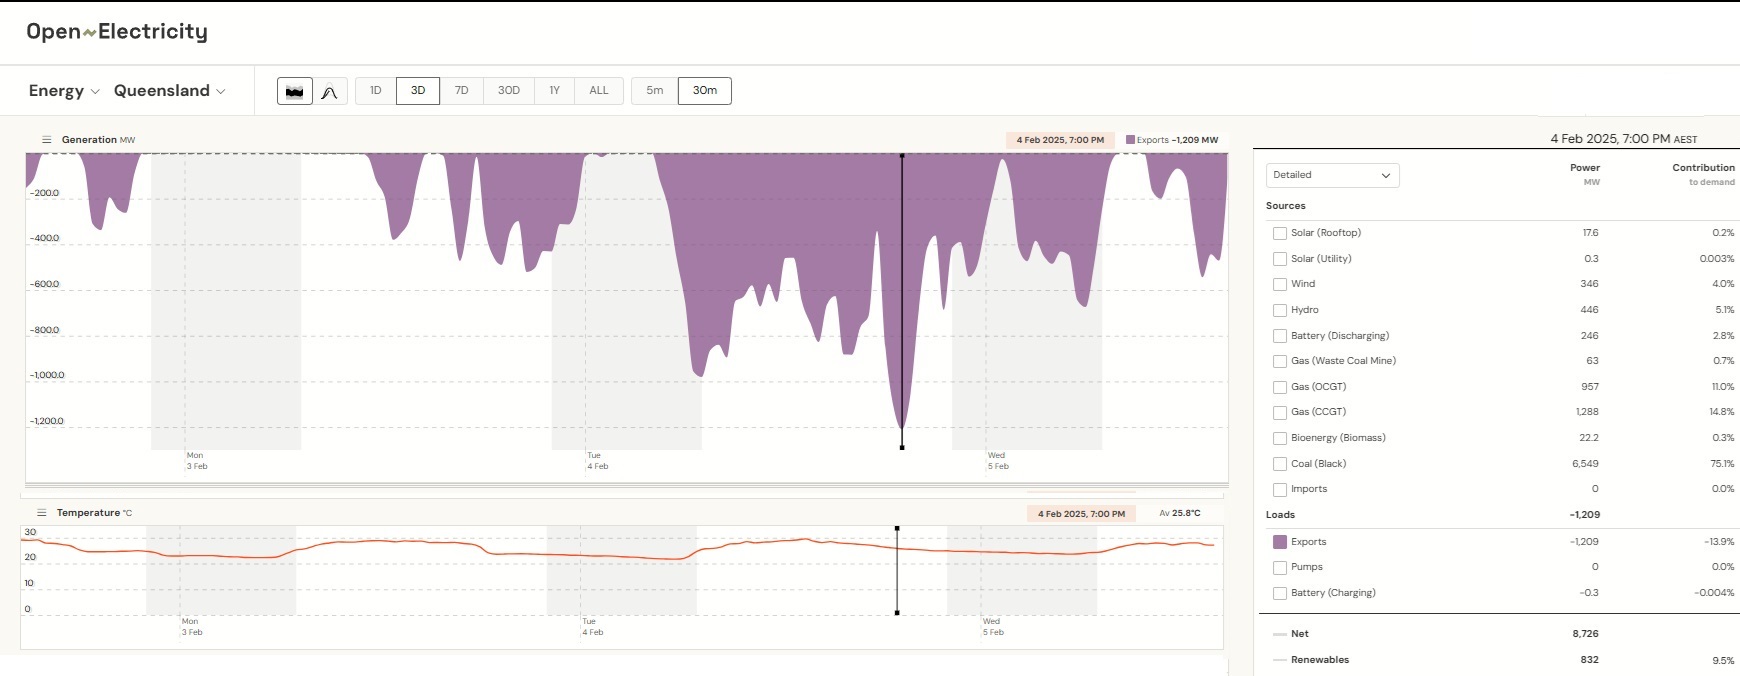 Fig 7: Qld power exports to NSW 3-5 Feb (negative because it’s a load for Qld)
NSW is living continuously beyond its means during peak hrs.
The imported power from Queensland is mainly from coal and gas:
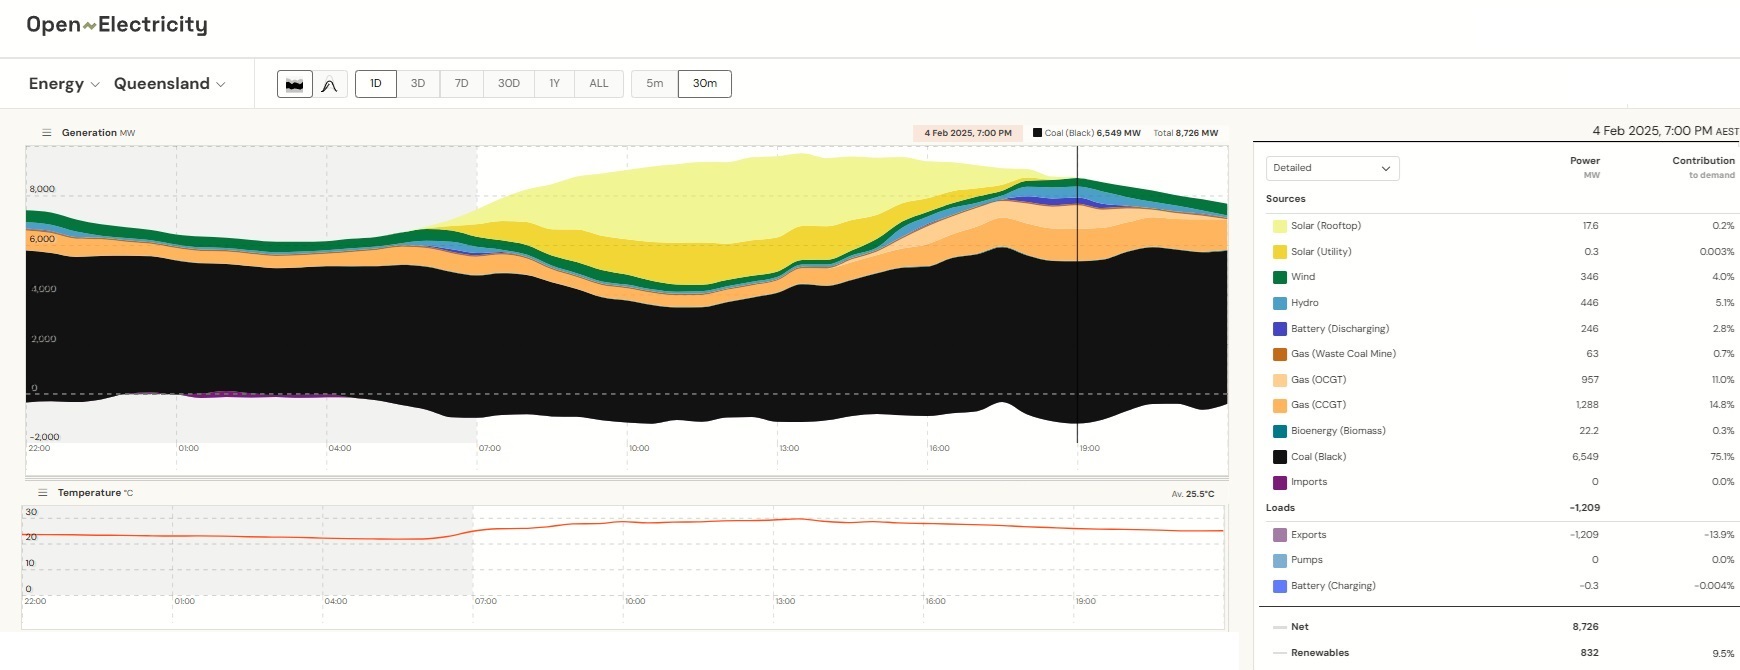 Fig 8: Queensland generation by type of fuel
Let’s add the imports from Victoria
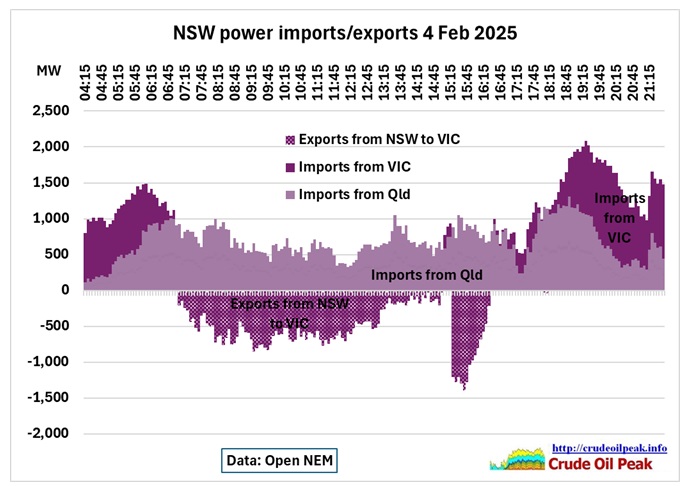
Fig 9: NSW power imports and exports
The short NSW export spike (from hydro and gas) at 15:20 was necessary to cover a sudden drop of generation from brown coal and wind in Victoria as already mentioned above.
Lack of reserve warnings by AEMO:
Forecast LOR1
#124059 From 1630 hrs 04/02/2025 to 2030 hrs 04/02/2025.
The forecast capacity reserve requirement is 1703 MW.
The minimum capacity reserve available is 1136 MW.
#124091 From 1830 hrs 04/02/2025 to 2030 hrs 04/02/2025.
The forecast capacity reserve requirement is 1652 MW.
The minimum capacity reserve available is 974 MW.
Forecast LOR2 (more critical than LOR1)
#124121 From 1730 hrs 04/02/2025 to 1830 hrs 04/02/2025.
The forecast capacity reserve requirement is 948 MW.
The minimum capacity reserve available is 664 MW.
https://aemo.com.au/en/market-notices
Sydney was lucky so far with the weather in January 2025. BOM found:
- Mean maximum temperatures for January at most sites across Greater Sydney were close to average to below average.
http://www.bom.gov.au/climate/current/month/nsw/sydney.shtml
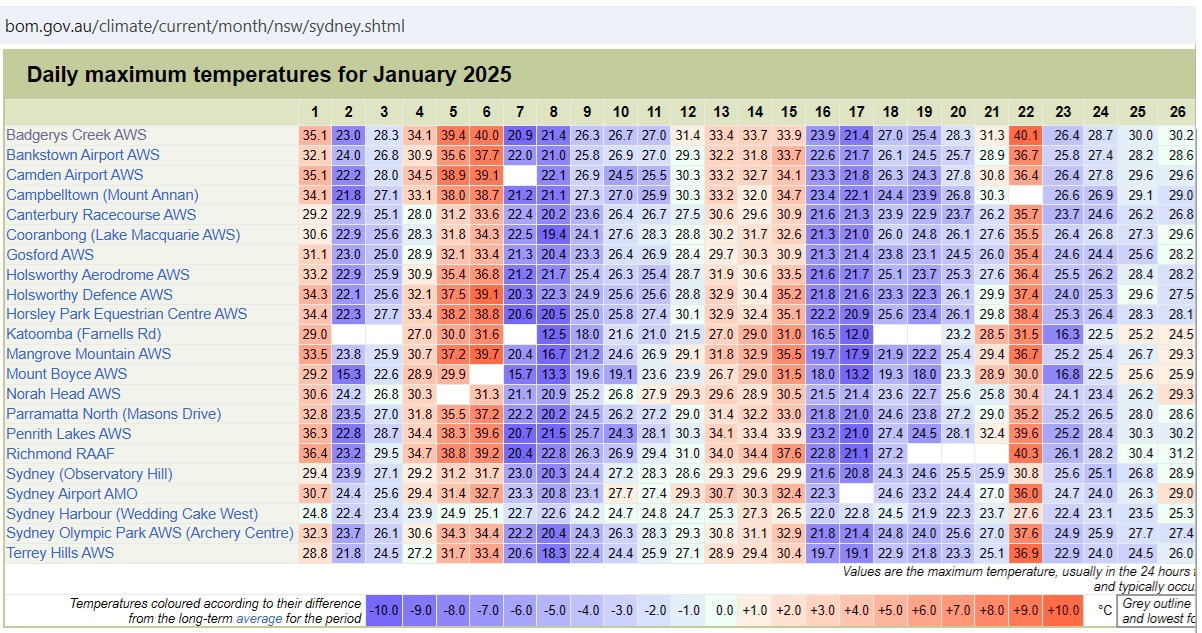 Fig 10: Below (slate blue) and above (red) average temperatures in Sydney in January 2025
We see below average dominated. Also, above average temperatures never lasted for more than 3 days so heat could not accumulate in concrete structures for a longer time.
Conclusion:
Watch out what is happening with Eraring and also Vales Point. In the endgame, these plants will run out of available spare parts and or economically/financially affordable re-tooled parts. Remember it took more than 3 years to get back Callide C4 (Biloela, Central Queensland) which suffered a hydrogen explosion in 2021.
Governments optimistically think that we can replace coal plants in time with renewables and storage (batteries and pumped hydro). But that is an untested assumption. The current business as usual policies (perpetual growth of everything) include high rates of immigration which require to build 100s of apartment towers each of which with an additional peak load of 2-3 MW. Good luck.
Addendum
It seems those short NSW export spikes occur more often
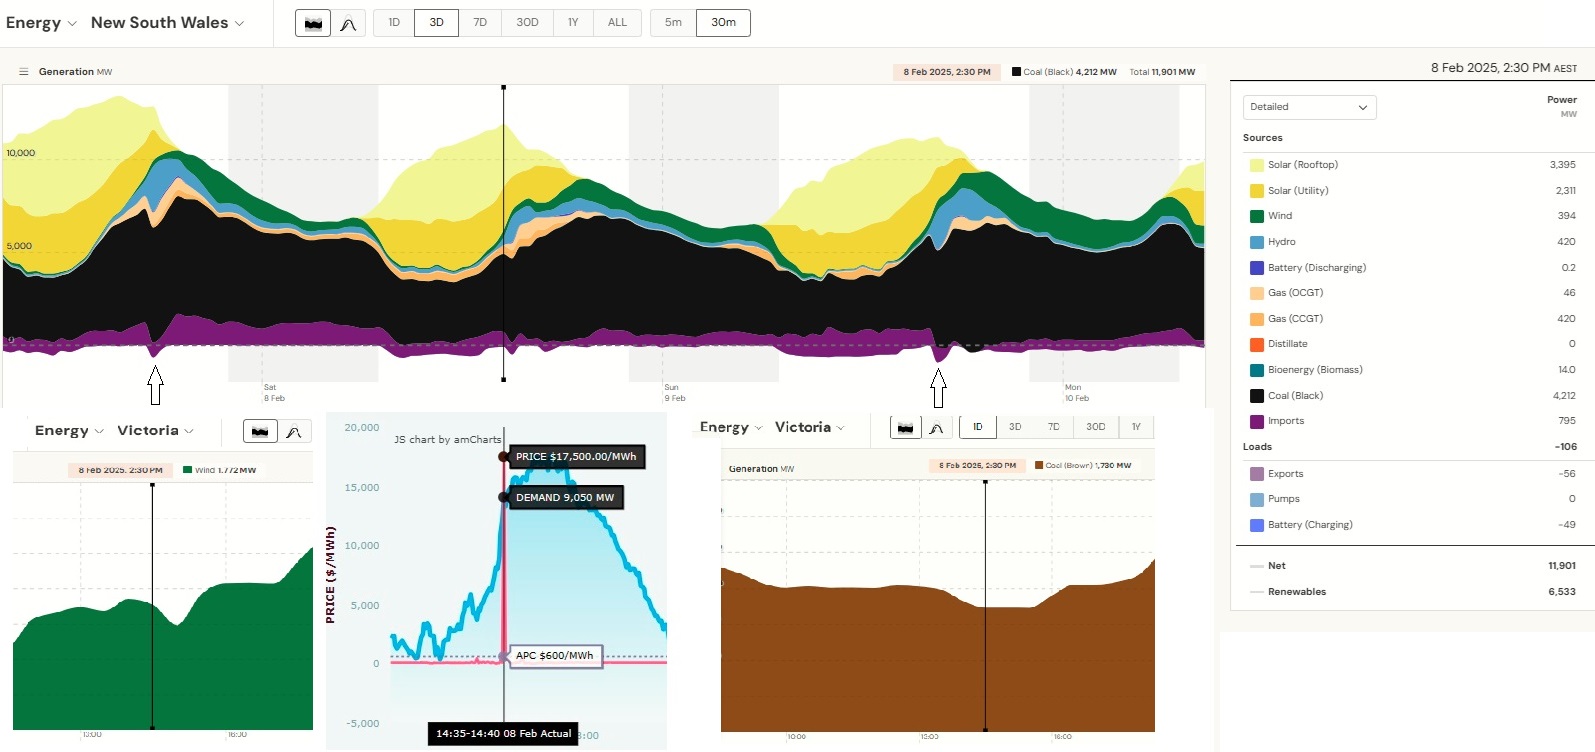 Fig 11: NSW generation 7-10 Feb 2025 with insert of details of price spike 8 Feb