In April 2011 the IMF predicted oil prices – at that time US$ 80 – would increase by 60% within a year, i.e. US$ 128. Actual oil prices in April 2012 were around $120, not far off the forecast.
One year later, an IMF team has come out with another warning. They used a model which considers both oil depletion and additional oil production resulting from higher oil prices. The result:
- the global economy grows at 4% pa (all governments would like that)
- global oil supplies could grow 0.9 % pa (by an additional 8.2 mb/d)
- pay a hefty oil price of US$ 180 a barrel by 2021
Their conclusion:
“While our model is not as pessimistic as the pure geological view, which typically holds that binding resource constraints will lead world oil production onto an inexorable downward trend in the very near future, our prediction of small further increases in world oil production comes at the expense of a near doubling, permanently, of real oil prices over the coming decade. This is uncharted territory for the world economy, which has never experienced such prices for more than a few months. Our current model of the effect of such prices on GDP is based on historical data, and indicates perceptible but small and transitory output effects. But we suspect that there must be a pain barrier, a level of oil prices above which the effects on GDP becomes nonlinear, convex. We also suspect that the assumption that technology is independent of the availability of fossil fuels may be inappropriate, so that a lack of availability of oil may have aspects of a negative technology shock. In that case the macroeconomic effects of binding resource constraints could be much larger, more persistent, and they would extend well beyond the oil sector.”
http://www.imf.org/external/pubs/ft/wp/2012/wp12109.pdf
These graphs describe the model

Fig 12: Global GDP growing by 40% over the 10-year period 2011-2021

Fig 10: oil production Point forecast: 2011: 31.2 Gb pa = 85.5 mb/d 2021: 34.2 Gb pa = 93.7 mb/d Additional oil required: 8.2 mb/d
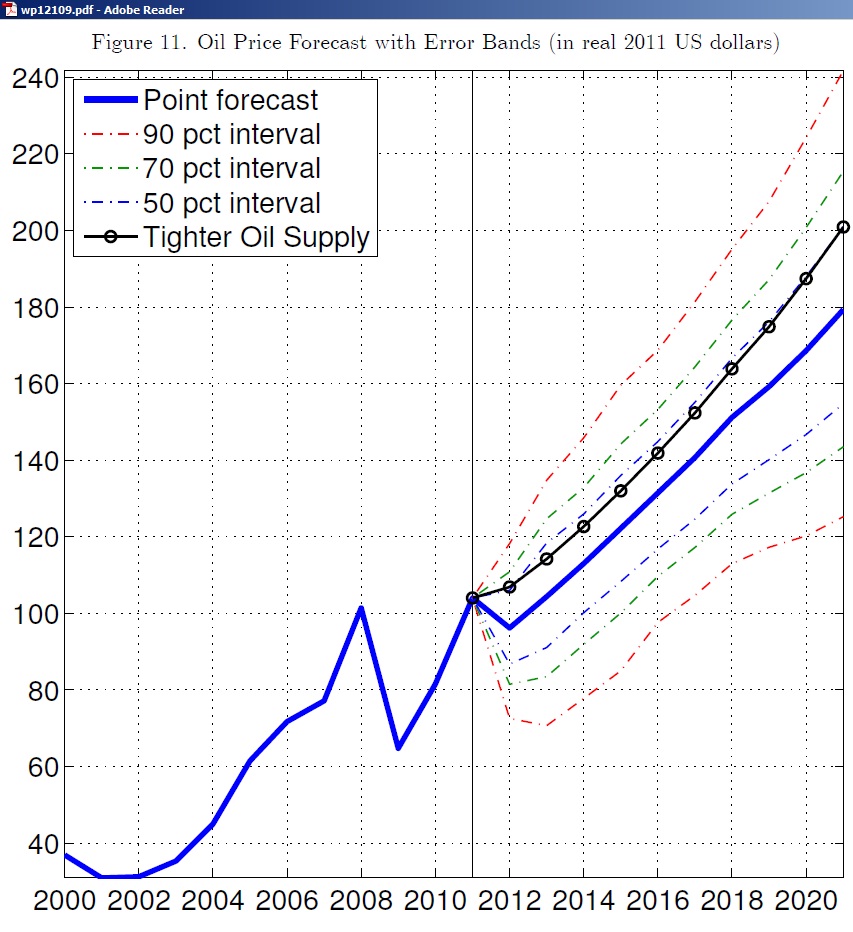
Fig 11: oil prices Point forecast: US$ 180 by 2011, even higher with lower oil supplies
An easy-to-understand description of the model can be found on the website of Gail the Actuary (co-editor of the Oildrum)
As the IMF model is based on data of the IEA, let us put the IMF oil production curve into a graph using IEA data from the monthly oil market report (OMR) and world energy outlooks, in particular the WEO 2011
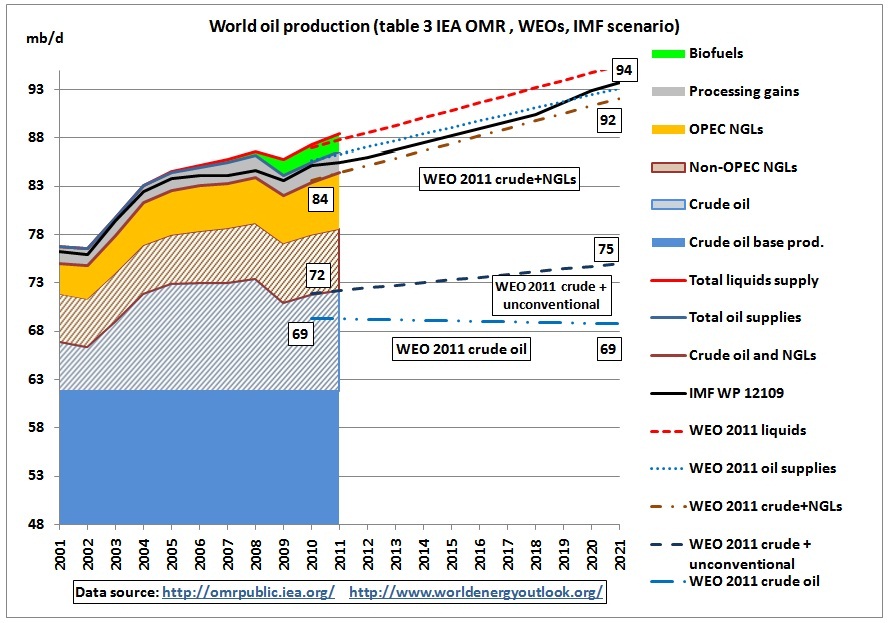
On the left hand side of the graph we see crude oil production, natural gas liquids production (NGL), processing gains (grey) and biofuels (green) as reported in the monthly oil market reports. NGLs are from OPEC (orange, from the OMR) and Non-OPEC (brown hatched, from WEOs). The crude oil base production (light blue) is the sum of all minimum production levels achieved by each country between 2001 and 2011. The hatched area denotes incremental production as shown in the graph below.
On the right hand side we have the projections from the WEO 2011 (new policies scenario): crude oil only, crude oil plus unconventional oil, all crude plus NGLs, then adding processing gains and biofuels. We see the IMF curve is somewhere above the IEA’s crude + NGLs line. This is the graph from the WEO 2011

http://www.worldenergyoutlook.org/
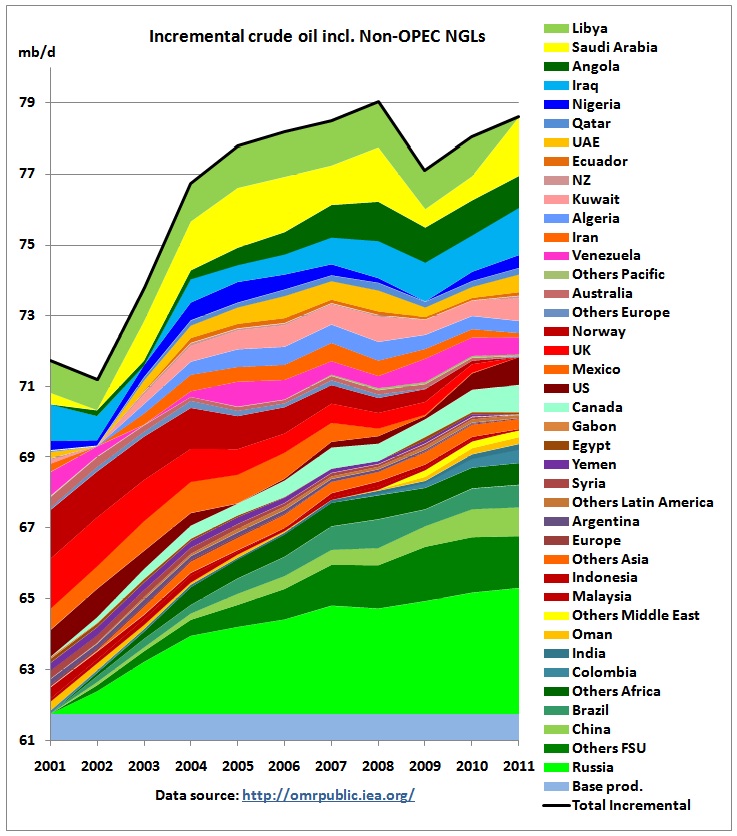
This graph is similar to the other incremental graphs on this website, but the data are from the IEA and Non-OPEC countries include NGLs. The stacking order is as follows, from bottom:
- Russia and Non-OECD countries growing (in green and yellow – from ME)
- various Non-OECD countries in decline
- OECD countries growing (e.g. US shale oil and syncrude from Canadian tar sands)
- OECD countries in decline (North Sea, Mexico)
- OPEC countries in decline (Venezuela, Algeria and Iran)
- The majority of OPEC countries including Libya on top to show the impact of the war
Looking at the above graph, the $64 million question is now: from which countries will those 8.2 mb/d come from? What type of oil will that be? The WEO 2011 does not see crude oil production increasing in the new policies scenario and even in the current policies scenario the increase is around 1 mb/d, a fraction of additional oil needed in the IMF scenario. Here are the detailed projections:
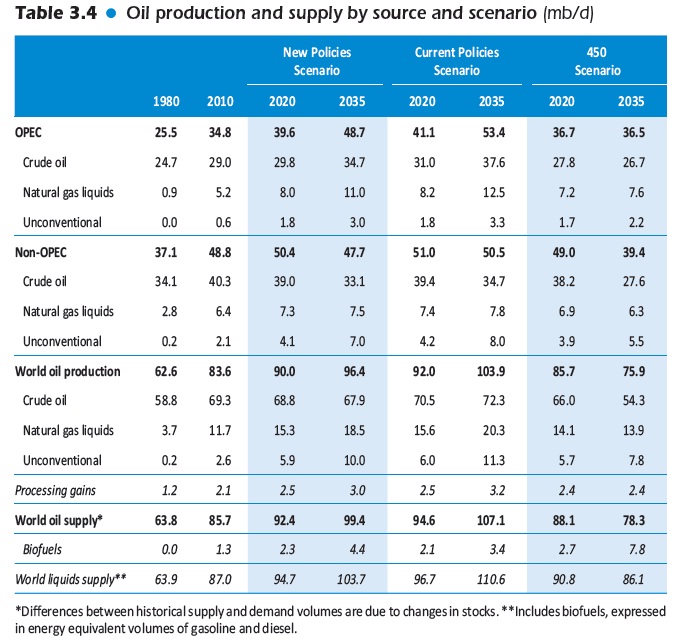
From the WEO 2011 graphs and this table it is clear that most of the additional oil will be natural gas liquids and unconventional syncrude. The NGLs are of course not as versatile as crude oil which is the main refinery feedstock. Most of the unconventional oil comes from what could rather be called mining operations. The IMF would therefore have to fine-tune their model to various types of oil.
Other factors which need to be considered:
- While the above supply elasticity of GDP growth seems to be in line with the demand elasticity in the February IEA OMR report

- Elasticities would be different from region to region:
 As calculated in the IEA Medium Term Oil Market Report http://www.iea.org/publications/free_new_Desc.asp?PUBS_ID=2392
-
Oil prices as a function of crude oil exports rather than production
-
Impact of oil prices on economies in countries where oil production has peaked
-
Budget neutral oil prices in key oil producing countries (e.g. Nigeria, Iran)
-
Resource nationalism (e.g Argentina)


Video presentation
 Michael Kumhof (IMF) on The Future of Oil, Geology vs. Technology
http://www.youtube.com/watch?v=wKsnCXBXi7I
From this set of presentations at the Institute of International European Affairs (IIEA)
Energy: The next systemic risk to Banking?
http://www.iiea.com/event/archive_view?urlKey=energy-the-next-systemic-risk-to-banking
Other participants in this seminar were: Chris Skrebowski and Prof. Steve Keen (UWS)
Related post
20/4/2011
IMF warns of oil scarcity and a 60% oil price increase within a year
http://crudeoilpeak.info/imf-warns-of-oil-scarcity-and-a-60-oil-price-increase-within-a-year
Conclusion
Oil prices as predicted in the WEO 2011
 of between US$ 100 to US$ 120 seem to be too low according to the IMF modelling. Entering a period of permanently high oil prices requires an urgent change away from oil-dependent infrastructure as repeatedly proposed on this website.
I waz rong by $20
 4/4/2011
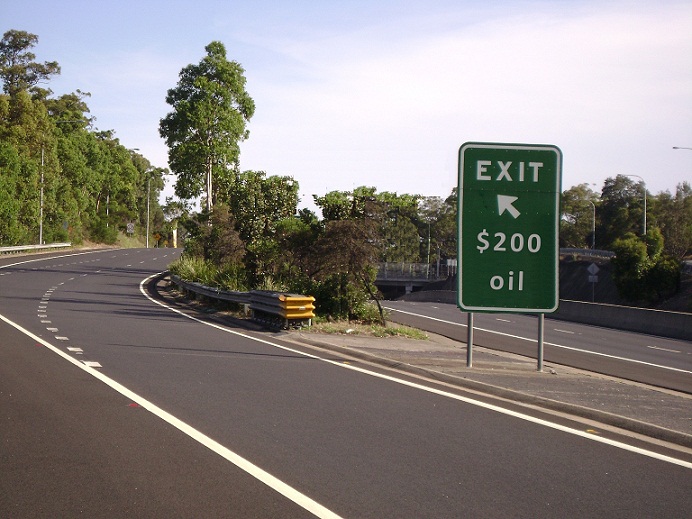
Sydney’s RTA builds M2 exit lanes for $200 oil
http://crudeoilpeak.info/sydney%e2%80%99s-rta-builds-m2-exit-lanes-for-200-oil