In year 9 of peak oil, Qantas’ profits have slipped into the negative. Fuel costs increased much faster than seat kilometres delivered by the airline.
Qantas to cut 1,000 jobs and report loss of up to $300m for 1st half of financial year
http://www.abc.net.au/news/2013-12-05/qantas-announces-1000-job-cuts-and-loss-of-up-300-million/5136364
Let’s have a look what might have caused these losses. All data in this articles are from Qantas annual reports
http://www.qantas.com.au/travel/airlines/investors-annual-reports/global/en
Skyrocketing fuel costs
Everyone knows it, but few are aware of the magnitude of the problem.
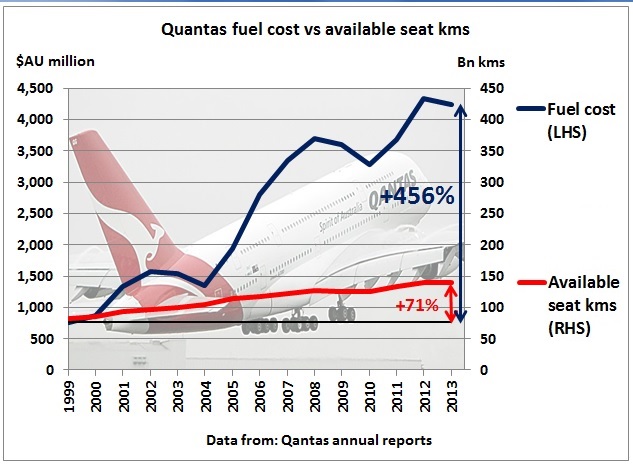
Since 1999 – the first year annual reports are currently available on the Qantas website – fuel costs have increased 5.6 times while available seat kms increased by “only” 1.7 times or 3.3 times more.
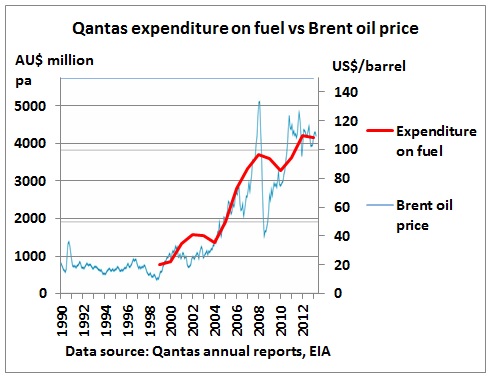
Fuel cost per available seat km – the main physical output of an airline – has increased roughly following the Brent oil price. Hedging has ironed out extreme volatility during 2008-2010. The scale on this graph has been selected in such a way, that the fuel cost curve (red) is in line with the average Brent price (blue) of around $110 in 2013.
Fuel hedging reserve
..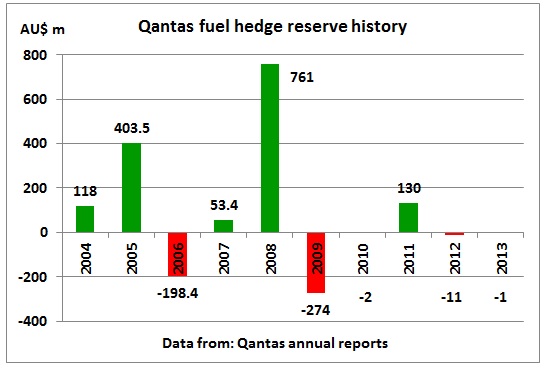
The fuel hedge reserve contains – at the end of each financial year – the cumulative net change (gains or losses) in the value of hedging instruments – crude, gas oil and jet kerosene derivative contracts (forwards, swaps or options). It is entered in the table of consolidated changes in equity. There is not enough information in the annual reports to know by how much gains and losses impacted on income and expenditure by transferring reserves. But in summary all gains made in particular years have been lost and the cumulative balance at end 2013 was minus AU$ 1 million.
Cost structure
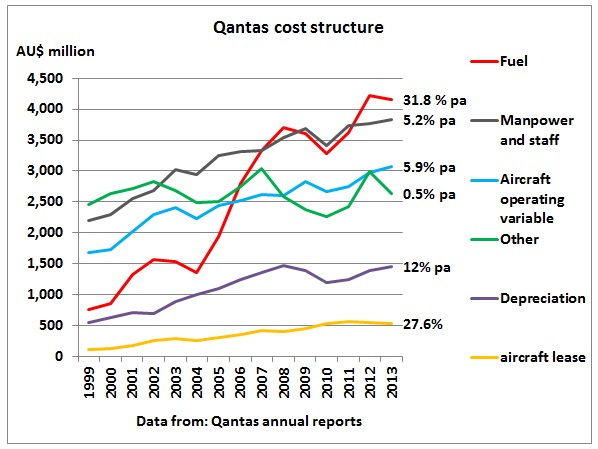
This graph shows the different cost components of expenditure and their average growth rates over a period of 14 years. Fuel increased by the highest rate followed by aircraft leasing and depreciation. Manpower increased by 5.2% pa.
Altogether now

Seat factor
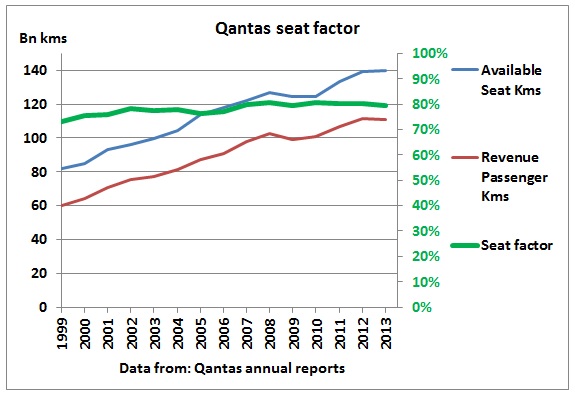
The seat factor increased from 73% in 1999 to 80% in 2007. Since then it remained basically unchanged.
Profits before tax
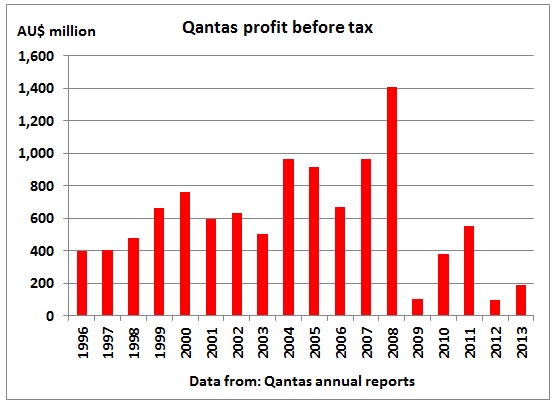
The last time good profits were made was in the financial year ending June 2008. Months later the global financial crisis was triggered by the convergence of an accumulated debt problem and limited oil supplies. The following articles are worth a read:
Peak oil and the financial crisis
March 2009, by Gail Tverberg
http://www.theoildrum.com/node/5230
Oil supply limits and the continuing financial crisis
January 2012, by Gail Tverberg
http://ourfiniteworld.com/oil-supply-limits-and-the-continuing-financial-crisis/
Causes and Consequences of the Oil Shock of 2007–08
http://muse.jhu.edu/journals/brookings_papers_on_economic_activity/v2009/2009.1.hamilton.html
..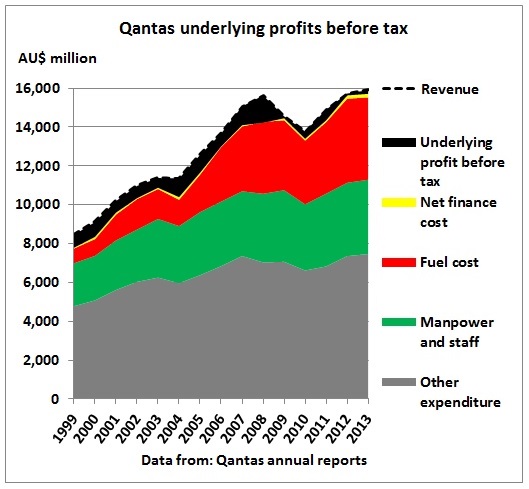
Profits have become wafer thin starting in 2009, squeezed between revenue limited by competition with other airlines and ever rising fuel cost which can no longer be successfully hedged against.
Fuel efficiency
Qantas’ target is to increase fuel efficiency by an average of 1.5% pa to 2020
http://www.qantas.com.au/travel/airlines/fuel/global/en
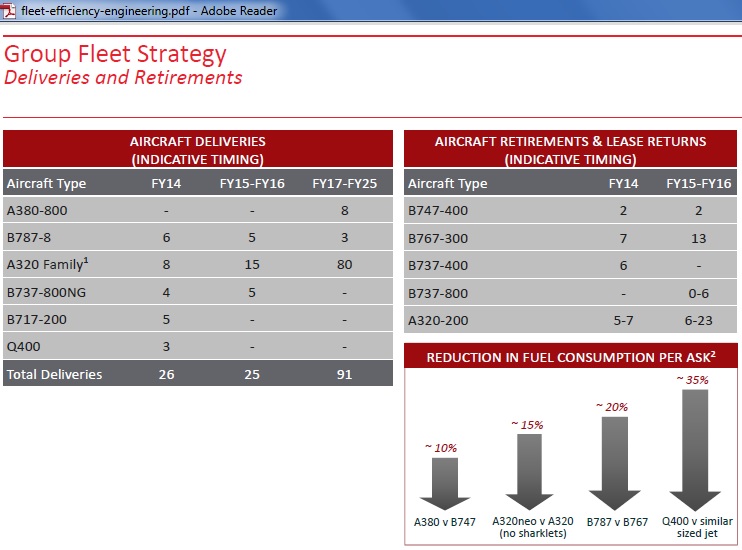
http://www.qantas.com.au/infodetail/about/investors/fleet-efficiency-engineering.pdf
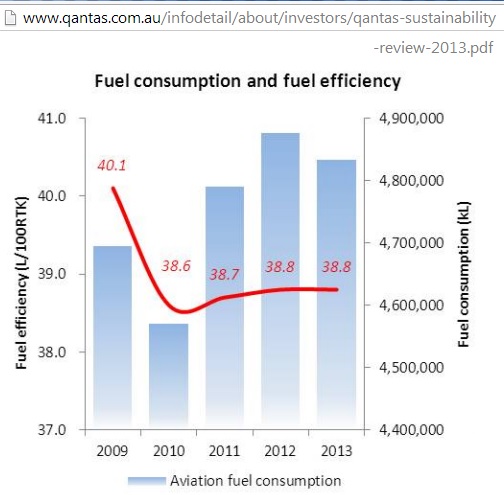
How hard that job is can be seen in a graph on page 39 in the 2013 sustainability report
http://www.qantas.com.au/infodetail/about/investors/qantas-sustainability-review-2013.pdf
Fuel efficiency is measured in litres fuel per 100 revenue tonne kilometres (RTK = number of tonnes of paying passengers, freight and mail carried multiplied by the number of kms flown). The graph shows that after an initial improvement in 2009/2010 fuel efficiency did not increase further. A substantial increase in the stagnating seat factor (see graph above) would be needed. Note that both axes are not zero scaled.
In order to get a better view of the long-term trend – ignoring weight and cargo (5 planes out of 312) – and looking at available seat kms only, the fuel efficiency improvement looks a bit better:
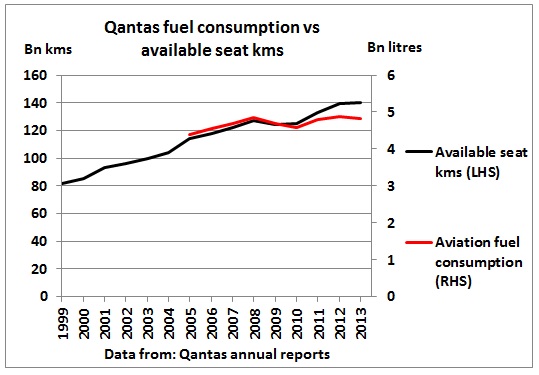
The graph shows that since 2010 fuel consumption grew less than available seat kms. Fuel consumption per 100 seat km decreased from 3.66 litres in 2010 to 3.46 litres in 2013. No matter how we look at the numbers it will be a tough task to reduce the total amount of fuel used.
Performance Domestic/International
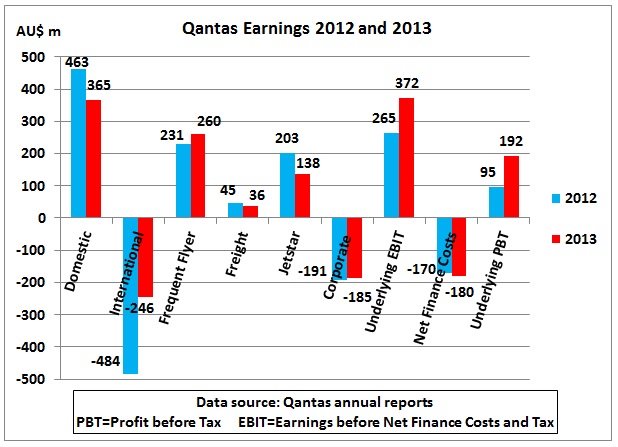
One of the main performance features is that the international segment is in the red while the domestic business offsets these losses.
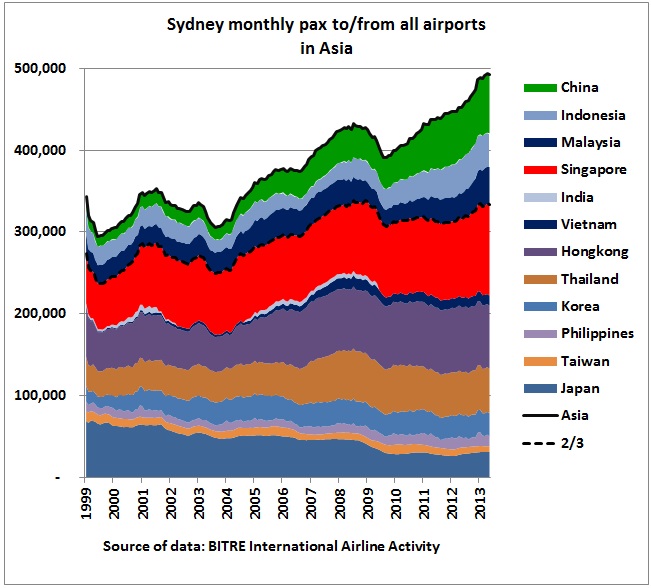
As an example how difficult the international market is even in Asia the following graph
http://crudeoilpeak.info/two-thirds-of-asian-flight-to-from-sydney-have-not-grown-since-2008-part-3
shows that 45% of air passenger traffic from/to Sydney has peaked in 2008 – being practically flat since then. Adding Singapore makes 2/3 of the air traffic and that is back to where it was in 2008. Growth comes only from 3 countries (China, Indonesia and Malaysia)
Conclusion
The future of Qantas will mainly depend on the cost of fuel, the AU$ exchange rate (a weaker AU$ will increase fuel cost, especially for domestic flights) and the economic development of the Asian markets in general which in turn depend increasingly on oil imports mainly from the Middle East. There is also uncertainty about a 200% debt-to-GDP ratio in China. While there is no replacement for international flights, domestic traffic could in principle be taken up by electric rail (e.g. night trains between capitals) but at the moment we do not have governments in place with the foresight to plan for a future with reduced air traffic. The dilemma here is that the domestic segment happens to be the most profitable. It is notable that the Federal Infrastructure Minister – while the Qantas profit warning news came out – announced that a decision will soon be made on the location of a 2nd Sydney airport.
Addendum
Carbon tax and fuel cost
26/2/2014
In the Australian Parliament, 25/2/2014
Mr ABBOTT (Warringah—Prime Minister) (14:01): Thank you. I appreciate the question from the Leader of the Opposition, because obviously Qantas is an iconic Australian business and all of us want to ensure that Qantas flourishes forever. It is a great Australian airline. It is a great Australian icon. We want it to flourish. For that to happen, two things are necessary: first, it needs to be able to compete on a level playing field with its rivals; and,
second, it needs to put its own house in order.
Qantas is doing its best to put its own house in order, and this government will do what it can to ensure that Qantas has a level playing field on which to compete, because that is the best thing that we can do for Qantas. I have to say to members opposite that, if they are fair dinkum about wanting Qantas to flourish, one thing they can do is scrap the carbon tax.
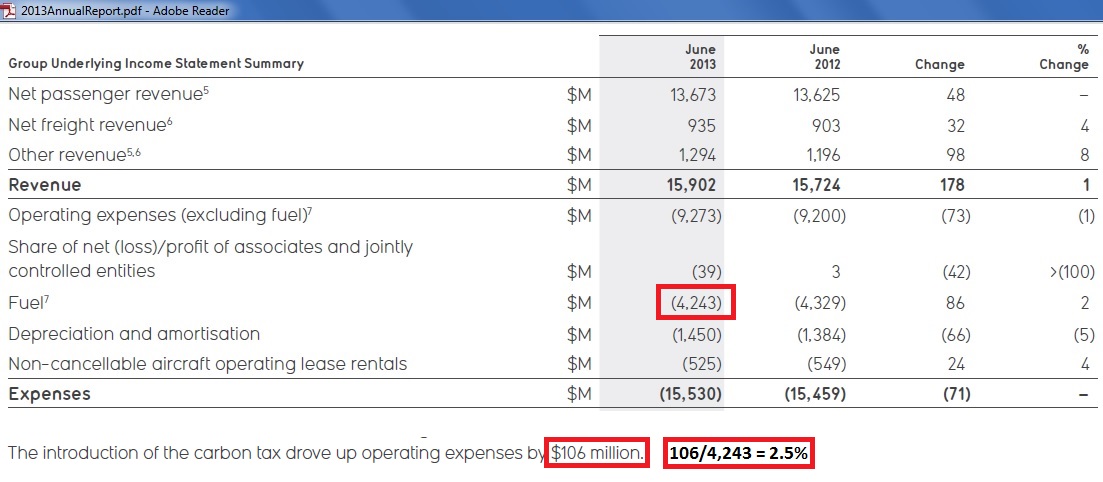
Mr Hockey [Treasurer]: $106 million a year!
http://parlinfo.aph.gov.au/parlInfo/search/display/display.w3p;query=Id%3A%22chamber%2Fhansardr%2F8ab90ee4-4daf-4562-81de-62f4ff657b8d%2F0000%22
 http://www.qantas.com.au/travel/airlines/investors-annual-reports/global/en
Using data from the Qantas annual report 2013, we can see that the carbon tax is only 2.5% of total fuel cost. This means that peak oil has hit Qantas much more than the carbon tax