The China National Offshore Oil Corporation (CNOOC) is the largest producer of offshore oil and gas in China. Production statistics should therefore be pretty much indicative of what is happening along China’s coastline. Data from annual reports show that net oil and gas liquids production in 4 key offshore areas increased rapidly in the first decade of this century but then remained fairly flat after 2010. Gas production peaked in 2011 and was 7% lower in 2014.
At the recent 14th Asia Security Summit in Singapore – organised by the Centre for International and Strategic Studies (CSIS, Washington) – media focus was on several artificial islands China is building on half sunken reefs in the South China Sea.
Dredging….
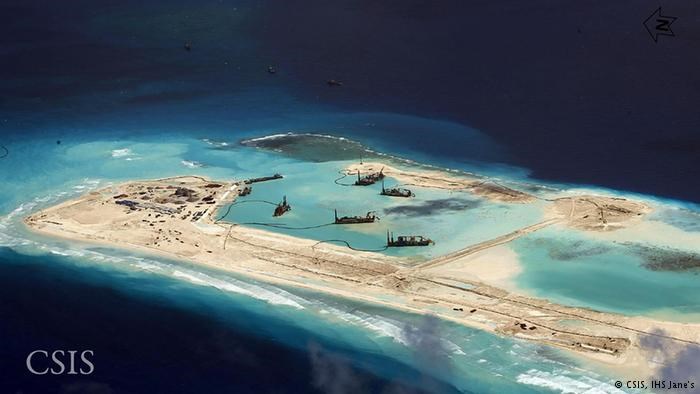
Fig 1: Fiery Cross Reef reclamation started in Aug 2014
http://amti.csis.org/fiery-cross-reef-tracker/
South China Sea dispute: US defence secretary demands Beijing immediately halt island-building
28/5/2015
The United States has demanded Beijing immediately halt its island-building activity near the South China Sea, echoing recent concerns expressed by Australia’s Defence Department boss.
“We want a peaceful resolution of all disputes and an immediate and lasting halt to land reclamation by any claimant,” he said.
“We also oppose any further militarisation of disputed features.”
The growing tensions to Australia’s north are also causing alarm in diplomatic and military circles in Canberra.
But little attention was given to the real battle along China’s coast and the statistics behind it.
….and Drilling 3,600 km further North
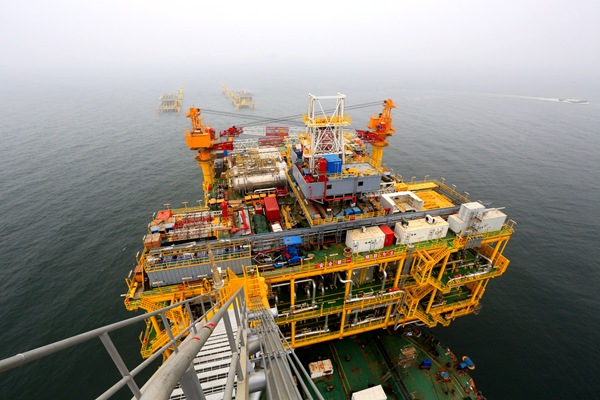
Pic 2: Installation of platform at Qinhuangdao 32-6 in Bohai Bay (QHD phase 2) June 2014
http://www.cnoocengineering.com/en/single_news_content.aspx?news_id=12590
Let’s have a look at the areas.
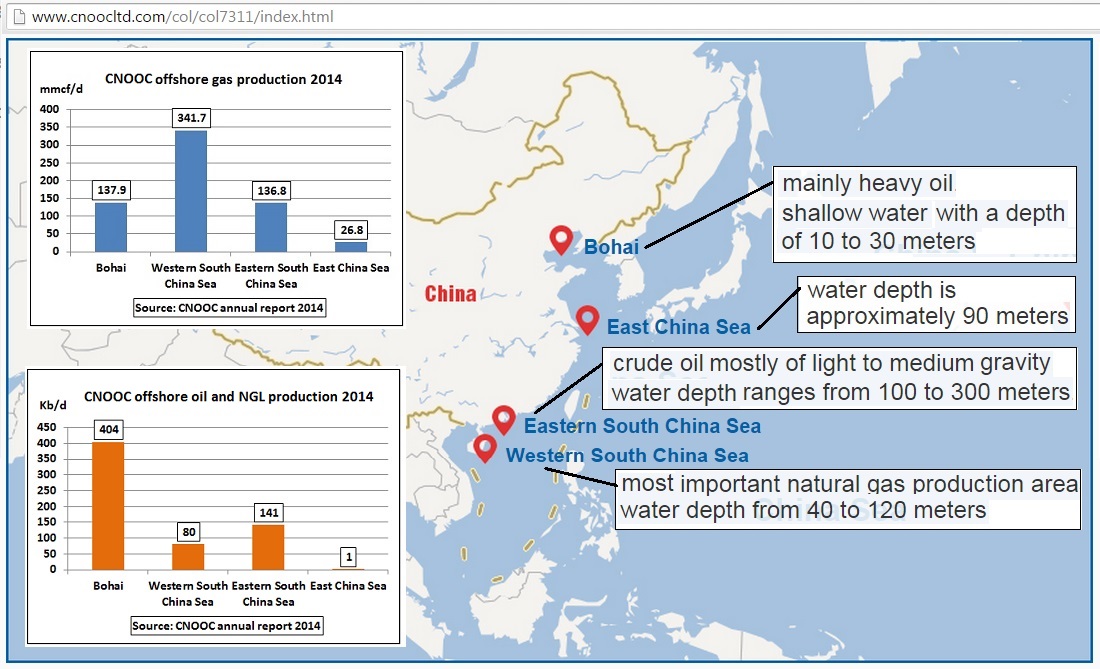
Fig 3: CNOOC’s key offshore oil and gas production areas
http://www.cnoocltd.com/col/col7311/index.html
These are not the contested areas in the South China Sea
Let’s have a look at production statistics.
Crude oil and NGL production
..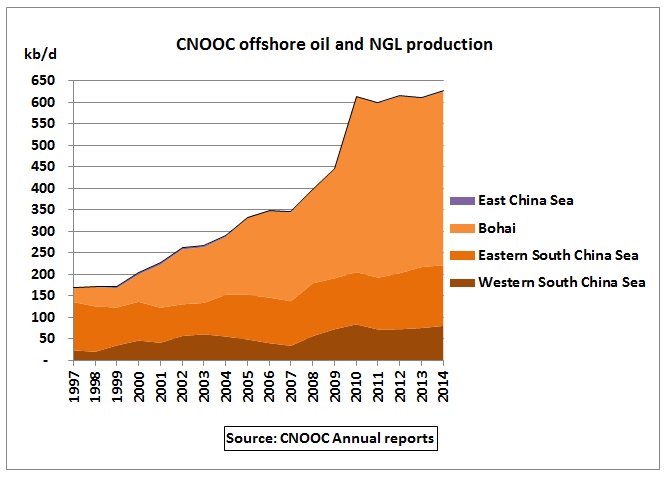
Fig 4: CNOOC’s offshore oil and NGL production
Oops! Stuck between 600 kb/d and 650 kb/d since 2010. In May 2011 the China Daily proudly reported that the Peng Lai oil field (Bohai Bay) will reach its peak production of 150 kb/d in 2011:
“Penglai 19-3 is a milestone project for us. Billions of dollars have been invested in developing the mega oilfield,” Georg Storaker, president of ConocoPhillips China, told China Daily.
He added that it might take more than 30 years to deplete the field.
http://www.chinadaily.com.cn/bizchina/2011-05/20/content_12548640.htm
The Peng Lai 19-3 (Bohai Bay) oil spill
But the oil miles did not go far. They pushed the field too hard. Soon after the above press release there were 2 separate oil spills in this field which required to halt production at 181 producing and 54 injecting wells. As a result, oil production dropped in 2011.
1st oil spill On June 4, 2011 the Penglai 19-3 oilfield caused an oil spill from a sea floor leak that lasted until June 7
2nd oil spill On June 17 a second oil spill that occurred at the Penglai 19-3 oilfield, but was contained within 48 hours
http://en.wikipedia.org/wiki/2011_Bohai_Bay_oil_spill
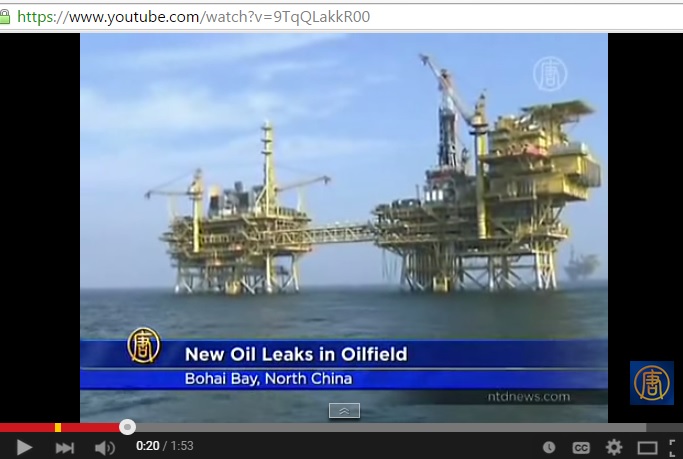
Fig 5: Video on the Peng Lai 19-3 oil spill
https://www.youtube.com/watch?v=9TqQLakkR00
The Bohai Bay is at the geographic centre of 3 provinces (Liaoning, Hebei with capital Beijing, Shandong) with a population of 210 million, producing 23% of the country’s GDP
The spill, affecting an area of 6,200 km2, received a lot of attention due to its proximity to Beijing and because of many other previous oil leaks and pollution problems in a heavily industrialised area of China. The shallow, semi-enclosed Bohai Bay receives a lot of sediments and affluent from many rivers. There are no ocean currents and the exchange of water with the Yellows Sea/Pacific Ocean is mainly driven by winds and tides. The bathymetry and an animation of tidal flows can be found here.
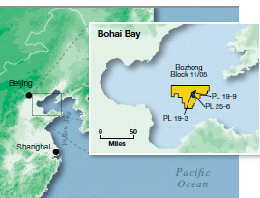
Fig 6: Location of block 11/05 with Peng Lai oil field
http://www.china.org.cn/environment/2011-08/02/content_23123674.htm
Bohai Bay is an area where 20% is already polluted from industrial development
One-fifth of Bohai Sea polluted
http://www.china.org.cn/environment/2011-09/08/content_23381596.htm
The following graph is from a report titled “Characteristics of the Bohai Sea oil spill and its impact on the Bohai Sea ecosystem”
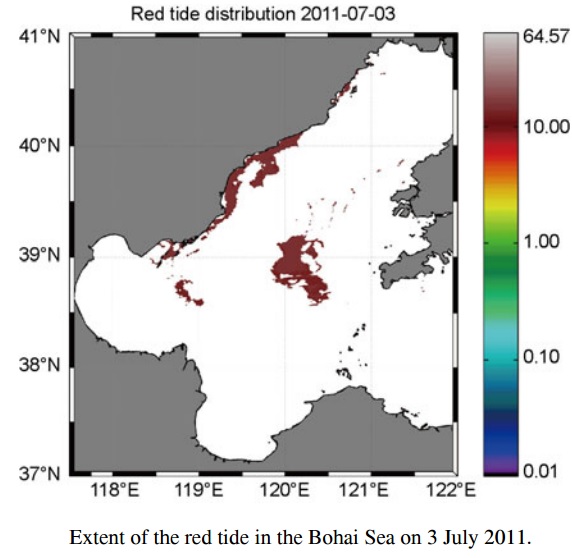
Fig 7: Red tide in Bohai Bay in July 2011
From: Chinese Science Bulletin, July 2013, Vol 58, No 19, p 2276-2281
http://modis.gsfc.nasa.gov/sci_team/pubs/abstract_new.php?id=08691
Fig 8: Red mud washed ashore
http://www.china.org.cn/environment/2011-08/19/content_23246367.htm
The following diagrams are from Conoco’s website “What happened”
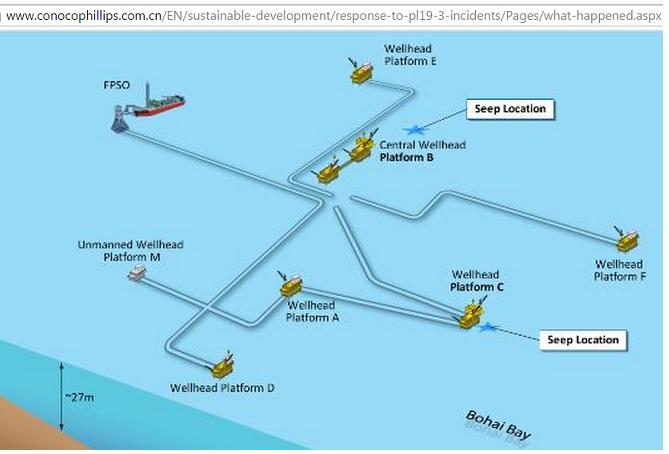
Fig 9: Location of seepages in 2011 in the Penglai 19-3 oil field
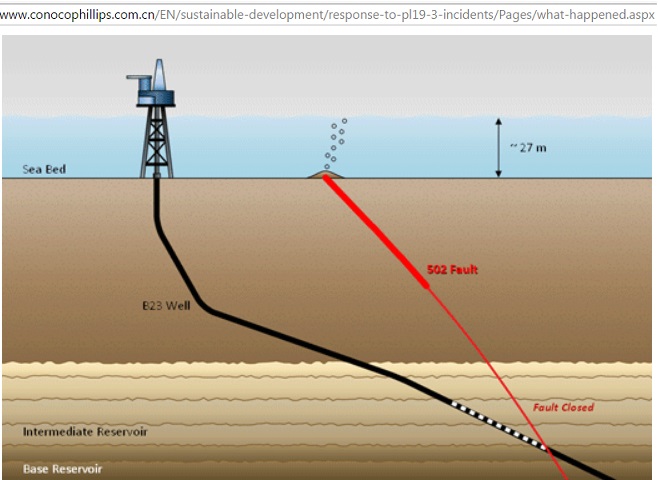
Fig 10: Seepage along a fault line in the rock
“After several days of investigation, the source of the seep was identified to be an existing geological fault that opened slightly due to pressure from water injection into a subsurface reservoir during production activities. COPC discontinued the water injection and began de pressuring the reservoir”
That water injection is of course necessary to maintain reservoir pressure and therefore production levels.
In 2012 there was another leak. In February 2013, “normal operation” continued.
However, that operation was not at the level of 69 kb/d as planned (see Conoco’s Annual Report 2009, Form 10-F, p 11)
Conoco Phillips production profile
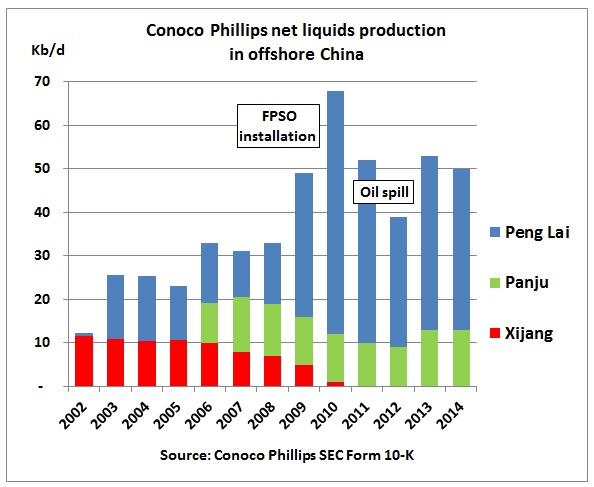
Fig 11: Conoco’s share of liquids production
Source: http://www.conocophillips.com/investor-relations/company-reports/Pages/sec-filings.aspx
The Peng Lai field started production in December 2002 (phase 1). Phase 2 included multiple wellhead platforms, central processing facilities and a floating storage and offloading facility.
CNOOC offshore vs onshore
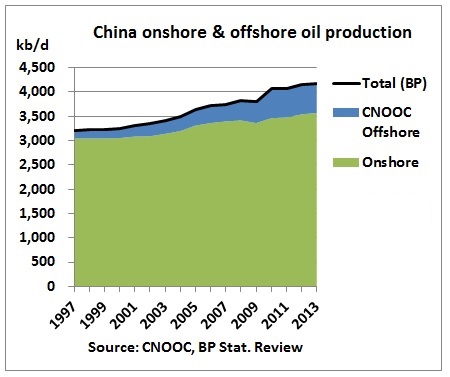
Fig 12: CNOOC’s offshore oil compared to total production
We see that much of the total step increase in 2010 resulted from China’s offshore fields.
CNOOC gas production
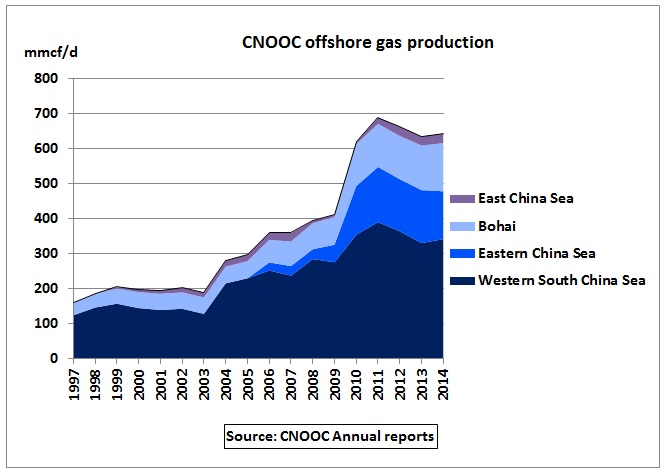
Fig 13: CNOOC offshore gas production
CNOOC offshore gas production has also peaked.
International ventures
Due to the stagnating domestic situation CNOOC has expanded into overseas exploration and production
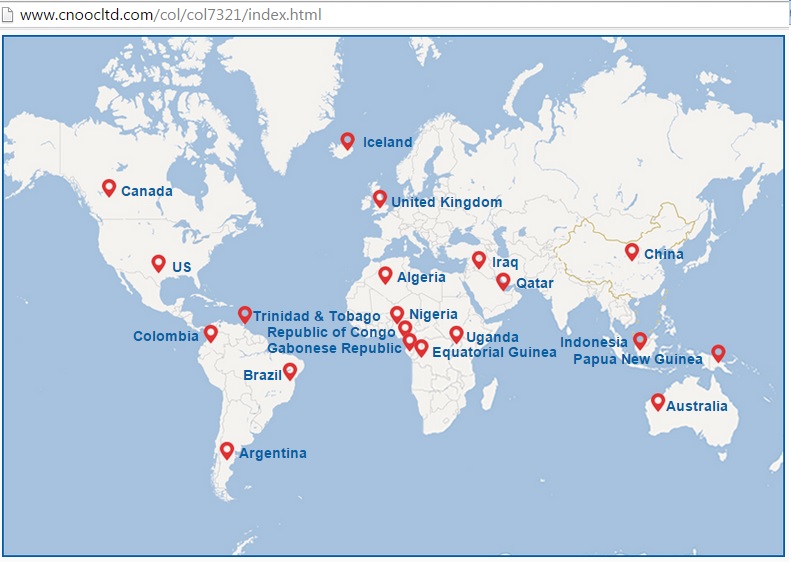
Fig 14: CNOOC’s overseas investments
http://www.cnoocltd.com/col/col7321/index.html
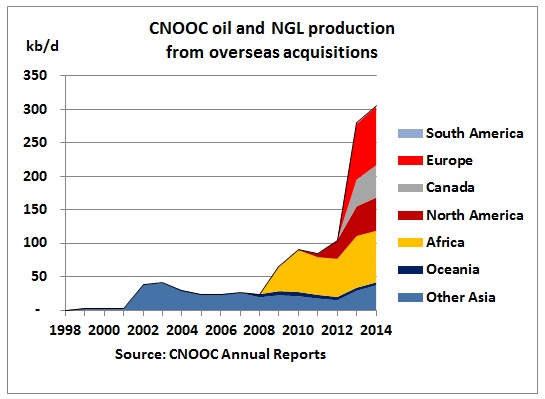
Fig 15: CNOOC overseas production
Now putting it all together:
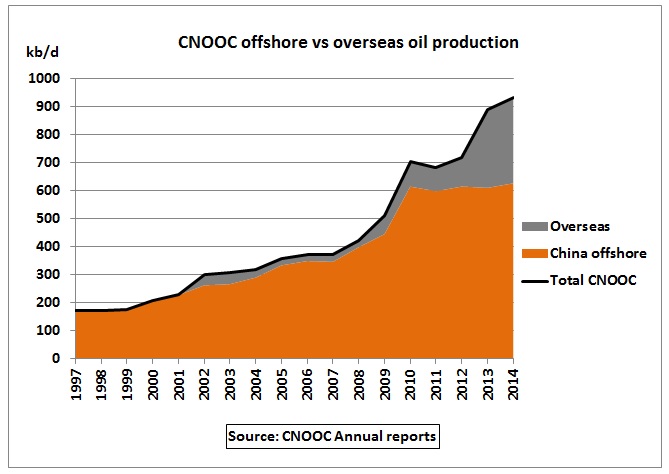
Fig 16: CNOOC offshore vs overseas oil production
Production growth in the last years was entirely driven by overseas acquisitions.
CNOOC Oil Reserves
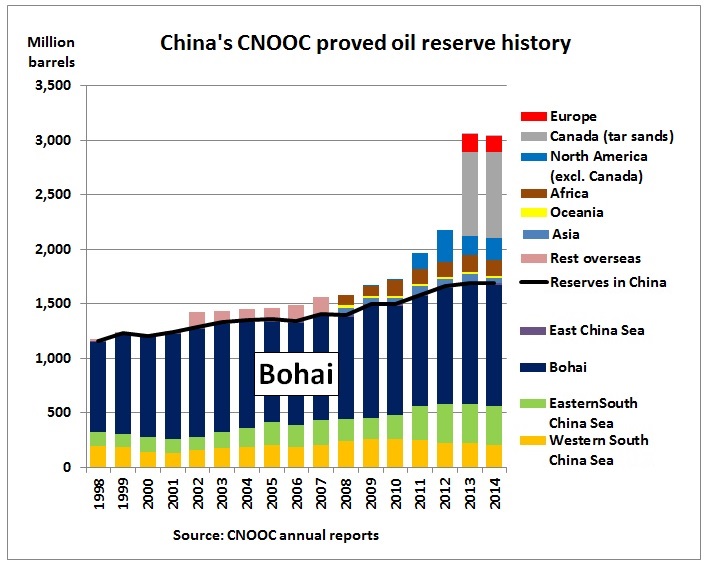
Fig 17: CNOOC oil reserve history
Overseas reserve growth is similar to production growth. 45% of offshore reserves are developed, the rest undeveloped.
CNOOC’s annual report 2014 says that the “Company has essentially completed the allocation of its global portfolio” (p 13)
Note that the Canadian tar sand reserves of 750 mb produce only 16 mb pa or 44 kb/d (see CNOOC Annual Report 2014, p 129). The reserve/production ratio for Chinese operations is just 7 years (1692 mb / 229 mb)
Summary:
CNOOC had problems to grow oil and gas production in the Bohai Bay since 2011 due to geological and environmental limitations in the Bohai Bay, its main producing area. This has resulted in the company expanding overseas.
Related post
12/5/2014
10 years after peak oil in Vietnam: Asian Century sails into troubled waters in the South China Sea
http://crudeoilpeak.info/10-years-after-peak-oil-in-vietnam-asian-century-sails-into-troubled-waters-in-the-south-china-sea