In the latest announcement of the Berejiklian government, 5 min before the 23rd March 2019 election, the New South Wales Premier confirmed the government will build the Metro West (already under consideration since November 2016) from the CBD to Parramatta for an additional population of 450,000 (the size of Leicester or Cardiff)!
3 Mar 2019
“[Transport Minister] Constance said the new line needed to be built in light of the projection that the existing T1 Western Line would be at capacity in the next 15 years, and 450,000 moving into the new rail corridor in the next 20 years.”
Sydney Metro West study area
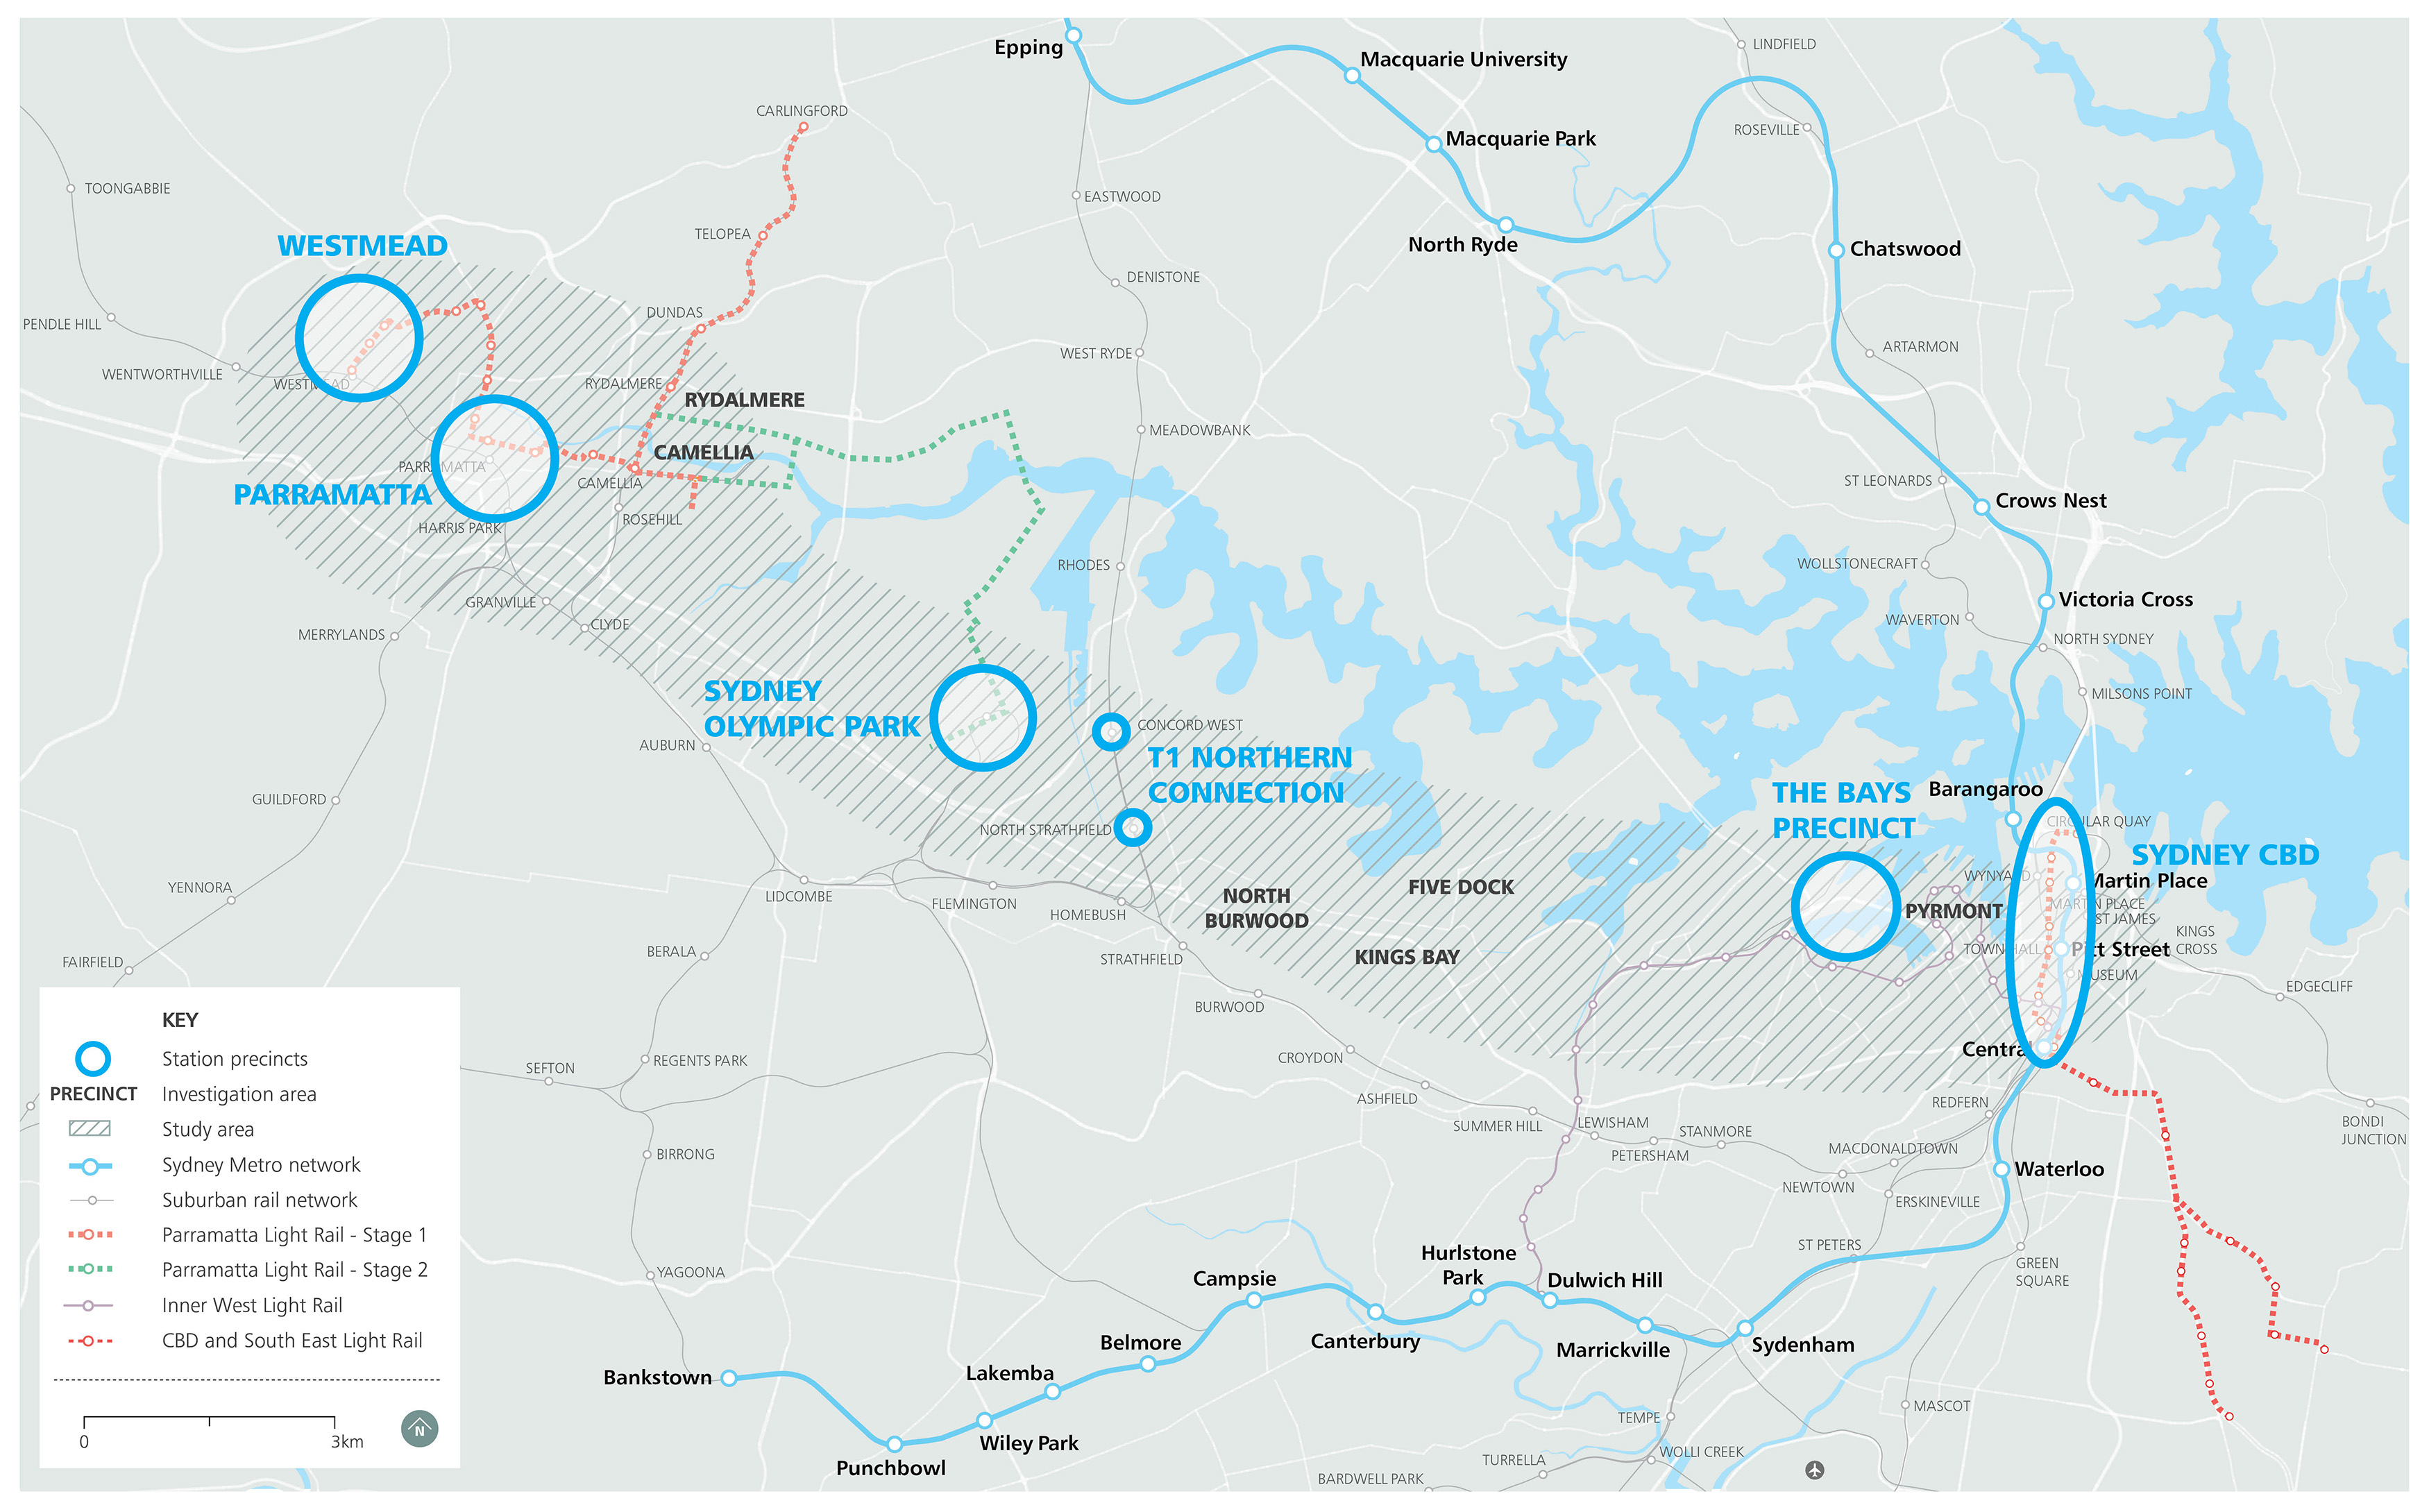 Fig 1: Alignment open – anything is possible
https://www.sydneymetro.info/west/project-overview
Where does all this future population come from? Sydney’s natural population growth is very modest (0.22% pa). This is because the population is aging.
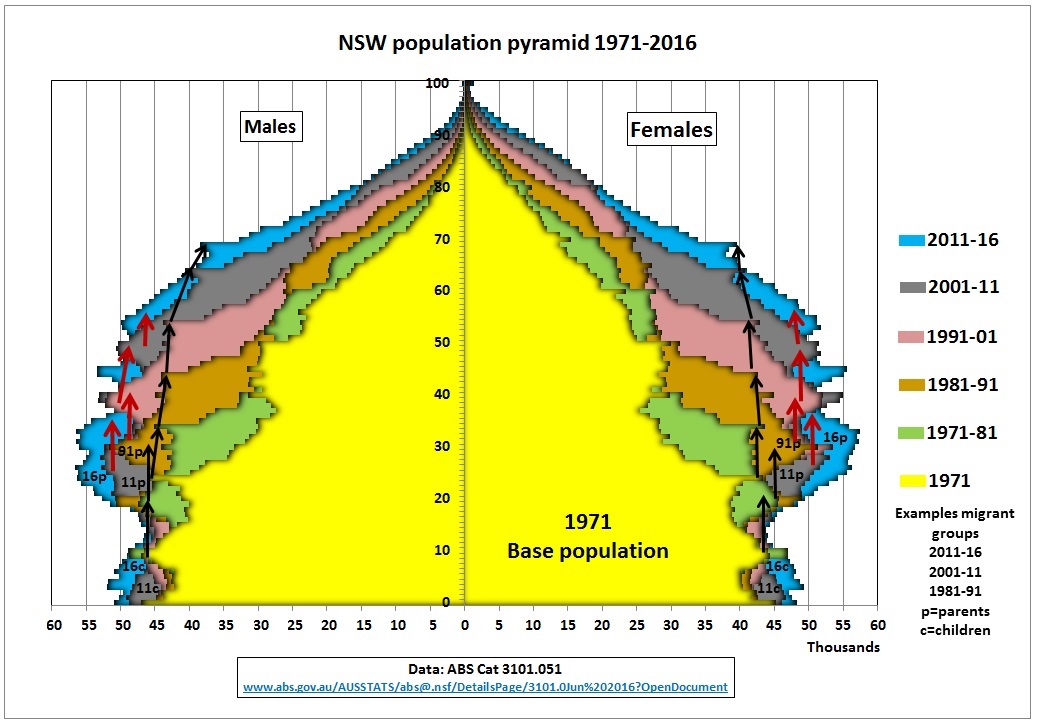 Fig 2: Top heavy population pyramid
It is top heavy because of previous immigration waves which were fed sideways into the population pyramid, leading to premature aging compared to natural growth which comes from the bottom.
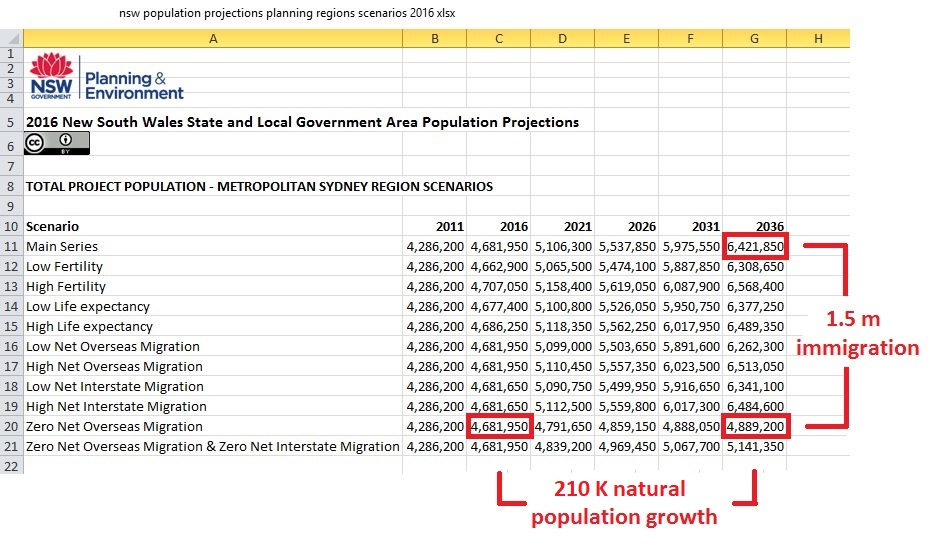 Fig 3: NSW government population targets (NOT projections) until 2036
Only 12% is natural population growth.
Let’s visualize what the Minister’s arbitrary population increase of 450 K means. It’s 22.5 K per annum or around 10 K dwelling units. Let’s assume a residential tower (34 storeys) has 400 dwelling units. So that would be 10,000/400 = 25 residential towers EVERY YEAR for 20 years. A typical tower of this size is the Opal tower in Homebush, famous for its cracks as a result of sloppy workmanship and hasty construction.
https://www.planning.nsw.gov.au/News/2019/Interim-Report-on-Opal-Tower-Released
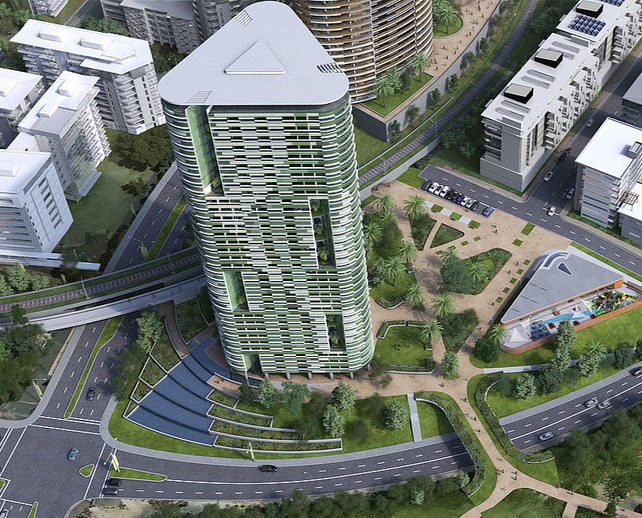 Fig 4: Opal tower in Homebush with appr. 400 dwelling units on 1.5 ha
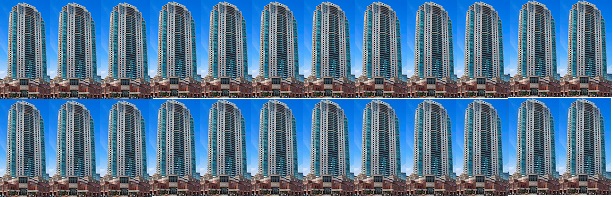 Fig 5: Here we have 24 Opal-type towers at 400 dwelling units each = 21,600 population
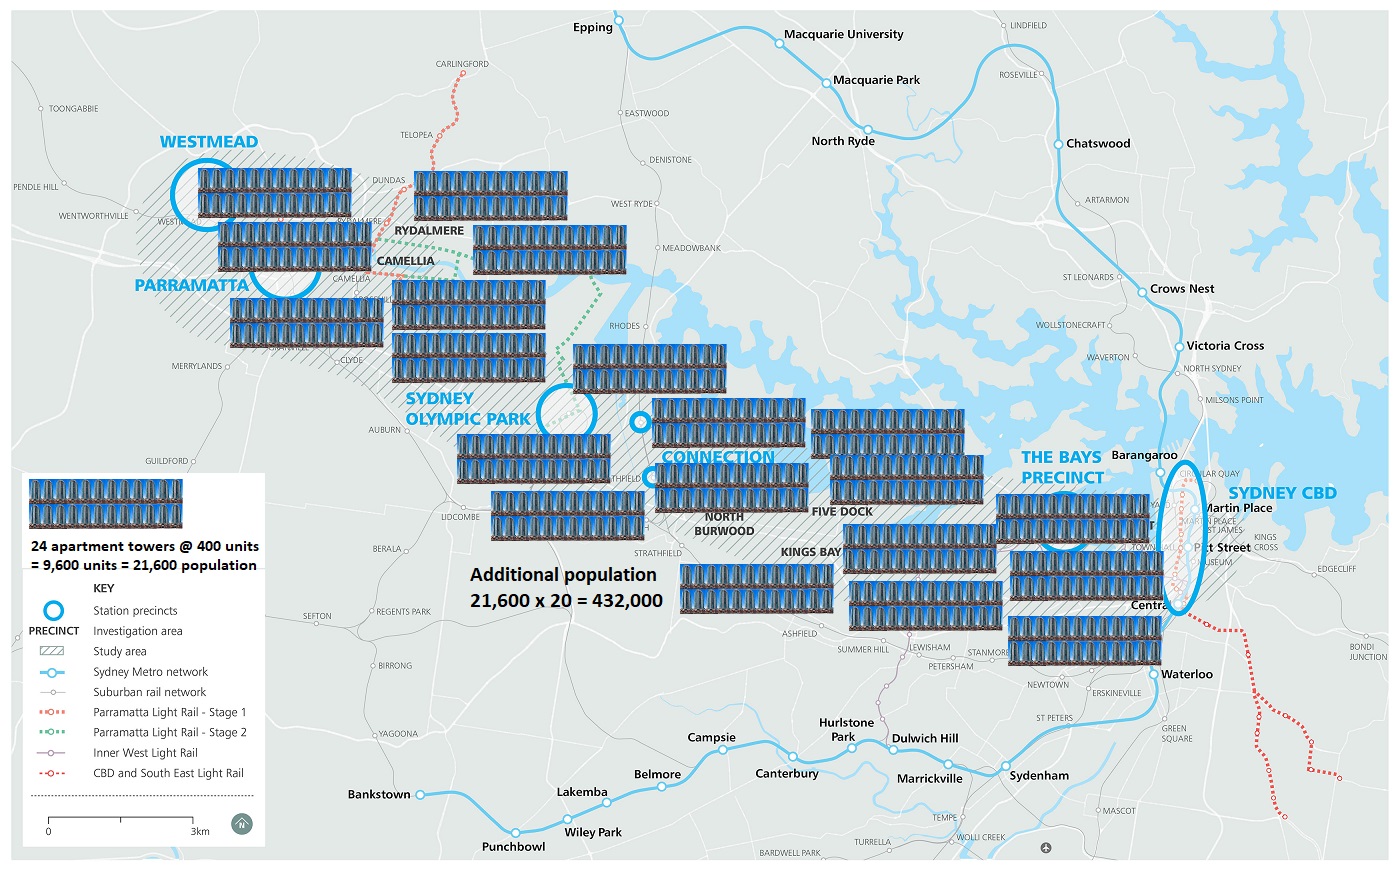
Fig 6: Let’s dump the towers into the study area of Fig 1
These towers are of course a hostile environment for children. This means that birth rates will be lower than would otherwise be the case. This calls for yet more immigrants. All residents wanting children will ultimately look for a house so these apartments are just transitory.
For Lucy Turnbull, head of the artificially created Greater Sydney Commission it’s music in her ears.
 Fig 7: Lucy Turnbull, wife of former Prime Minister Malcolm Turnbull
For residents it’s an absolute nightmare.
Welcome in crowded Sydney which is limited by 3 National Parks and the Pacific Ocean. So you will all be jammed into high rise residential towers mushrooming around most rail stations. As if there is not enough land elsewhere in Australia (along the coast, not in Broken Hill).
So why is the NSW government not decentralizing development? Because both politicians and bureaucrats are stuck in a Sydney centric Harbour View mentality. And because they want to play monopoly in a city they know and where they have personal contacts and future careers.
There is no proper town planning in Australia, only land sales and title swaps. The latest rage are demolitions of anything (business parks, industrial areas etc) and replacing them with residential towers.
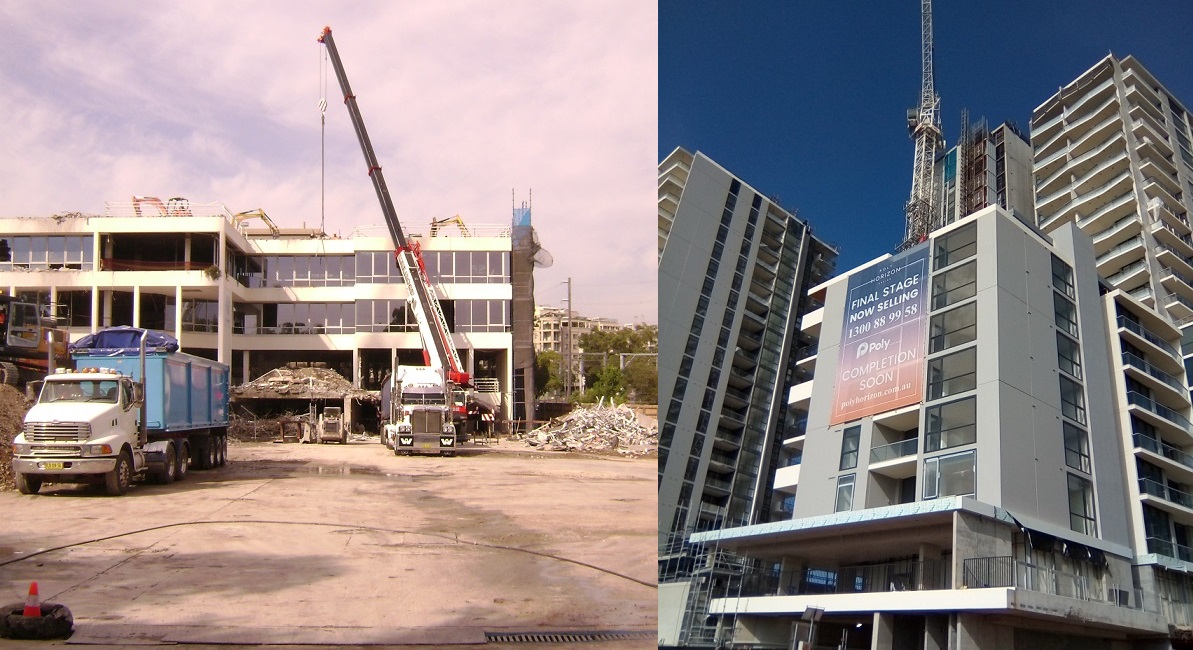 Fig 8: Destruction of a business park in Epping to make room for Polygroup’s residential towers
The CO2 from manufacturing cement, steel, bricks, aluminium and other building materials of these demolished structures is still in the atmosphere (30% after 100 years!)
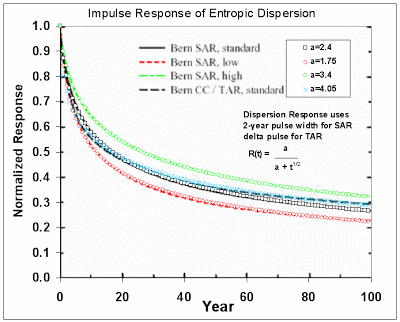 Fig 9: CO2 impulse response function
http://mobjectivist.blogspot.com/2010/04/fat-tail-in-co2-persistence.html
But environmental criteria are the last considerations in the mind of the government.
The exact route and the number and location of stations of the Metro West have not been decided upon. This shows how casual and sloppy the metro “planning” is. The previous government was not better. They announced and later cancelled several rail projects at will and short notice. The electorate got used to it. They view many announcements – especially shortly before elections – with cynicism. The media are now second guessing the route by monitoring geotechnical drilling sites.
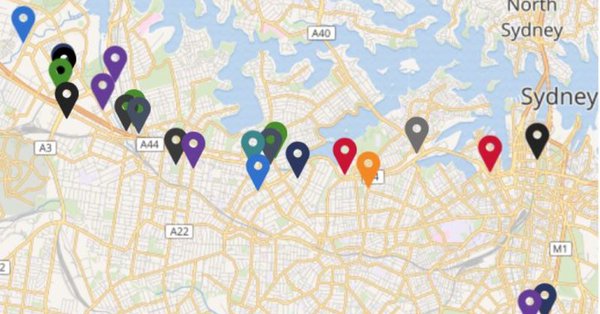 Fig 10: Residents in the affected areas will look at these sites with apprehension
https://www.smh.com.au/national/nsw/mapping-gives-clearest-hint-yet-of-sites-for-metro-west-stations-20190218-p50yji.html
Let’s go through some of the stations/areas in Fig 1.
CBD
For the North West Metro, there are 4 stations in the CBD: Barangaroo (will be flooded by sea level rises!), Martin Place, Pitt St. and Central
These stations are already under construction (between piled foundations of skyscrapers) but the exact location of a connection to Metro West is still under consideration. What kind of “planning” is this?
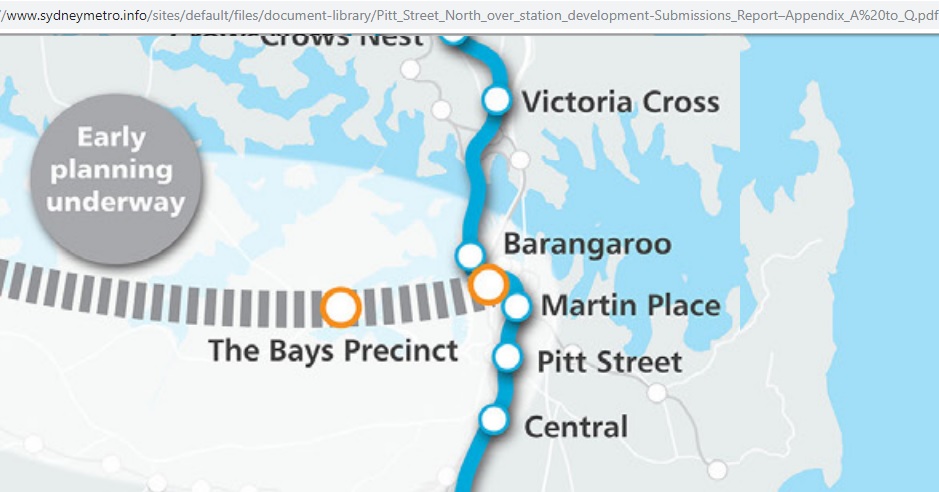 Fig 11: Connecting Metros in the CBD
http://www.majorprojects.planning.nsw.gov.au/index.pl?action=view_job&job_id=7400
That’s not easy as there are also the heavy rail tunnels to and from Wynyard (between Barangaroo and Martin Place)
28/2/2018
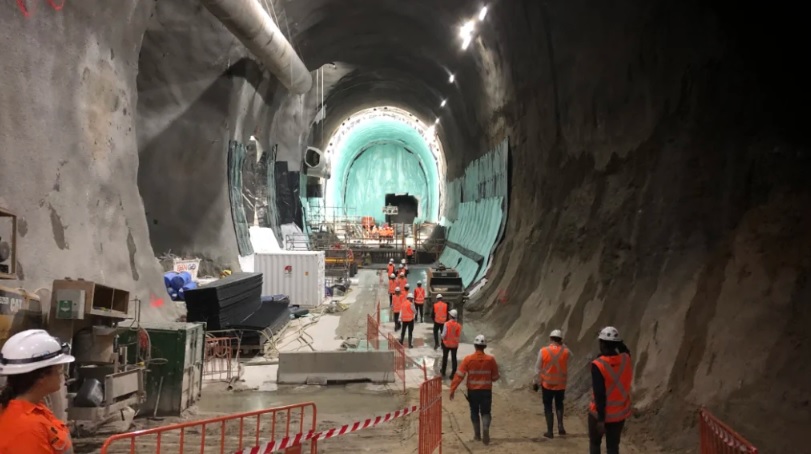 Fig 12: Underground cathedrals hidden beneath Sydney
https://www.smh.com.au/national/nsw/underground-cathedrals-hidden-beneath-sydney-to-form-new-metro-line-20190228-p510ru.html
To be continued. We go along the corridor and look where all these residential towers would go, provided there is no credit crunch, no power shortages and/or an oil crisis. The government is so energy illiterate.
.