On 5 August 2024 Australia’s east coast experienced power price spikes in all States, only 5 days after it already happened on 31 July. Prices climbed as high as $17,500/MWh in NSW.
It is clear that this is an indicator of tight power supplies, while the problem is covered up by a $300 credit on all electricity bills, starting from 1 July 2024.
Yet, power hungry projects like apartment towers continue to be approved.
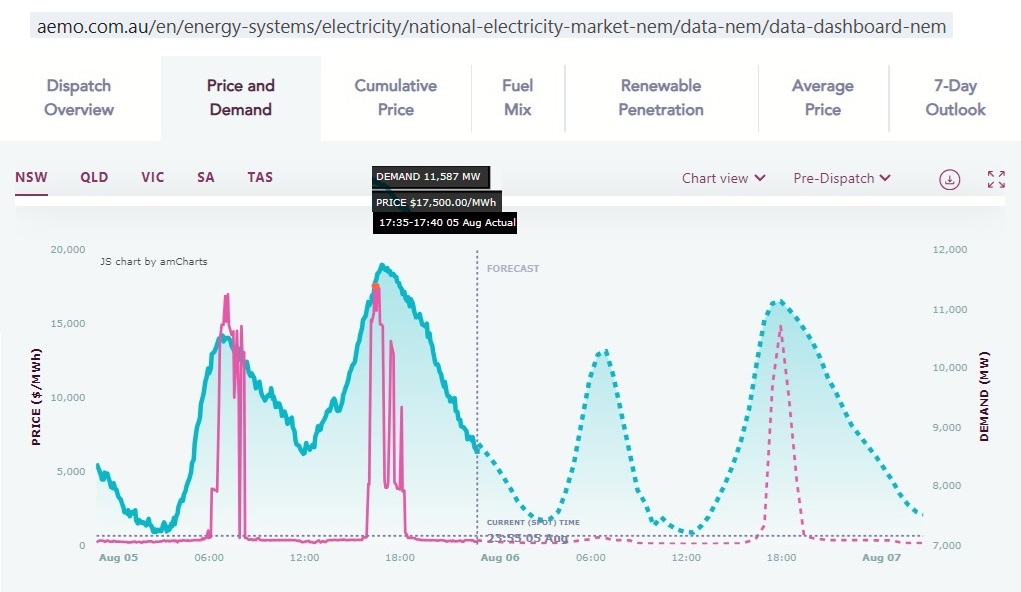 Fig 1: Two periods of power price spikes in the Premier State NSW on 5 Aug 2024
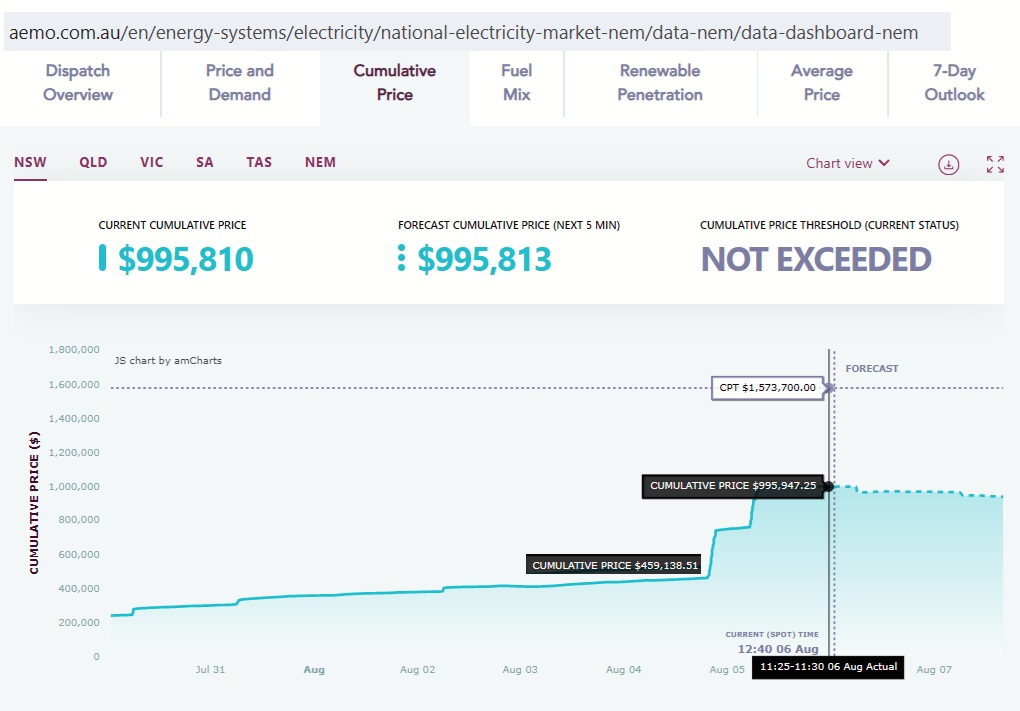 Fig 2: Cumulative prices in NSW doubled
The threshold is $1.57m at which point administered price capping is introduced
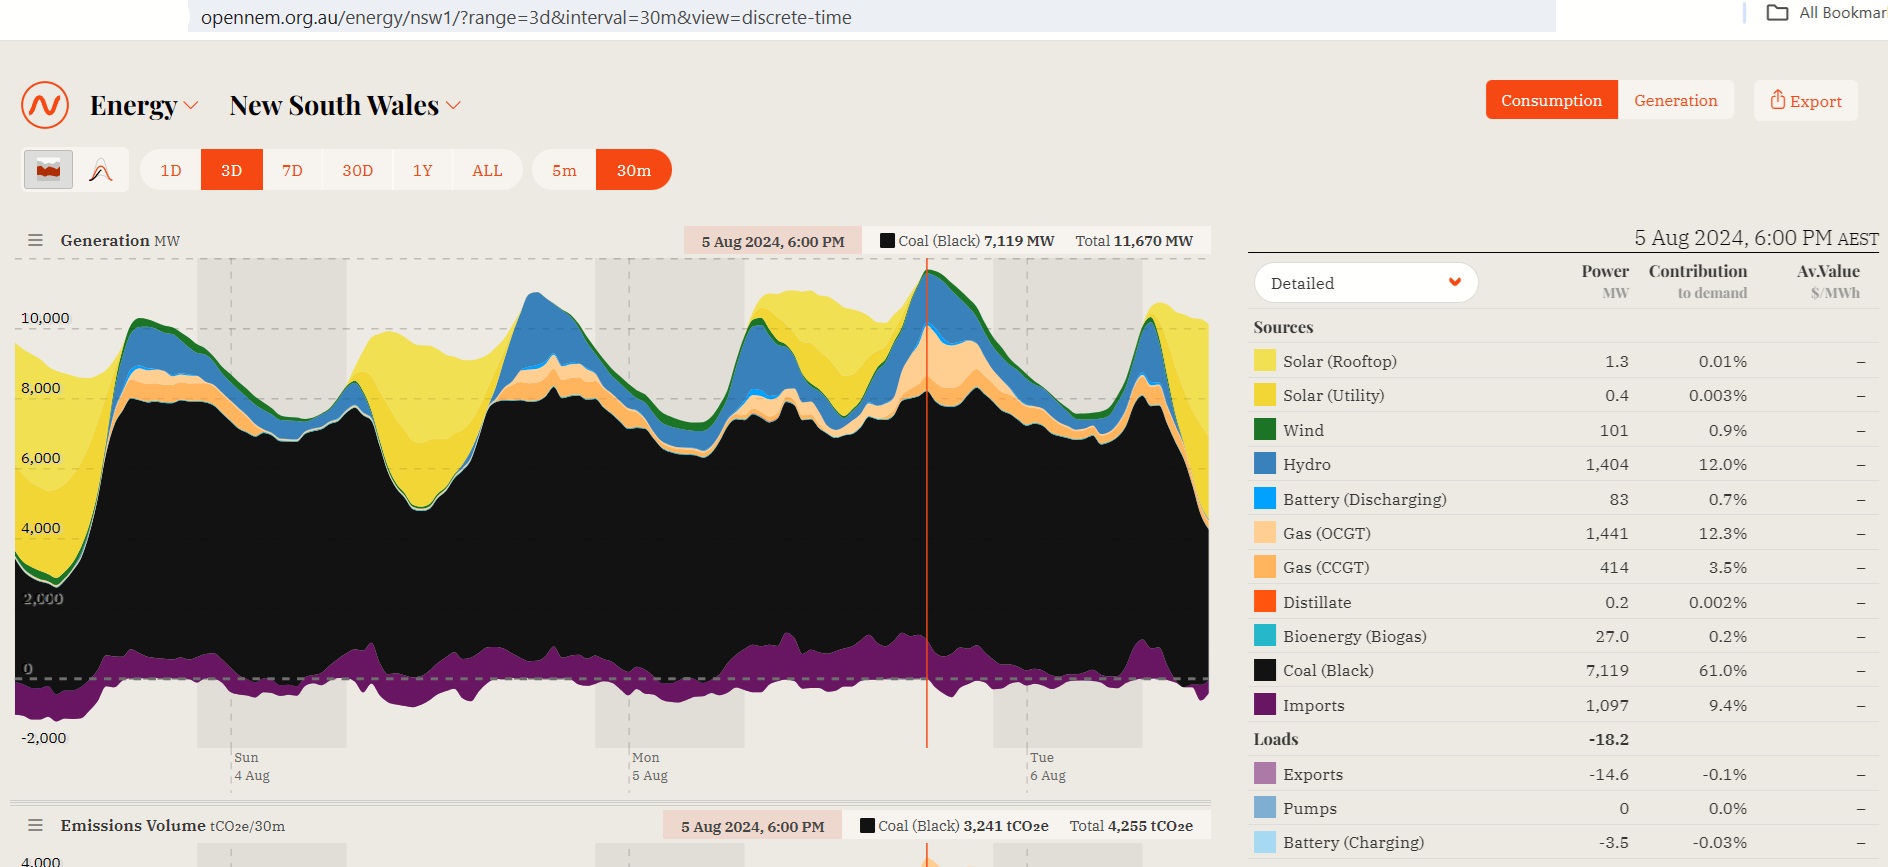 Fig 3: NSW power generation by fuel on 5 Aug
No wind. 2 cloudy days.
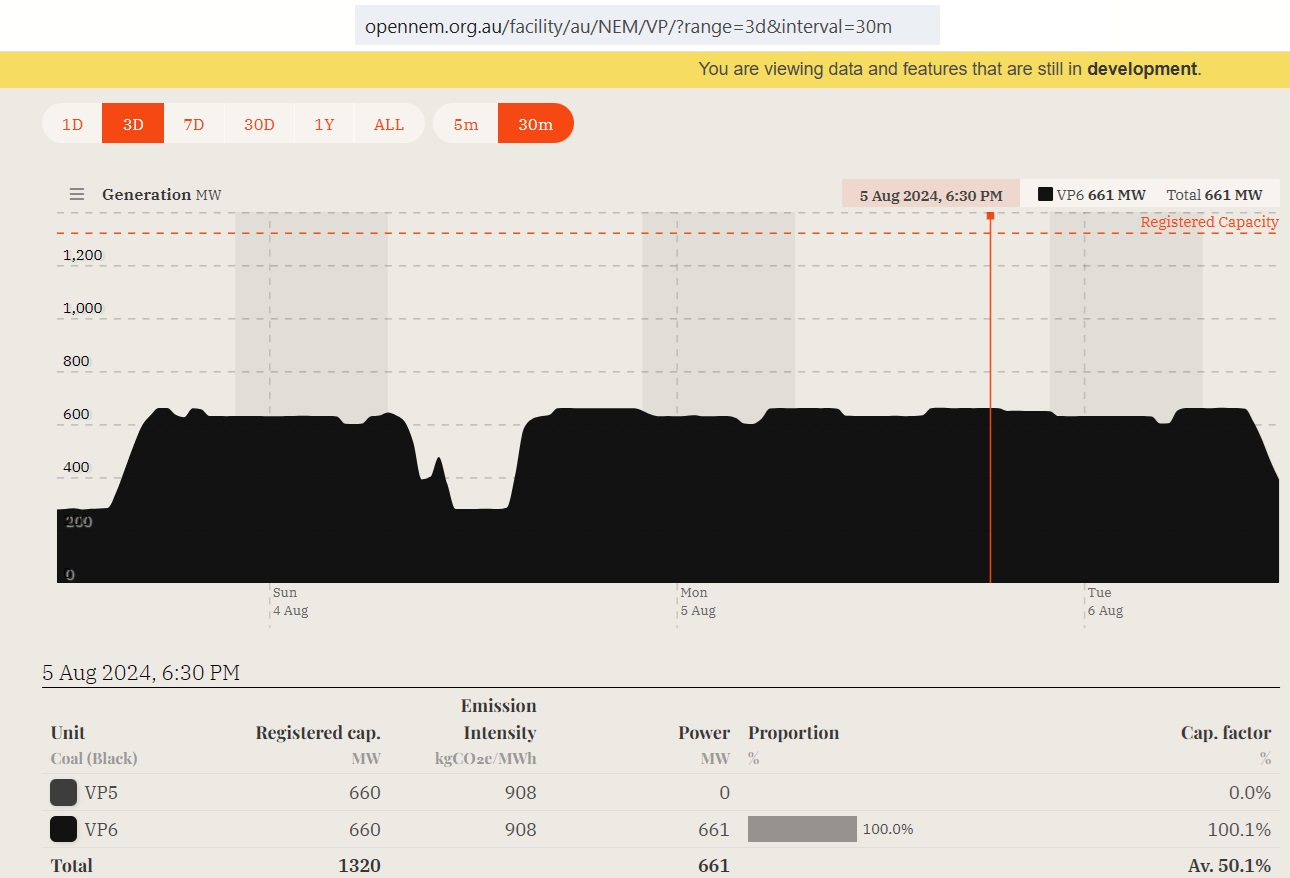 Fig 4: Vales Point unit VP5 offline
7/10/2022
Sale of Vales Point: How will Czech brown coal baron Pavel Tykac with
business registered in Liechtenstein impact on NSW coal and energy markets?
http://crudeoilpeak.info/sale-of-vales-point-how-will-czech-brown-coal-baron-pavel-tykac-with-business-registered-in-liechtenstein-impact-on-nsw-coal-and-energy-markets
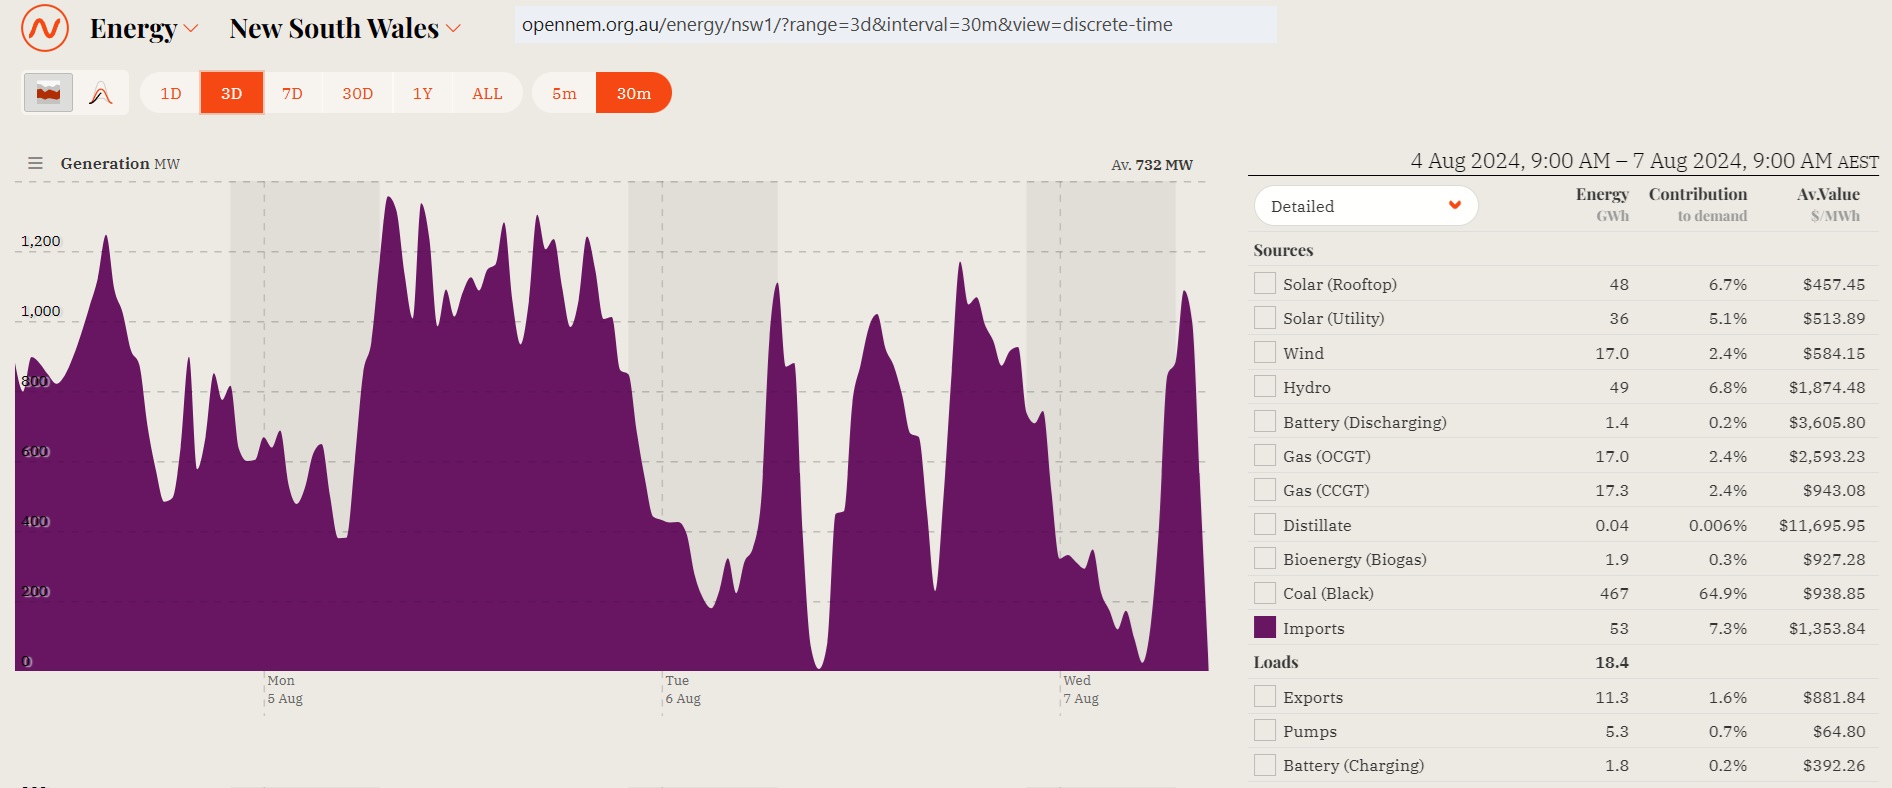 Fig 5: Continuous NSW power imports around 1,000 MW over 15 hrs on 5 Aug
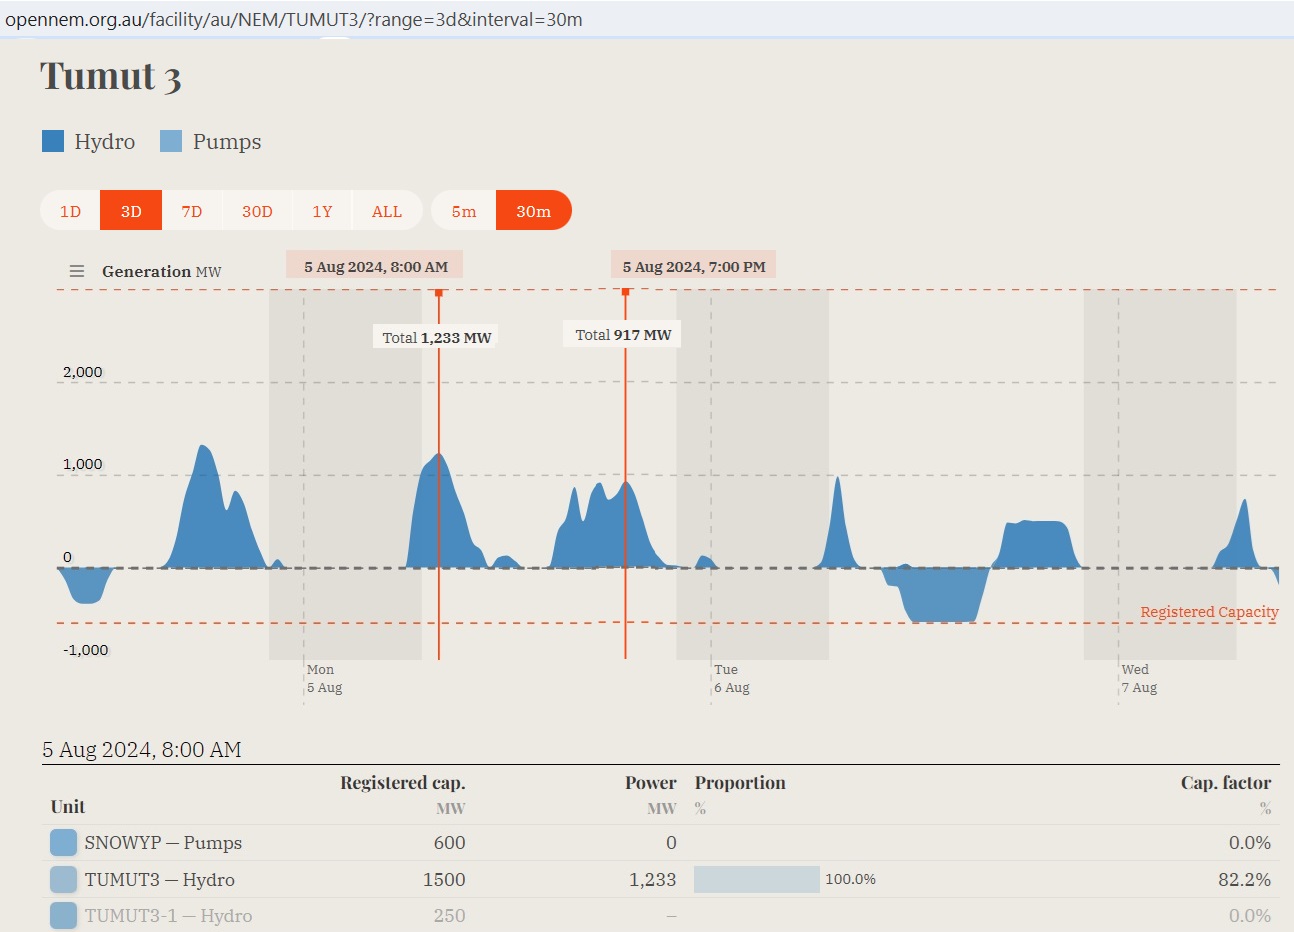 Fig 6: Tumut 3 pumped Hydro
We see that pumps are NOT operating as much as generators. This is a long term trend:
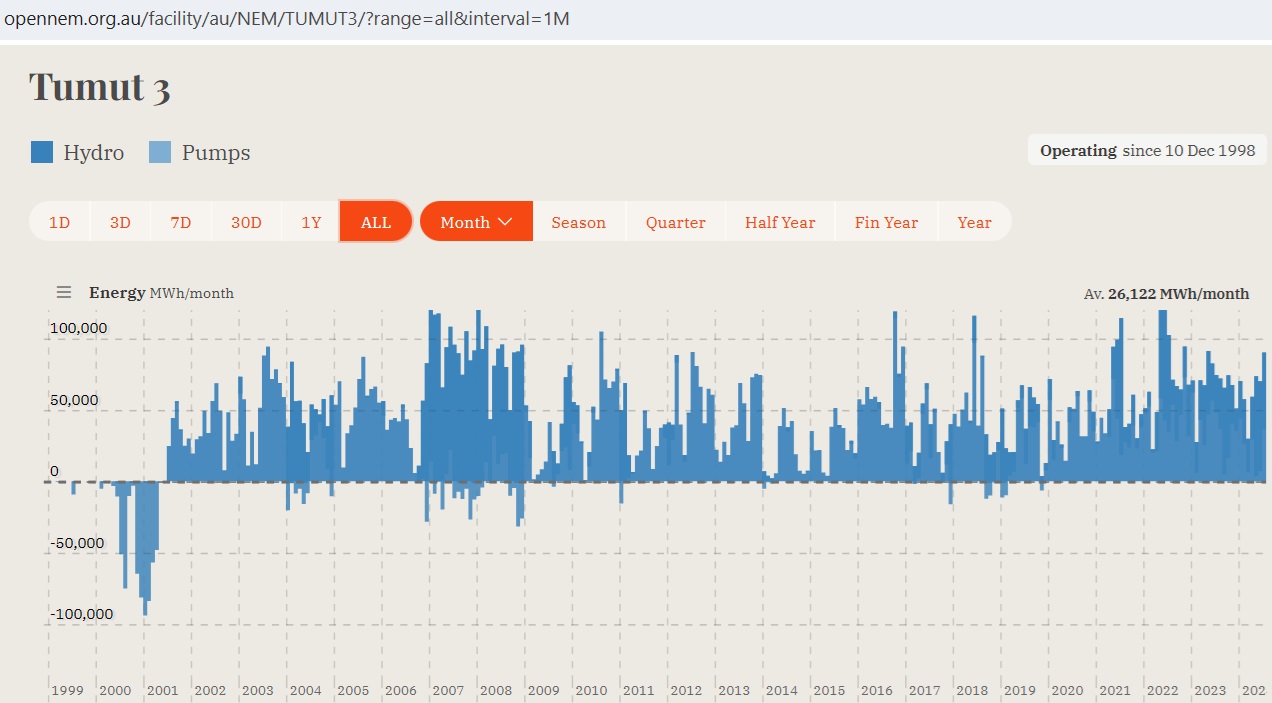 Fig 7: Tumut 3 is not really a pumped hydro over the long term
Output depends on rainfall and is therefore limited. Snowy2 will be better. Due to the delays in construction, it will be an exciting race with aging coal plants.
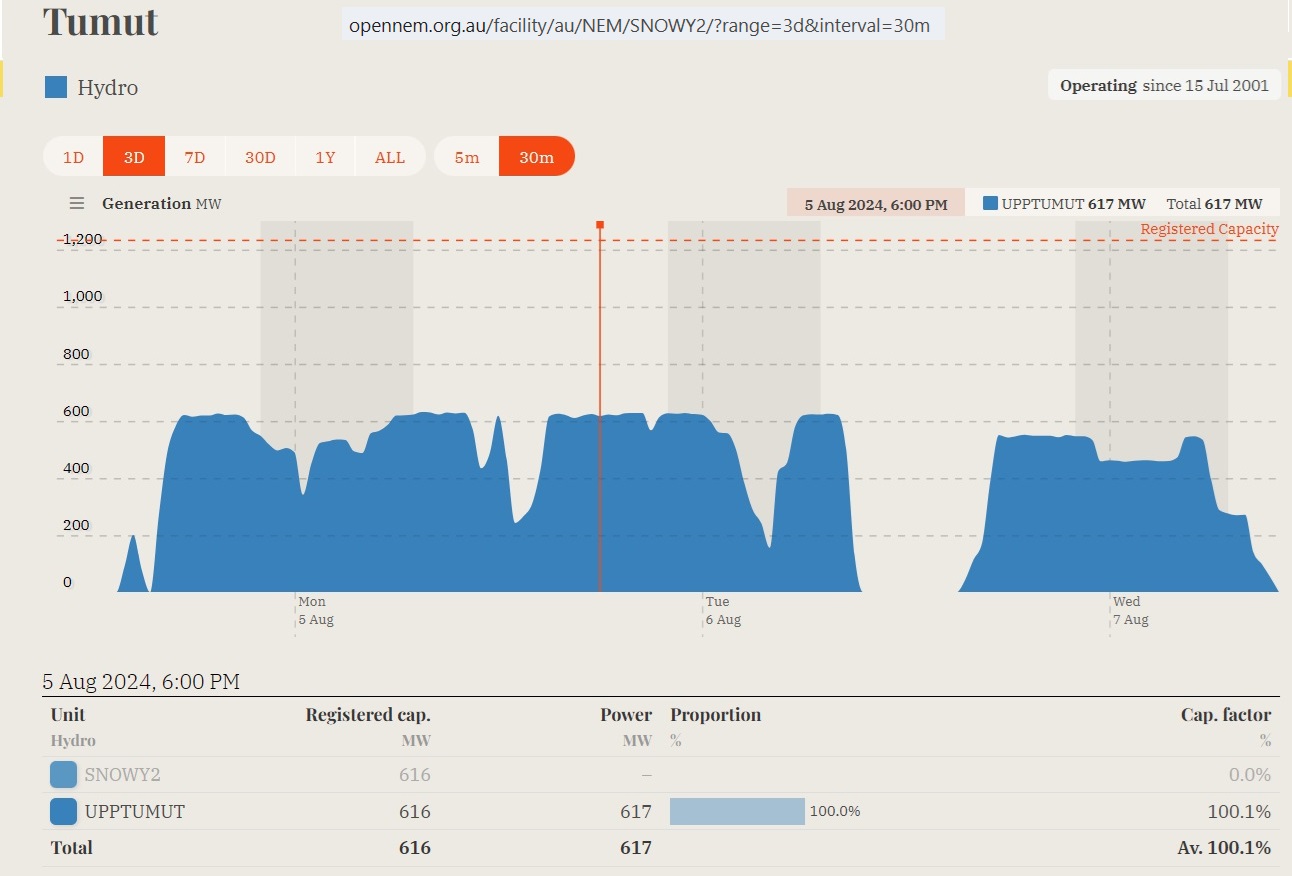 Fig 8: Tumut 1 (330 MW) and Tumut 2 (286 MW)
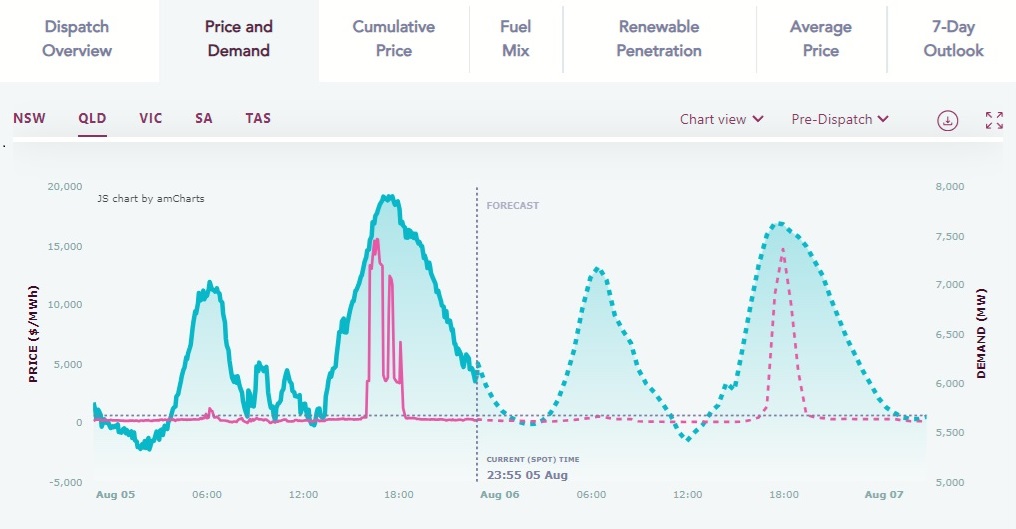 Fig 9: Afternoon/evening price spikes also in Queensland
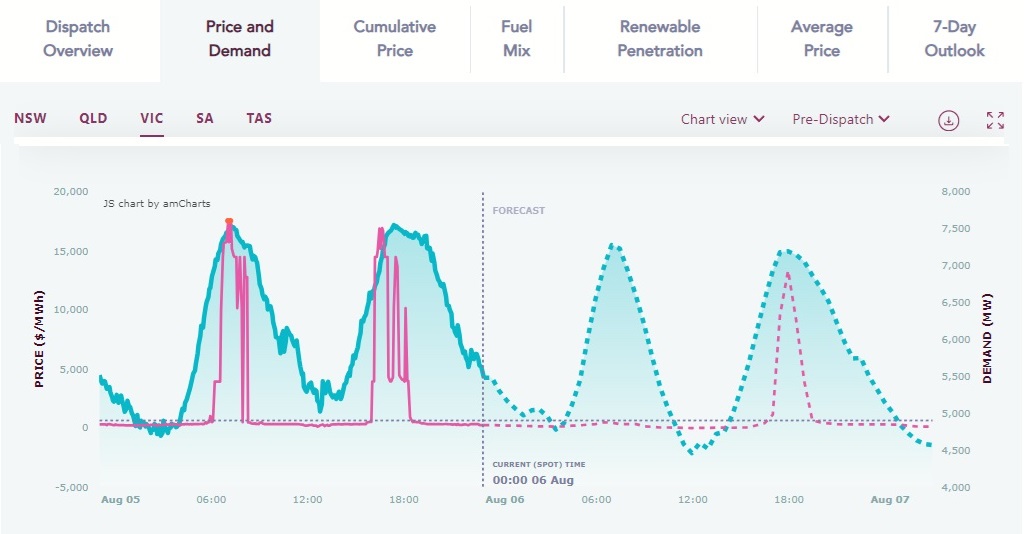 Fig 10: Two price spike periods in Victoria
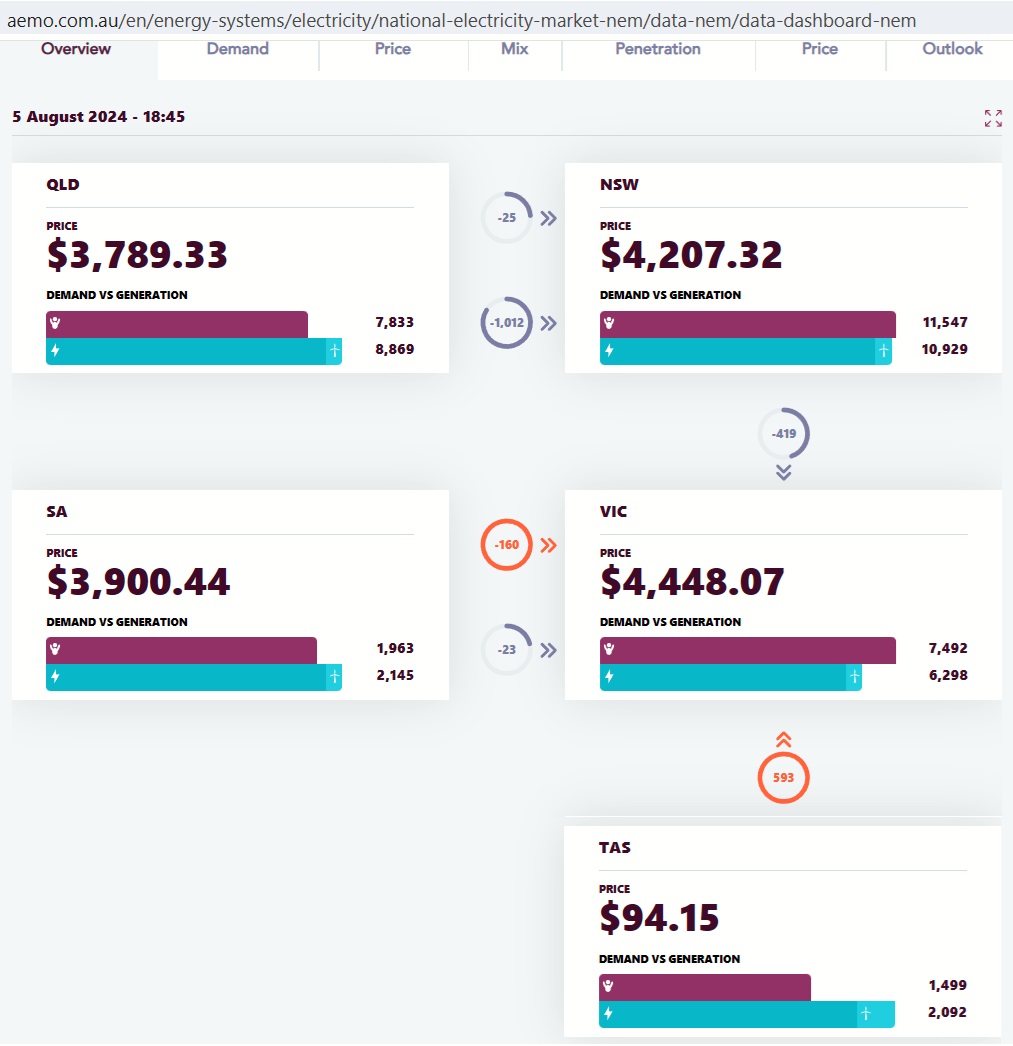 Fig 11: Power demand/generation balances by State during the evening peak
Victoria had the highest imbalance between demand and generation (1,194 MW), followed by NSW (618 MW). Queensland, South Australia and Tasmania were the exporters. These imbalances costed THE WHOLE EAST COAST dearly.
Please note that these calculations change every 5 min so Fig 11 is only a snapshot at that particular time. NSW imports over time are shown in Fig 5.
Conclusion:
It is obvious that the power supply system is under heavy stress in certain conditions. This is because redundancies like the Liddell power plant have been removed after this plant’s closure, contrary to media reports. The public is not aware of tight power supplies until the day the lights go out. And they will. Councils approve one energy hungry project after the other (mainly apartment towers), under duress from State governments who are energy complacent and have grand visions of perpetual growth.
Addendum with graphs from Watt Clarity
Wobbles in recent days, at Loy Yang A
posted on 15 Aug 2024
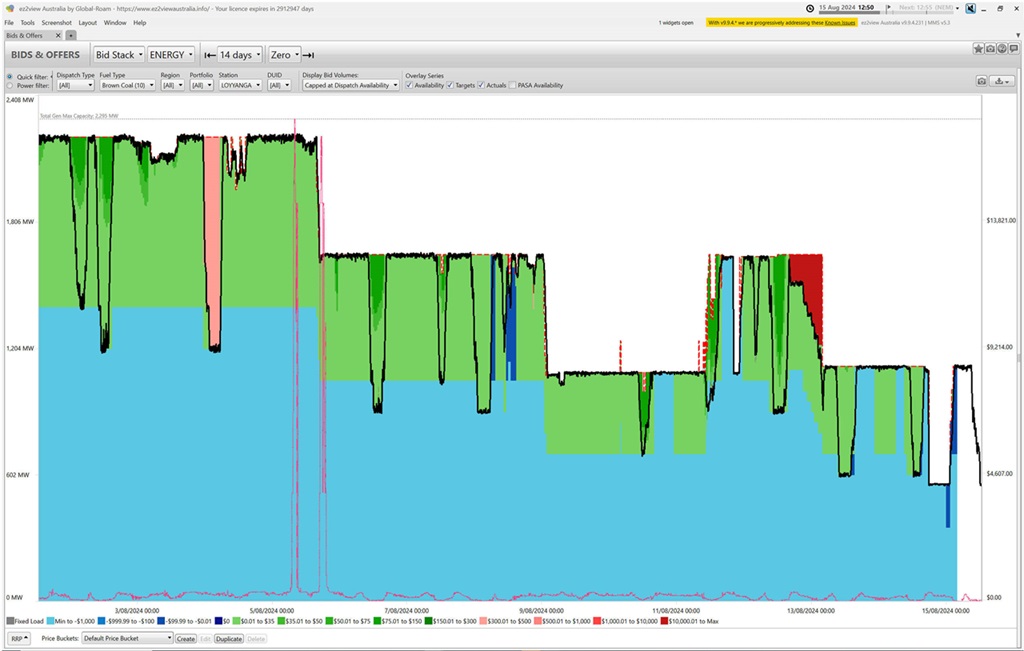 We see that the station dropped from 4 to 3 units online on Monday 5th August 2024, just prior to the second bout of volatility that day. There’s been 1, 2 or 3 units out simultaneously in the 10 days since.
https://wattclarity.com.au/articles/2024/08/15aug-loyyanga-unitsoff/
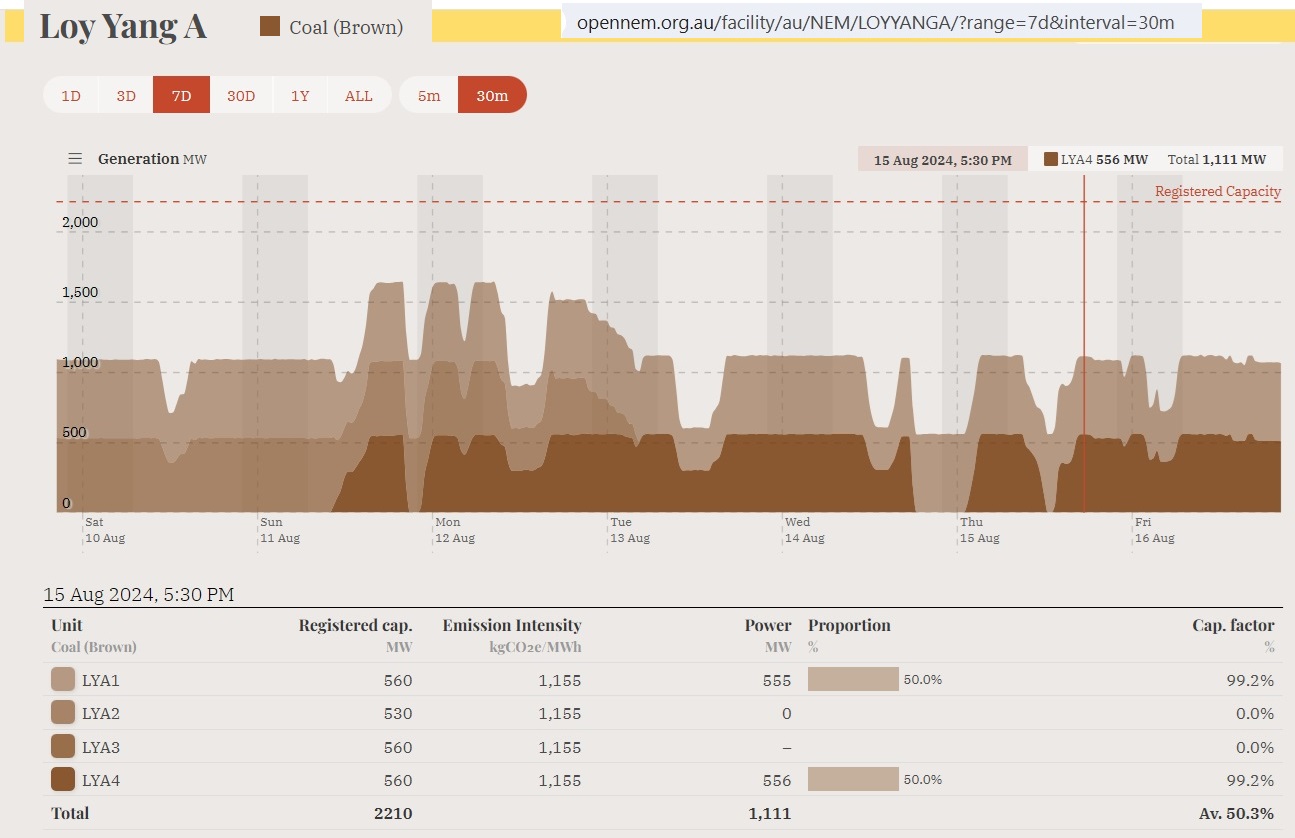 https://opennem.org.au/facility/au/NEM/LOYYANGA/?range=7d&interval=30m
Previous post:
31/7/2024
Chilly winter evenings and tight power supplies cause simultaneous price spikes in all Australian east coast States
https://crudeoilpeak.info/chilly-winter-evenings-and-tight-power-supplies-cause-simultaneous-price-spikes-in-all-australian-east-coast-states