The number of arriving and departing passengers on direct flights from/to (mainland) Chinese airports has peaked in 2018 and 2019, BEFORE the corona virus hit in the 1st quarter of 2020.
Arriving passengers
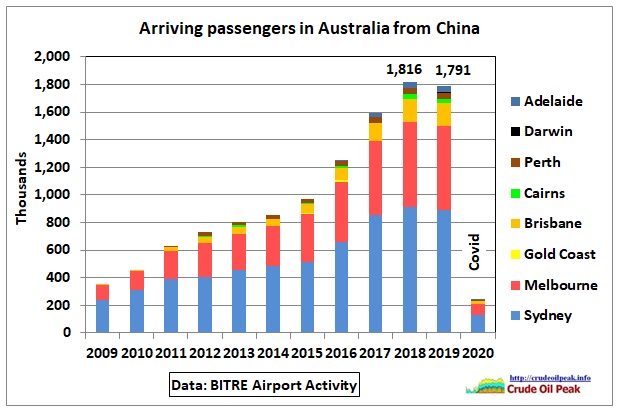 Fig 1: Chinese arrivals were a bit lower in 2019 than in 2018
Departing passengers
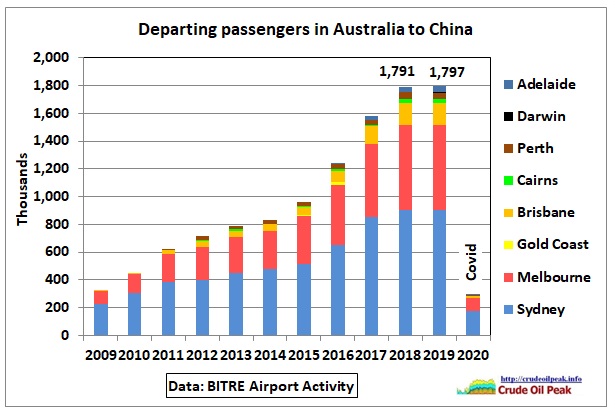 Fig 2: Chinese departures in 2019 were marginally higher than in 2018
Total Number of passengers
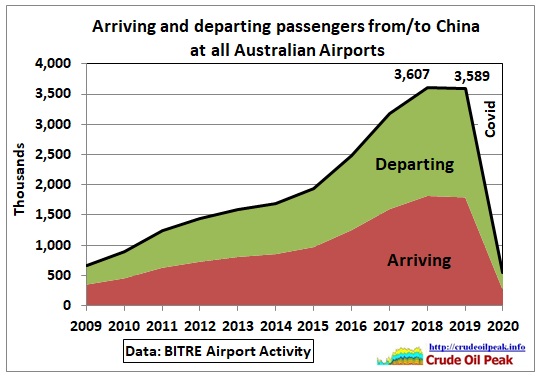 Fig 3: Arriving and departing passenger numbers declined slightly in 2018-2019
We do not know how accurate the BITRE statistics are but we can say that total passenger numbers remained flat in 2018 and 2019
How about adding Hong Kong?
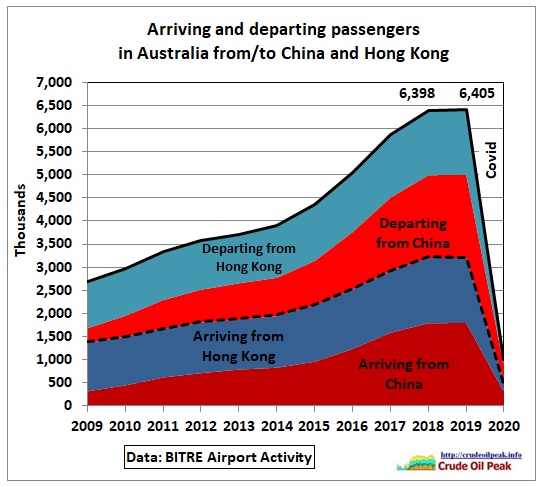 Fig 4: Arriving and departing passengers from China and Hong Kong
Total numbers increased slightly by 0.1%. The 2019 kink in the growth curve remains the same.
Difference between arriving and departing passengers
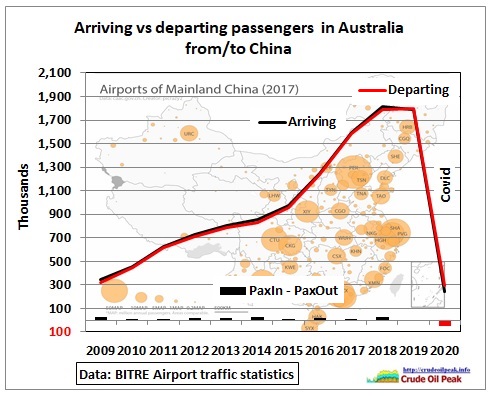 Fig 5: Arriving vs departing passengers
Compared to the total numbers, the differences are small (1.4% in 2018) but still allow to identify trends when looking at details:
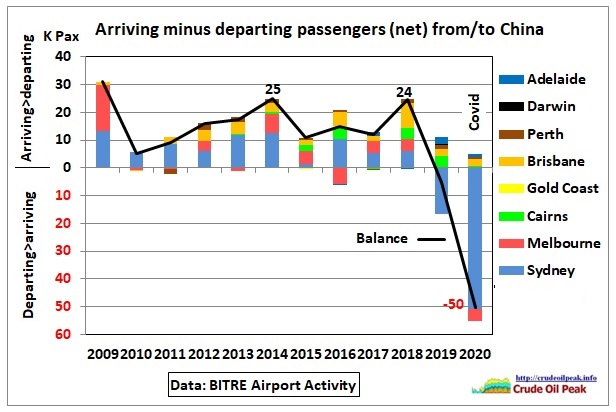 Fig 6: Arriving minus departing passengers
The columns above the zero line show arriving passenger numbers greater than departing passenger numbers. This means that these international passengers
a1 – remained in Australia in the year of arrival (adding to population) and/or
a2 – could have departed by flights to airports other than in China eg via SIN or HKG
The columns below the zero line show departing passenger numbers greater than arriving passenger numbers. This means that these passengers
b1 – were already in Australia before the departure year (subtracting from population) and/or
b2 – could have arrived by international flights from China via other airports eg SIN or HKG
The black line is the balance of columns above and below the zero line.
We can see that Australia slid into minus in 2019. More departing than arriving passengers. And that mainly from Sydney! Arriving passengers are supposed to be a bonanza for the Australian economy (tourists spending $$$, investors snapping up real estate and turning it into apartment towers for the construction industry, students paying fees to Universities etc)
Sydney Airport
Let’s extract the Sydney data from Fig 6:
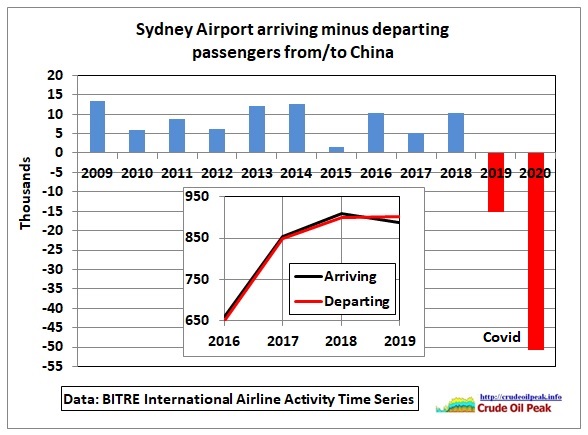 Fig 7: Arriving minus departing passengers between Sydney and China
The balance between arriving and departing passengers fluctuated between 1 and 13K on the positive side until 2018. There was a change in 2019 when departing exceeded arriving passengers.
Sydney Airport Master Plan 2039
This has of course implications for airport planning in Sydney. Kingsford Smith Airport has a master plan for 2039 (prepared in April 2019) with an air traffic forecast 2017-2039 in Fig 6-3.
This is being used in the following graph as an underlying picture:
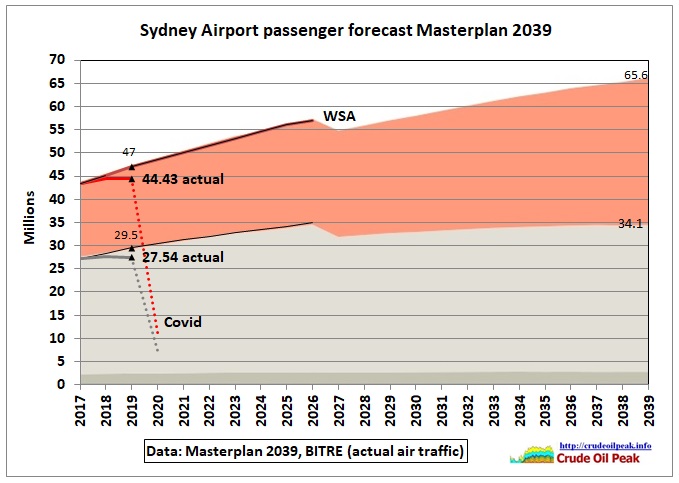 Fig 8: Actual air traffic data superimposed on the Masterplan’s forecast
The dip is expected when the Western Sydney Airport (WSA) is planned to open in 2026.
International air traffic was supposed to have been 17.5 million passengers in 2019 (growing at 3.7% pa to 22 m in 2026) but actually it was 16.89 mill. Not a big difference but the underlying trends for a change in Sydney’s air traffic growth in 2019 are important to analyse.
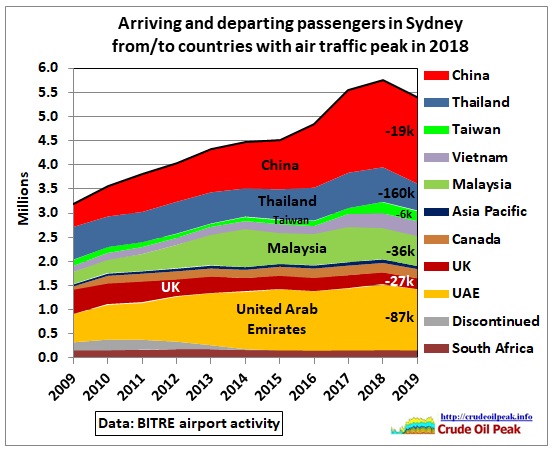 Fig 9: This group of countries had a common peak of 2018
The country with the highest drop (-160k Pax) was Thailand, followed by Malaysia (-36k) and UAE (-87k), serving as a hub for the Middle East and Europe where UK had an additional (-27k). China and Taiwan dropped together by -25k. Altogether minus 6.2%
Asia
Some of the drops may be explained by passengers using other hubs to get to/from Australia like Singapore. So let’s put all Asian countries north of Australia into one graph.
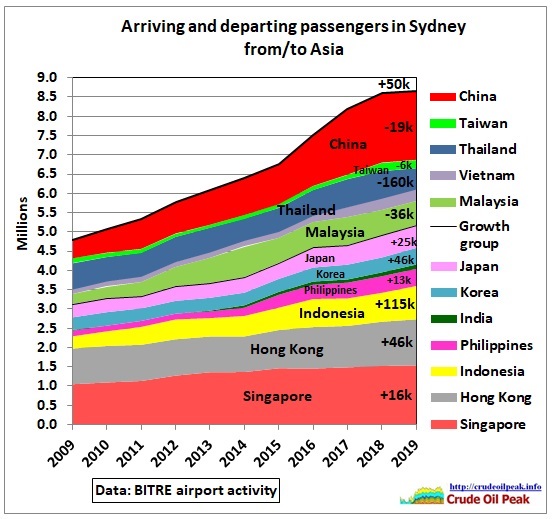 Fig 10: Air traffic to/from Asia with Sydney
There is not much growth in Singapore compared to the drops in Thailand and Malaysia. India is hardly visible. Surprising is the “performance” of Indonesia (+115k) which needs further study. And are mainland Chinese using Hong Kong (+46k) as a transit point? The growing group (thin black line) made +5.9%.
Altogether Asia grew by an anaemic 0.6% between 2018 and 2019.
Air traffic from/to outside Asia
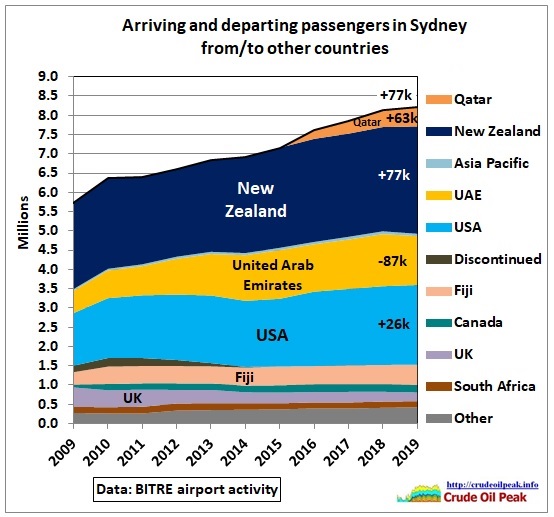 Fig 11: Other half outside Asia
Note: same scale as Fig 10
New Zealand is a special case due to the close relationship and visa free travel for citizen and residents. Earlier growth rates between 4% and 5% have changed to 0.1% to 3% in the last 4 years. US growth rates in the last 3 years came down to 1.3% in 2019.
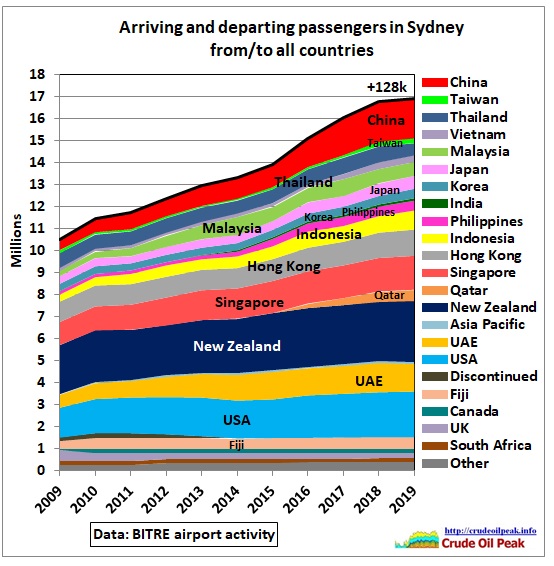 Fig 12: Sydney arriving and departing passengers from all countries
Now let’s make some trend assumptions and compare it to the international air traffic forecast in the 2039 Masterplan.
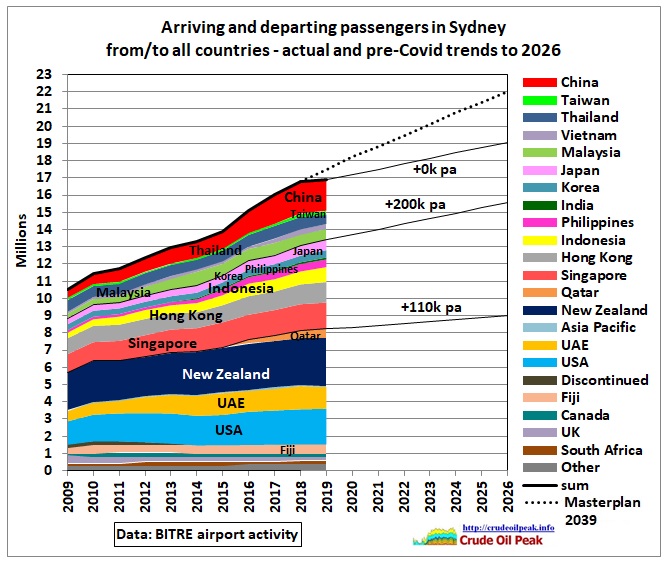 Fig 13: Sydney air traffic actual and trends
Following assumptions are being made about air traffic trends from/to:
(a) outside Asia and New Zealand +110k pa
(b) Asia (growth group) +200k pa
(c) Asia (decline group) +0K pa (optimistically)
Total growth assumed: 310K pa or 1.8% pa. That would result in 19 mill international passengers in 2026, not 22 million.
Western Sydney Airport
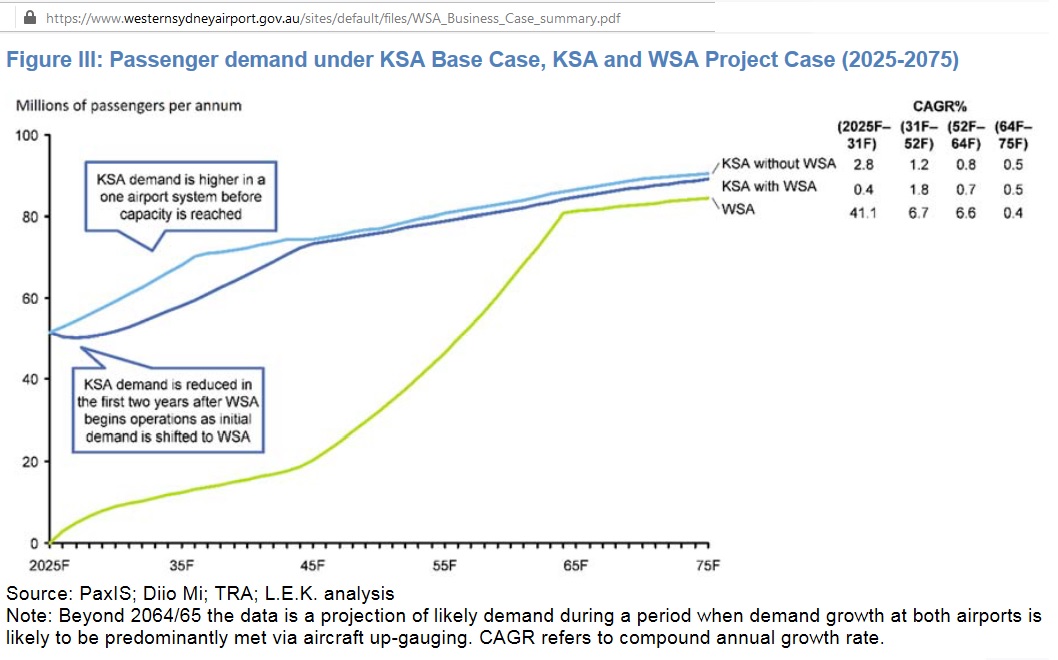 Fig 14: Western Sydney airport versus Sydney (Kingsford Smith) airport forecast
https://www.westernsydneyairport.gov.au/sites/default/files/WSA_Business_Case_summary.pdf
The above graph starts in 2026 (see “WSA” in Fig 8). It is a fantasy projection. As WSA is already under construction huge financial losses can be expected but this is a topic for another post. Those responsible for this white elephant must think how they can correct their mistake.
My submission 95 on the Aerotropolis is here:
https://www.planningportal.nsw.gov.au/WSAPP
Conclusion:
It is generally assumed that there will be a post-Covid snap-back to “normal” passenger traffic. However, this analysis shows that within a growing trend, there was a group of countries including China where passenger traffic to/from Sydney had either stagnated or declined already before the Wuhan virus hit in 2020. Now, international travel will be more difficult and costly. It will also impact on those domestic flights which come from international travelers. Australia with a policy of virus elimination has to decide if and when borders are opened to certain countries depending on their Corona management and that will determine future international air traffic according to each country’s share and travel trends as shown in this post.
Related posts:
7/10/2012
Peak oil lite: Sydney Airport passenger traffic 15% below 2009 forecast (part 1)
http://crudeoilpeak.info/peak-oil-lite-sydney-airport-passenger-traffic-15-pct-below-2009-forecast-part-1
16/4/2012
Fry and Fly – the new era of sustainable aviation
https://crudeoilpeak.info/fry-and-fly-the-new-era-of-sustainable-aviation
30/6/2011
Don Quijote and the (n) ever growing air traffic
http://crudeoilpeak.info/don-quijote-and-the-never-growing-air-traffic
17/2/2010
Report card 2009 (part 2): Aviation and airport plans – pies in the skies
https://crudeoilpeak.info/report-card-2009-part-2-aviation-and-airport-master-plans-pies-in-the-skies