Latest data from the Australian Department of Energy and Climate Change published on 24 Oct show that jet fuel stock were 745 ML, just 68 ML above the minimum stock holding obligation (MSO) of 677 ML.
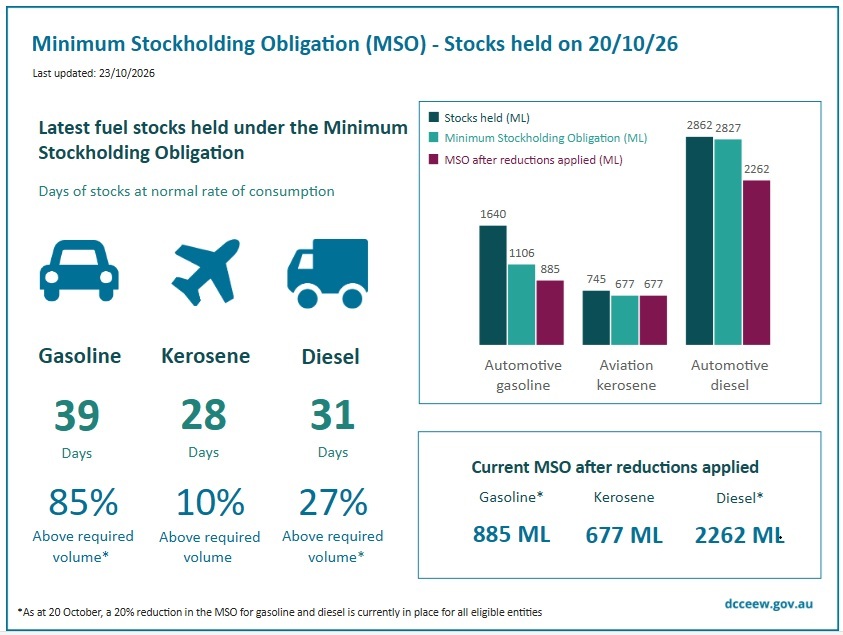 Fig 1: Government chart with stock as at 20 Oct 26
The operational volume above the MSO is wafer thin.
68 ML is the equivalent of 1 ½ medium range tankers (45 ML) which are part of a fleet serving Australian ports.
https://crudeoilpeak.info/tankers-arriving-and-departing-in-sydney
The DCCEEW website above is using a jet fuel consumption of 26.6 ML/day (=825/31) so 68 ML is 2.6 days cover.
A day after the publication of the above chart the Western Sydney Airport (WSI) saw its first passenger plane take off.
 Fig 2: The WSI will increase jet fuel demand, not to mention CO2 emissions
It is also to be noted that stock holding obligations will have to be increased accordingly. The tanks off Anton Rd (4×3 ML) are for operational purposes inside the airport.
Nothing of that was in the mind of the Prime Minister Albanese who attended the opening.
Here is his press release:
https://www.pm.gov.au/media/first-passengers-lift-wsi
The PM’s electorate in Marrickville is under the flightpath of the Kingsford Smith Airport near the CBD and expects a decrease in air traffic. However, the KSA Masterplan 2045 released in 2025 wants passenger numbers to go up from currently 42 m to 72.6 m pa.
https://downloads.ctfassets.net/bceklazo756y/5I8Hr4bvXjLPgJ44BluAHa/5a13c960045fbc4433ba5dab5a2ef644/3714.2_SYD_Master_Plan_2045_Gold_Amended_08.pdf
The WSI was originally approved by peak oil ignorant and climate change denier then Prime Minister Tony Abbott in April 2014:
The Government has confirmed that the site for Western Sydney’s new airport will be Badgerys Creek.
https://pmtranscripts.pmc.gov.au/release/transcript-23425
Let’s have a look at Australia’s jet fuel consumption (sales):
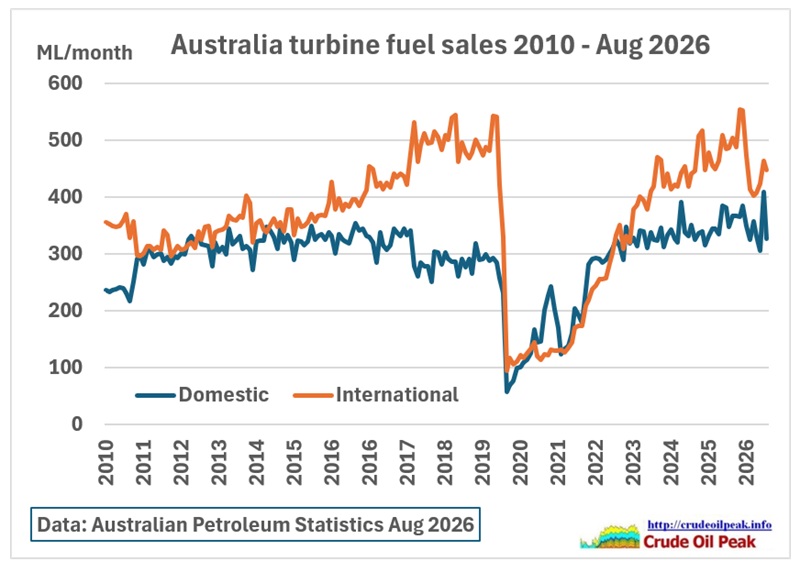 Fig 3: Australian jet fuel consumption (sales)
Jet fuel consumption had just come back to pre-Covid levels when the Iran war hit. Good luck, WSI.
In its first phase (10 million passengers) WSI would require 2.7 ML of jet fuel per day by the mid-2030s as calculated in this document:
Western Sydney Airport AIRPORT PLAN / SEPTEMBER 2021
Demand jet fuel 2.7 ML/ day
https://www.infrastructure.gov.au/sites/default/files/documents/wsa-plan-2021-variation-from-2020.pdf
Now back to the current jet fuel statistics.
The timeline of company declared stock compared to MSO levels and stock as reported by the Australian Petroleum Statistics is shown in following graph:
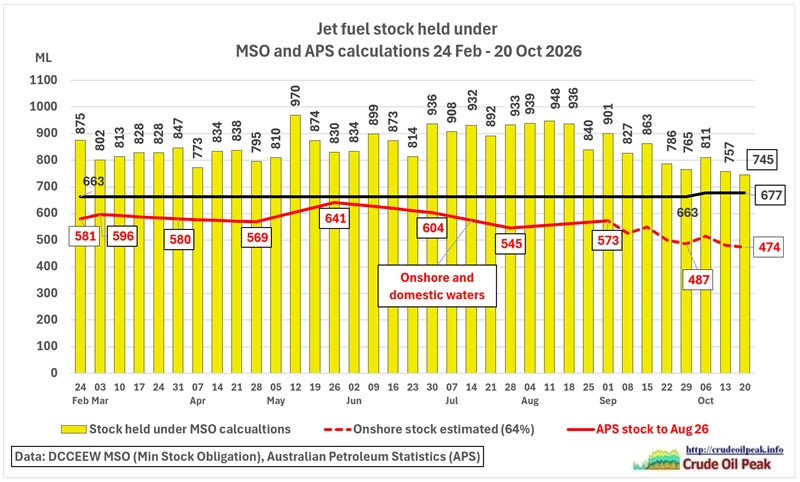 Fig 4: Jet fuel stock 24 Feb – 20 Oct 2026
Jet fuel stock has come down from its maximum in August. Note that on 1 Sep jet fuel stock in the Australian Petroleum Statistics (APS) was 573 ML while MSO defined stock was 901 ML. The difference between APS and MSO stock data is that MSO includes tankers offshore in the EEZ and beyond, a completely different metric. We can calculate 573/901= 64%. Applying this percentage to the MSO data after 1 Sep gives the red, dashed line on the above graph. We see:
• Onshore stock is way below MSO level
• MSO declared stock is barely above MSO level
Note the MSO was increased from 663 ML to 677 ML on 6 Oct 2026, something this website missed in 2 previous posts. Chris Bowen did not inform the public about this change.
Although detailed, company based MSO calculations are commercial in confidence we can do a simplified estimate as follows for FY 25/26:
MSO =
Annual jet fuel imports/365 x 27 (required cover) +
Annual jet fuel refinery production/365 x 24 days (required cover)
= 8,200/365×27 + 1,400/365×24 = 700 ML
Compare that to the 677 ML in Fig 1. Pretty close. Apparently, DEECCW has made some deductions, very likely a fraction of aviation bunkers and exports to Pacific Islands like PNG.’
The government has to do its detailed calculations taking into account following legislation:
FUEL SECURITY ACT 2021 (NO. 65, 2021)
Division 4
Section 14 Target number of days for stockholding
https://classic.austlii.edu.au/au/legis/cth/num_act/fsa2021173/
Fuel Security (Minimum Stockholding Obligation) Rules 2022
https://www.legislation.gov.au/F2022L01450/latest/text
Let’s have a look at the graphs showing the above import and refinery production data:
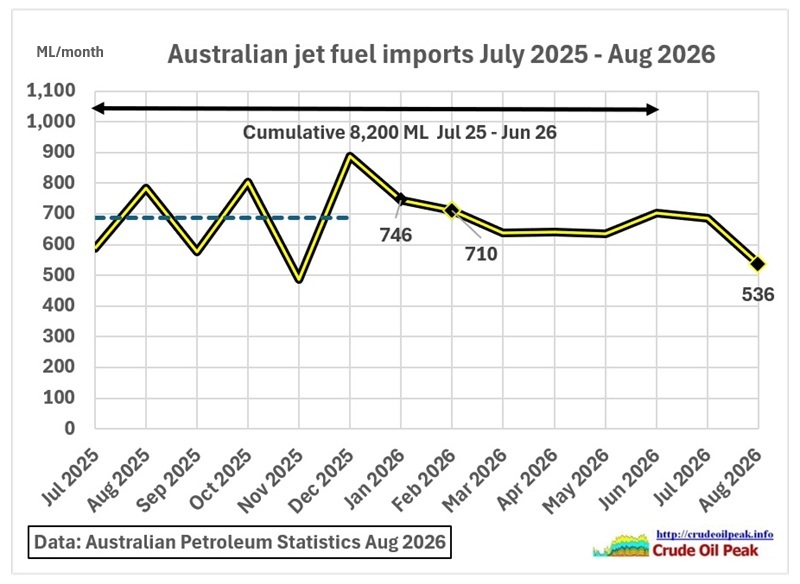 Fig 5: Cumulative jet fuel imports in FY 25/26 were 8,200 ML
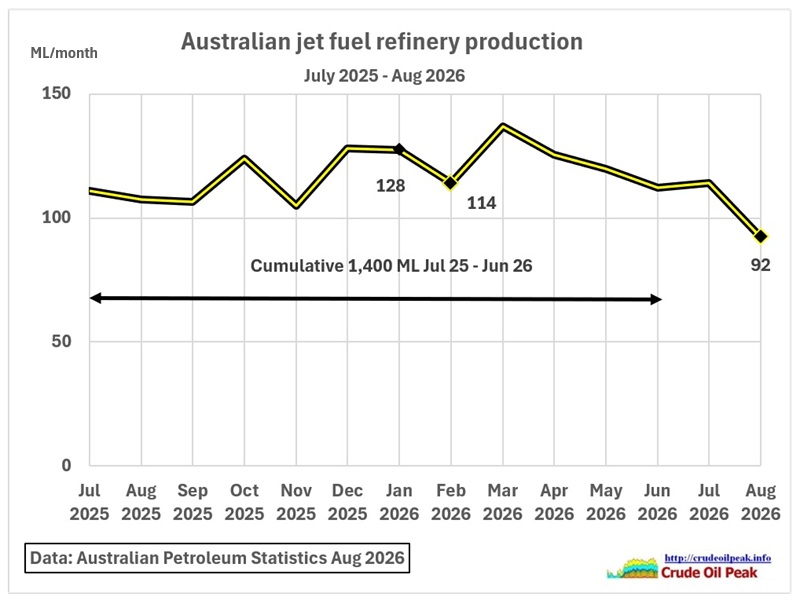 Fig 6: Cumulative jet fuel refinery production in FY 25/26 was 1,400 ML
From Fig 5 and Fig 6 we can see that MSO calculations will change in future.
For completeness of this article, here are the graphs for diesel and petrol stock:
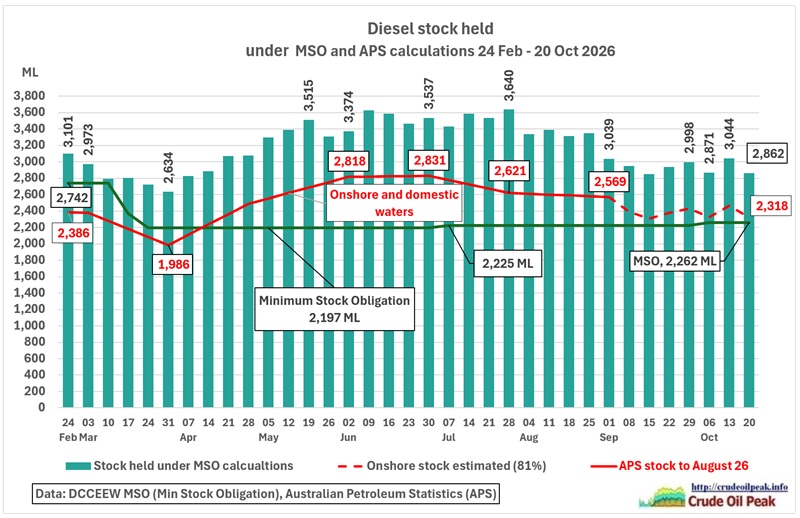 Fig 7: Diesel stock 24 Feb – 20 Oct 2026
Diesel stocks are hovering around the level seen on 3rd March. The peak is in the rear view mirror.
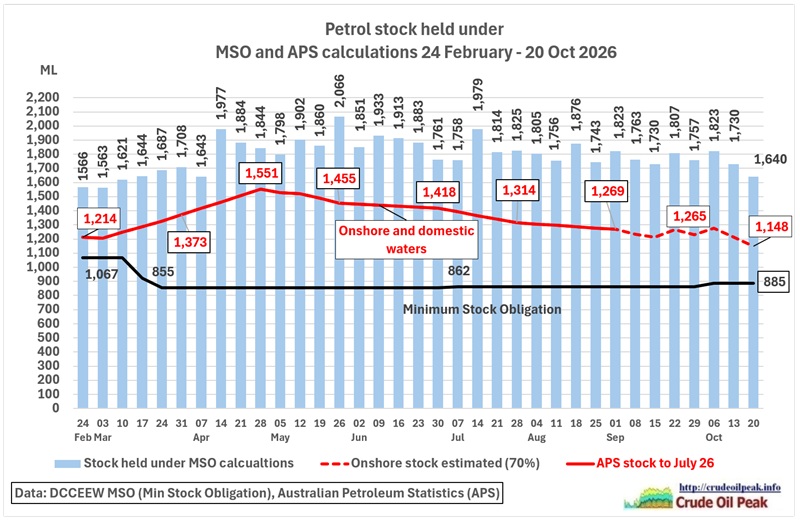 Fig 8: Petrol stock 24 Feb – 20 Oct 2026
Petrol stock is back to 7 April level
Not a single word on the above in the Energy Minister’s press conference on 24 Oct
MINISTER FOR CLIMATE CHANGE AND ENERGY, CHRIS BOWEN: Thanks for coming, everyone. Australia has 39 days worth of petrol, two days less than last week’s update, 31 days worth of diesel, also two days less, and 28 days worth of jet fuel, which is the same as last week’s update
https://minister.dcceew.gov.au/bowen/transcripts/press-conference-fairfield-west-nsw-8
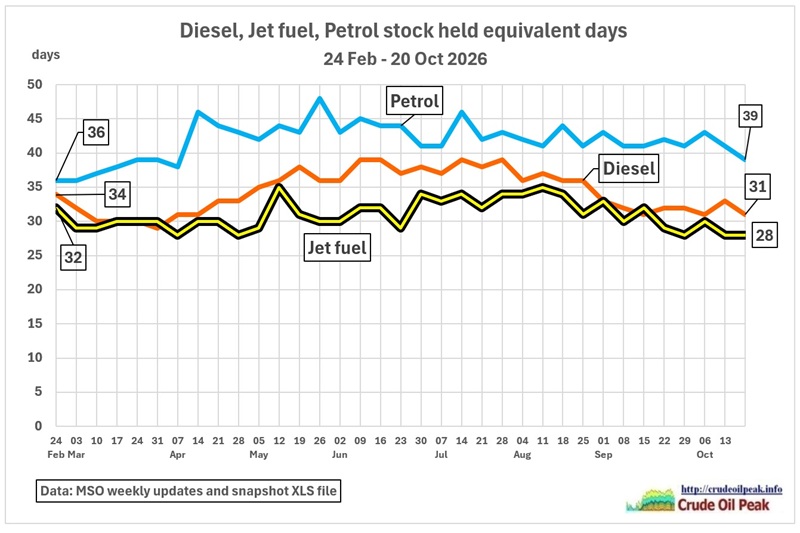 Fig 9: Days consumption cover
Consumption data are taken as sales data in the Australian Petroleum Statistics. In FY 25/26 jet fuel sales were 9,975 ML/365 = 27.33 per day. That makes 745 ML stock divided by 27.33 is 27.3, apparently rounded up to 28.