OPEC entered the 1st Covid year 2020 with reference production data and “voluntary adjustments” which were set by the Joint Ministerial Monitoring Committee (JMMC) on 18 Jan 2019. https://www.opec.org/opec_web/en/press_room/5357.htm

Fig 1: Extract for OPEC 10 from table provided by JMMC dated 18 Jan 2019
https://www.opec.org/opec_web/static_files_project/media/downloads/press_room/Voluntary%20production%20adjustments%20table%20att%20PR12019.pdf
Note that Iran and Venezuela were not included. Ecuador quit OPEC in January 2020.
The production data are taken from secondary information available in OPEC’s monthly oil market reports: https://www.opec.org/opec_web/en/publications/4814.htm
The quotas have to be seen in the historic context of OPEC’s World Oil Outlook 2040 which had been released a month earlier. https://www.opec.org/opec_web/static_files_project/media/downloads/publications/WOO_2019.pdf
This report estimated 3.3 % world GDP growth with 0.5 % pa growth in oil demand (China +1.3%, India +3.5%). Oil demand was supposed to increase from 92.1 mb/d to 100.7 mb/d in 2040
Additional adjustments were published by the 7th OPEC and non-OPEC Ministerial Meeting on 6th Dec 2019
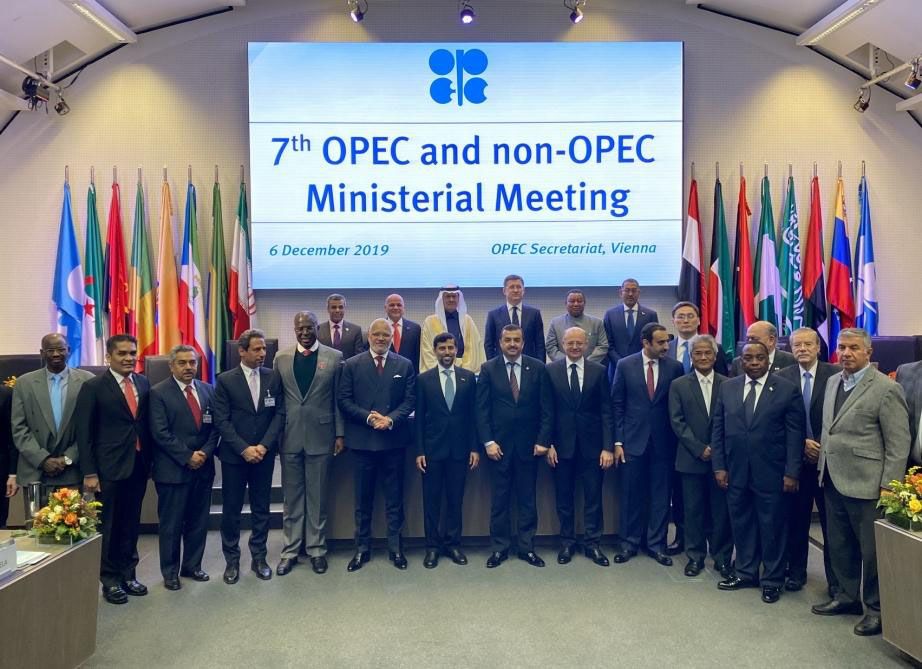 Fig 2: In Vienna, Austria
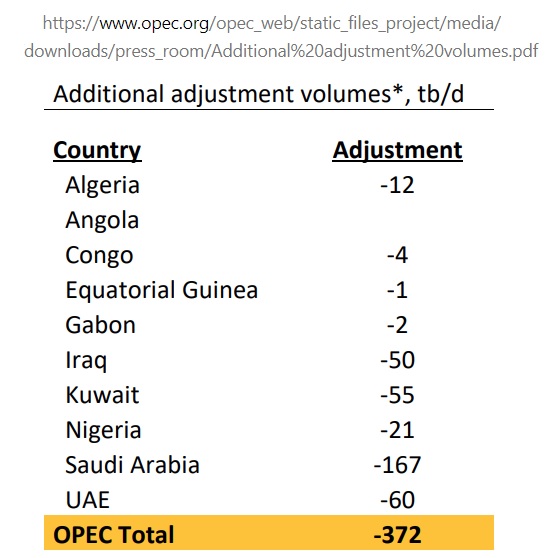 Fig 3: Additional adjustments Dec 2019 for OPEC countries
https://www.opec.org/opec_web/static_files_project/media/downloads/press_room/Additional%20adjustment%20volumes.pdf
“The 7th OPEC and non-OPEC Ministerial Meeting, hereby decided for an additional adjustment of 500 tb/d [OPEC + Non-OPEC] to the adjustment levels as agreed at the 175th Meeting of the OPEC Conference and 5th OPEC and non-OPEC Ministerial Meeting. These would lead to total adjustments of 1.7 mb/d. In addition, several participating countries, mainly Saudi Arabia, will continue their additional voluntary contributions, leading to adjustments of more than 2.1 mb. This additional adjustment would be effective as of 1 January 2020 and is subject to full conformity by every country participating in the DoC.”
https://www.opec.org/opec_web/en/press_room/5797.htm
For OPEC 10, the total adjustment of -1,184 kb/d, that is 4.4 %, resulted in a voluntary production level of 25,565 kb/d as of Dec 2019
Then the Wuhan virus hit. In 2020, there were no OPEC meetings which changed the quotas. That is understandable because of the new situation with much lower demand.
In the 13th meeting on Jan 5th 2021 https://www.opec.org/opec_web/en/press_room/6310.htm the reference production was increased for Nigeria (+91 kb/d) and Saudi Arabia (+367 kb/d) allowing these countries to show high adjustments.
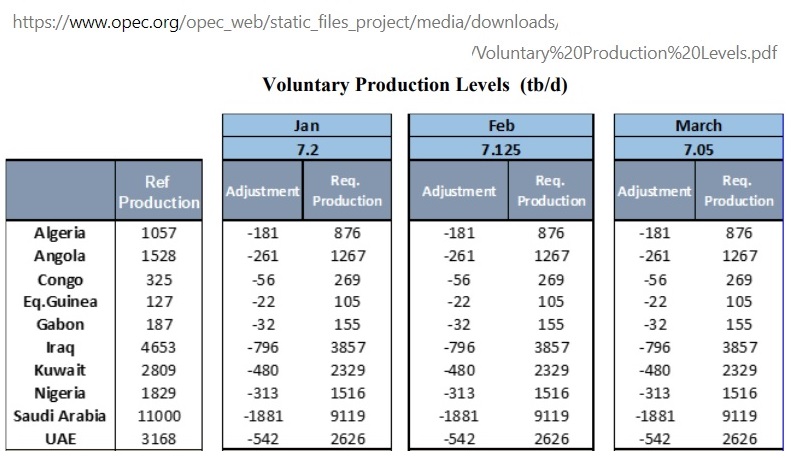 Fig 4: Reference production as of Jan 2021 and adjustments for 1Q 2021
https://www.opec.org/opec_web/static_files_project/media/downloads/Voluntary%20Production%20Levels.pdf
There were 8 consecutive meetings in 2021 and monthly meetings in 2022 which slowly increased “required production” levels.
At the 19th Meeting, on 18th July 22, https://www.opec.org/opec_web/en/press_room/6512.htm
the reference production was again increased, for Iraq (+150 kb/d), Kuwait (+150 kb/d), Saudi Arabia (+500 kb/d) and UAE (332 kb/d)
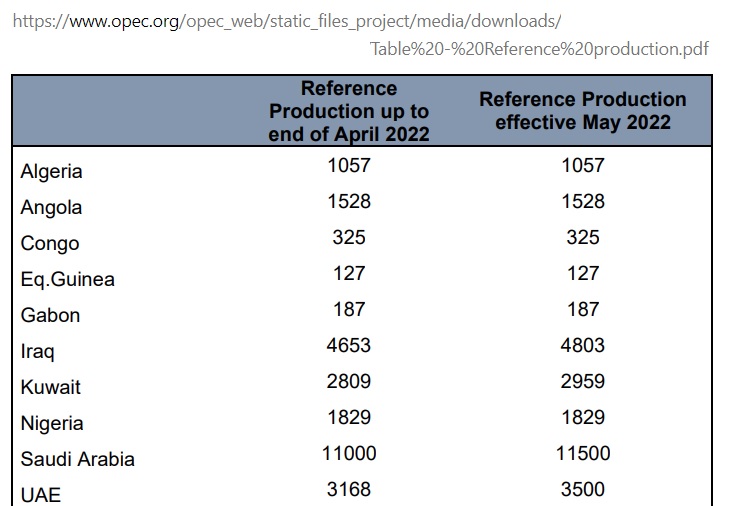 Fig 5: Reference production increased for Iraq, Kuwait, Saudi Arabia and UAE
https://www.opec.org/opec_web/static_files_project/media/downloads/Table%20-%20Reference%20production.pdf
So let’s put all these historical records of reference and required production levels in some charts. We go through the member list alphabetically.
Crude production data (excluding condensate, red curves) are from here:
https://www.eia.gov/outlooks/steo/data.php?type=tables
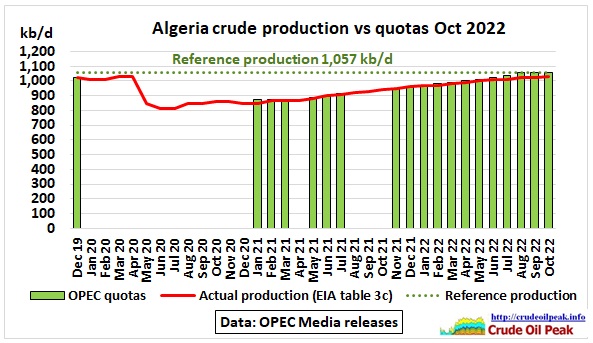 Fig 6: Algeria’s quotas and actual production
Algerian crude production peaked in 2006-2008 at around 1.4 mb/d and had dropped to 1 mb/d by 2016, a level which was maintained until April 2020 and has been achieved again end 2022.
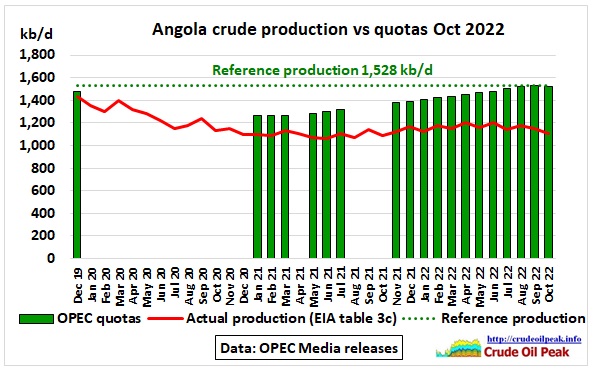 Fig 7: Angola’s quotas and actual production
Angola’s production peaked in 2010 at around 2 mb/d but had dropped to 1.32 mb/d by April 2020. The reference production was unlikely to have been produced in the last 3 years.
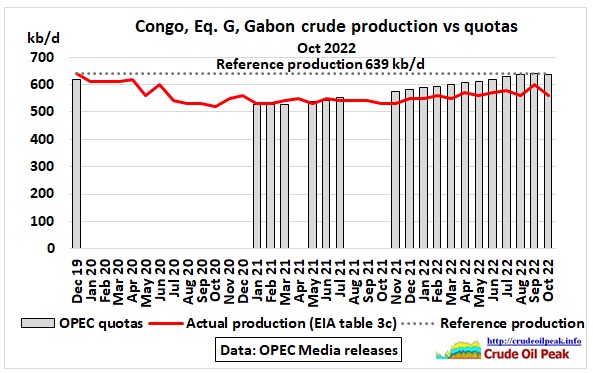 Fig 8: Congo (Brazzaville), Equatorial Guinea, Gabon
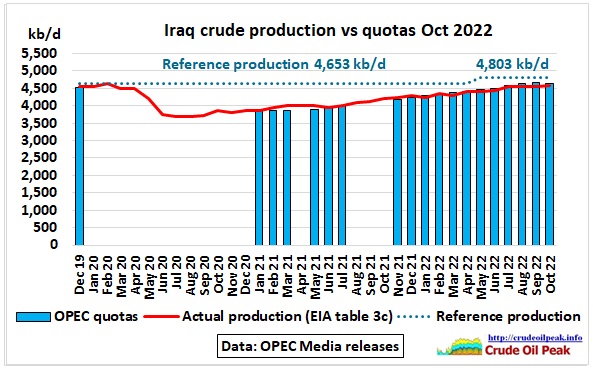 Fig 9: Iraq’s quotas and actual production
After the Iraq war in 2003 it took 16 years until production reached 4.7 mb/d in 2019. That is again the level now end 2022. The annualized growth rate in the period July 20 – Oct 22 was around 10%. The reference production was increased as it approached “required production” levels.
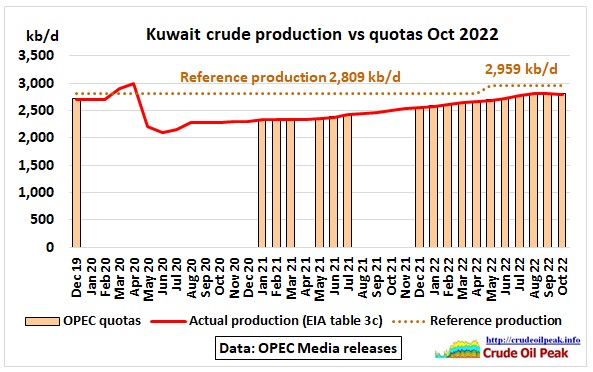 Fig 10: Kuwait’s quotas and actual production
It is amazing how linear the production growth (14% pa) was after Aug 2020, given that there were various Covid19 and Omicron waves impacting on global oil demand.
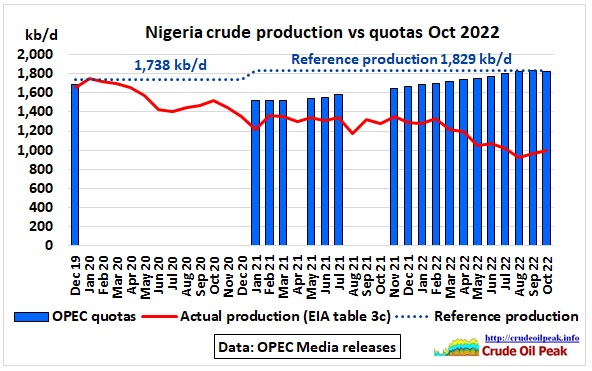 Fig 11: Nigeria’s quotas and actual production
Quotas for Nigeria were obviously set to high. Maybe that was done to treat all members equally.
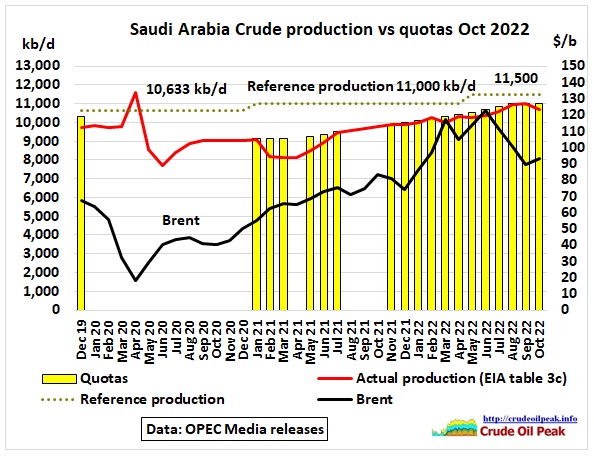 Fig 12: Saudi Arabia’s quotas and actual production
More variability in 2021 compared to neighbouring countries. If the production data are correct, Saudi Arabia increased crude production after Aug 21 at an annualised rate of 10%. How long that can be maintained is a big question. Note also that high oil prices above $100/barrel after the Russian invasion In Ukraine did not result in higher production.
1/10/2019 The Attacks on Abqaiq and Peak Oil in Ghawar
http://crudeoilpeak.info/the-attacks-on-abqaiq-and-peak-oil-in-ghawar
 Fig 13: UAE’s quotas and actual production
Summary
The almost linear production increases in OPEC Middle East countries and the immediacy in which quotas were subsequently changed upwards raises some questions.
In Oct 22, actual production was down by 2.9 mb/d from reference production levels set in the 19th meeting (July 2022, see Fig 5). However, this reference production level had been increased several times over the level in force in Dec 2019, before Covid started. The “production cut” compared to that original level (Fig 1 + Fig 3) is only 1.3 mb/d.
So when you read about OPEC production cuts that information is not sufficient. It depends on what the reference production is.