Report from AEMO (AEMO=Australian Energy Market Operator) on East Coast gas supplies:
21 Mar 2024
AEMO’s latest gas market outlook for Australia’s east coast has forecast a gap in gas supply for southern states from 2028, as production from Bass Strait continues to decline faster than demand.
The report signals that new investment is urgently needed if gas supply from 2028 is to keep up with demand from homes and businesses, and for gas-powered electricity generation.
It also highlights risks of peak-day shortfalls on some days under extreme winter conditions from 2025 and the potential for small seasonal supply gaps from 2026 in southern states.
…..
While the report identifies the need to deliver new infrastructure by 2026, running gas-powered generators on liquid fuels could provide temporary relief during periods of extremely high gas demand.
https://aemo.com.au/newsroom/media-release/gas-market-outlook-signals-need-for-new-investment
The above mentioned report (Gas Statement of Opportunities 2024) is here:
https://aemo.com.au/energy-systems/gas/gas-forecasting-and-planning/gas-statement-of-opportunities-gsoo
On page 49 we find:
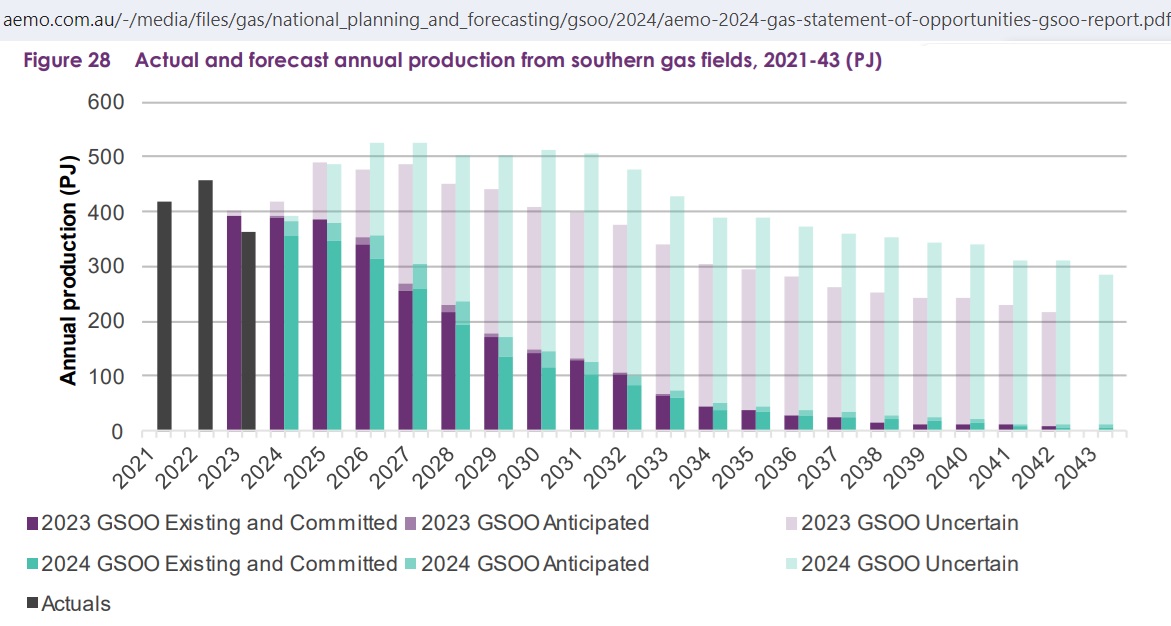 Fig 1: AEMO’s Fig 28 in the GSOO 2024. Declining trend in southern gas fields
From the data for the above graph
https://aemo.com.au/-/media/files/gas/national_planning_and_forecasting/gsoo/2024/2024-gas-statement-of-opportunities—report-figures-and-data.xlsx?la=en
we can calculate that gas production decreased from 457 PJ in 2022 to 363 PJ in 2023 (-20.6%) which did not come unexpectedly. But the decline was 6% more than what was estimated 1 year ago in the GSOO 2023. It is anticipated that gas production will somehow stabilize in the next 2 years but resume its decline in 2026 at -12%.
How did Australia manage to arrive in this situation?
On the website of the Australian Energy Regulator we find this graph:
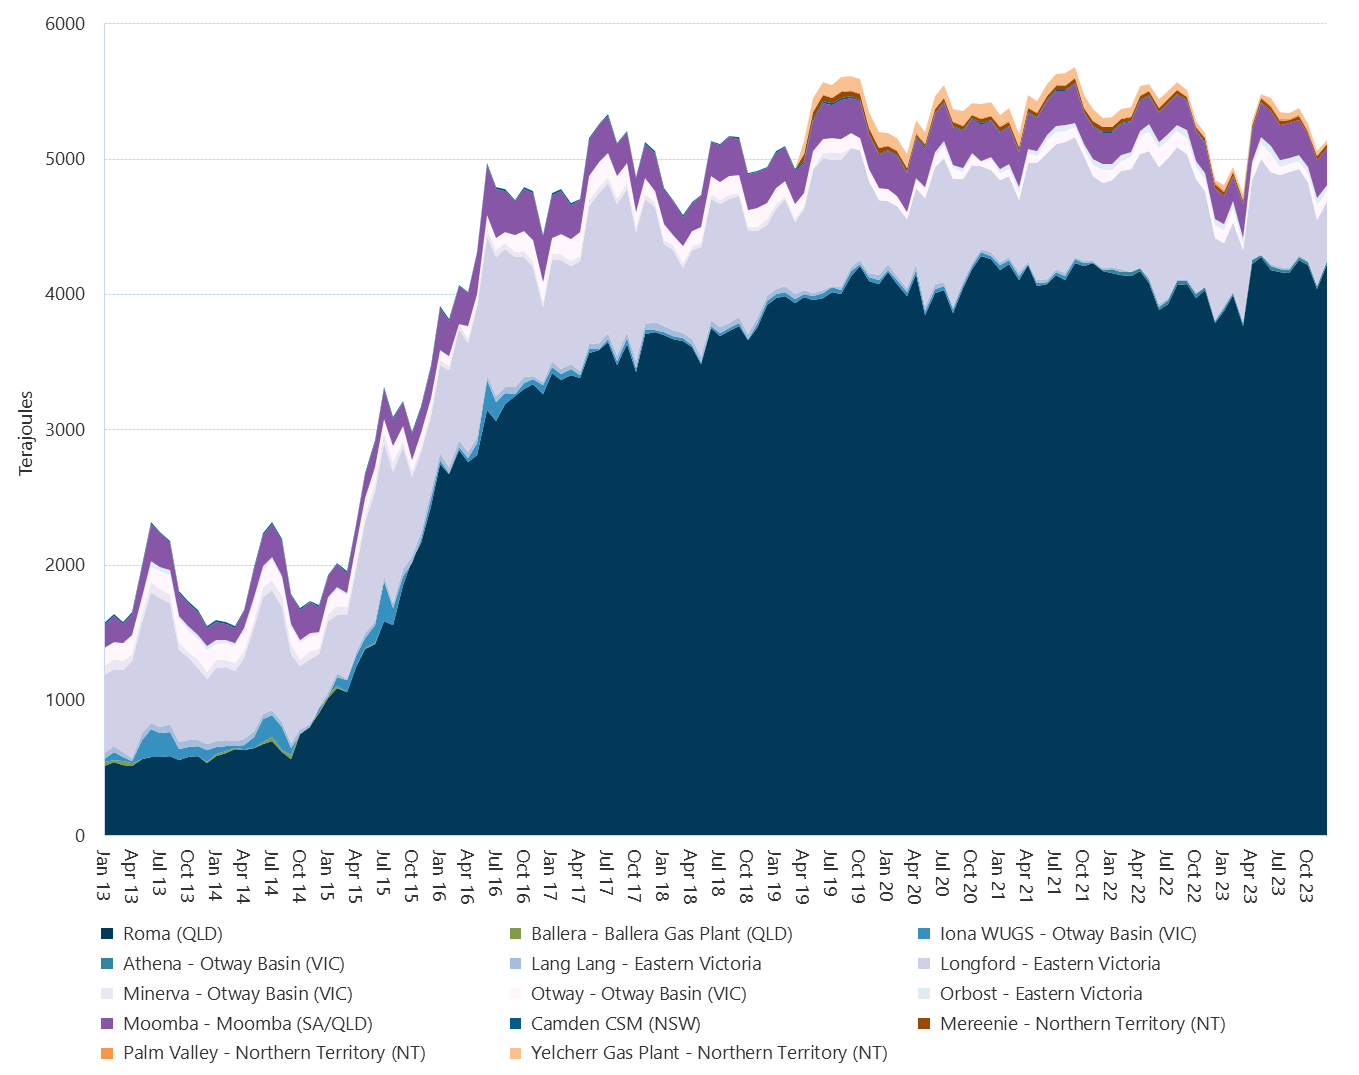 Fig 2: Average daily production for production points
https://www.aer.gov.au/industry/registers/charts/average-daily-production-production-points
Most of the gas from Roma is exported (largely wasted as LNG exports from Gladstone at the capacity of the LNG trains – the first approved in October 2010 by the Minister for “Sustainability and Environment” Tony Burke without a domestic gas reservation policy). In the 2nd half of 2023 exports have increased again while production from Longford decreased. This happened despite the
Australian Domestic Gas Security Mechanism (in effect since 1 July 2017)
The Australian Domestic Gas Security Mechanism (ADGSM) ensures there is sufficient natural gas supply to meet the needs of Australian energy users. The ADGSM is a measure of last resort.
If a gas supply shortfall is forecast for Australia, liquefied natural gas (LNG) projects may need to limit exports or find new gas sources.
https://www.industry.gov.au/mining-oil-and-gas/oil-and-gas/securing-australian-domestic-gas-supply
But the Federal government is reluctant to activate he ADGSM:
Gas supply and demand outlook for 2024 quarter 2
21 Dec 2023
The Australian Government will not activate the Australian Domestic Gas Security Mechanism (ADGSM) for the April to June 2024 quarter.
The data forecasts enough gas across the east coast to meet demand in 2024. However, market conditions will depend on how much liquified natural gas is exported in 2024. Seasonal (winter) shortfalls are expected. This will require gas supplied from Queensland and out of storage.
• Australia’s gas market will have enough supply from April to June 2024
• there is enough pipeline capacity to bring gas supply to southern markets and gas storage levels are satisfactory
• any domestic supply shortages can be addressed without reducing gas exports.
https://www.industry.gov.au/news/gas-supply-and-demand-outlook-2024-quarter-2
The last sentence shows that the government still has the priorities in favor of exports.
Let’s expand in Fig 2 the area above the Roma (QLD) production:
 Fig 3: Daily gas production Victoria, NSW and Moomba (SA – Qld)
https://www.aer.gov.au/industry/registers/charts/average-daily-production-production-points
The peaks are during the winter months. So let’s calculate the annual production and convert it to PJ per annum.
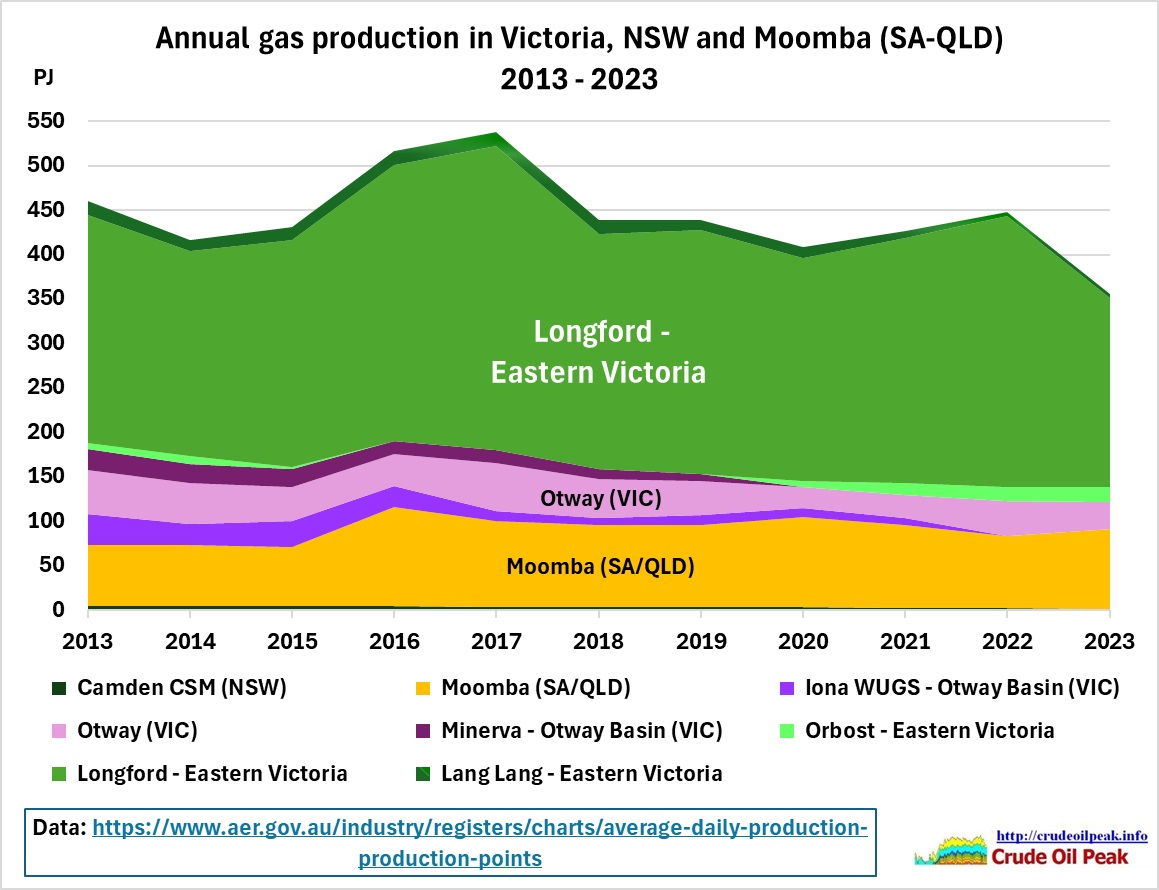 Fig 4: Annual gas production Victoria, NSW and Moomba (SA – Qld)
Apparently gas production peaked 2016/17.
Let’s compare the production point data with AEMO’s graph (Fig 1) and previous GSOOs
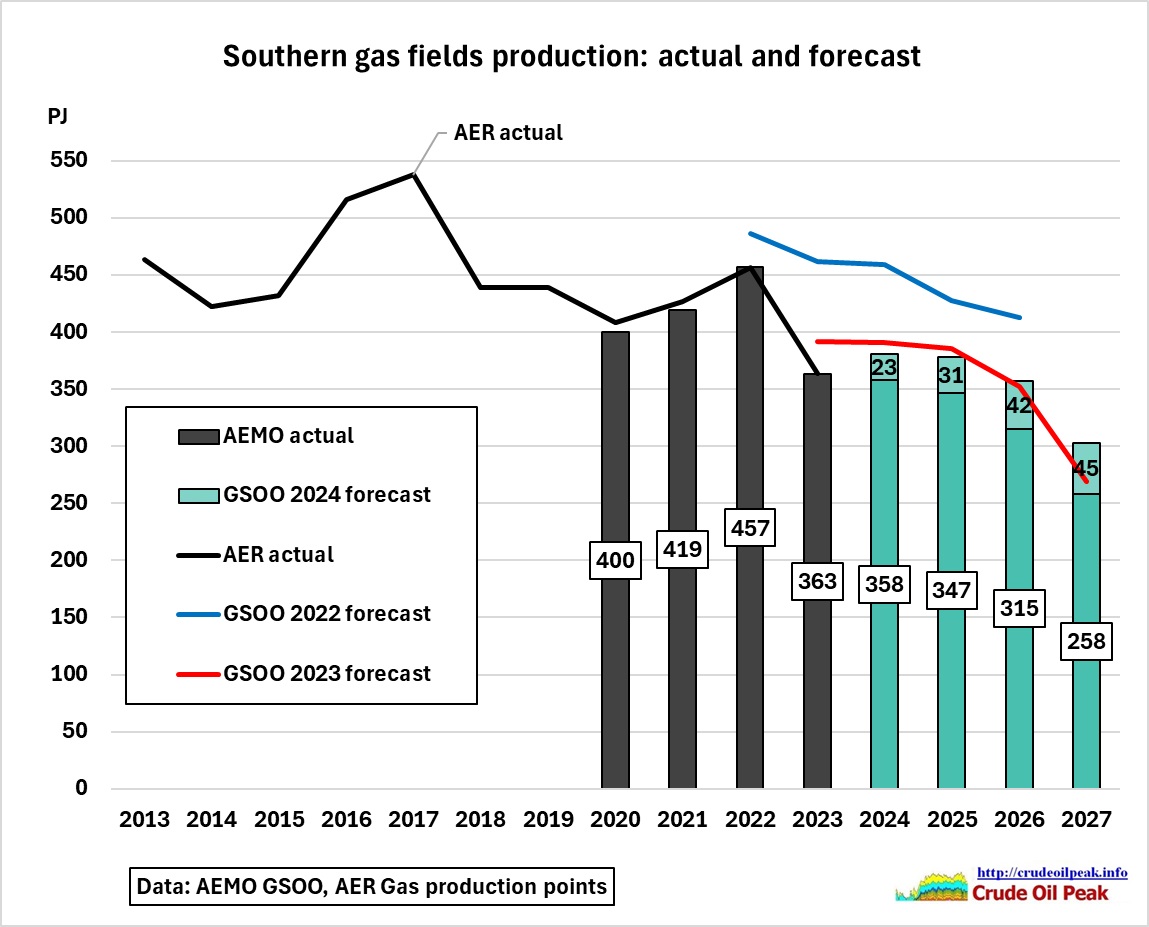 Fig 5: Southern gas fields production AEMO GSOO vs AER data
We see that forecasts in the GSOO 22 were too high, around 40-70 PJ pa. The GSOO 2023 was lower. Whether the GSOO 2024 will materialize, will depend on whether anticipated projects come on stream.
Let’s check on the depletion levels in the gas fields, using Geoscience Australia’s latest reserves and resources data for 2021
 Fig 6: Extract from “Australia’s remaining gas reserves (2P) and resources (2C) 2021”
https://www.ga.gov.au/digital-publication/aecr2023/gas
Depletion levels of 2P reserves in 2021:
Cooper 8,686/(8,686+1,061+1,630+2,180)=64%
Bass/Otway 1,976/(1,976+1,016+738) = 53%
Gippsland 12,328/(12,328+1,965+2,927) = 72%
The numbers up to the last PJ suggest an accuracy which does not exist. They are the result of probability calculations. Just adding them up may not even be correct. But these numbers are used so that the reader can easily relate them to Fig 6.
The higher the depletion levels, especially >50%, the more difficult and costly it will be to produce the remaining reserves. Easy reserves are always produced first.
We calculate cumulative production taking the numbers from Fig 1.
What would be the depletion levels at the end of the forecast period (2043)?
Committed and Anticipated production
Cumulative gas production in the GSOO 2024 for the period 2024-2043 (Fig 3):
Existing and Committed: 2,165 PJ
Anticipated 384 PJ
Total 2,549 PJ
Gas reserves (GA 2021)
Cooper 1,061 PJ
Bass/Otway 1,016 PJ
Gippsland 1,965 PJ
Production 2022-2023 800 PJ
Total 3,242 PJ
So by 2043 existing reserves would be depleted by 2,549/3,242= 79% (without turning some of the conventional resources of 1,630+738+2,927=5,295 PJ into reserves)
Uncertain production
The cumulative uncertain production 2024-2034 in Fig 1 is 5,763 PJ (green faded columns sitting on top of the green columns with production from existing gas fields and committed projects). Theoretically, following reserves and resources would be available:
Balance reserves 3,242 – 2,549= 693 PJ
Conventional resources 5,295 PJ
Conventional 5,988 PJ > 5,763 PJ
In this back-of-the-envelope calculation, conventional reserves and resources would be completely depleted at the end of the forecast period in this business-as-usual production scenario. In practice, however, production will decline, requiring unconventional gas (coal seam gas) to maintain uncertain production as shown in Fig 1.
Unconventional resources 2,180+10+2,264= 4,454 PJ
To be continued on Narrabri coal seam gas.