Once a month the Energy Minister’s weekly fuel update
https://minister.dcceew.gov.au/bowen/transcripts/press-conference-fairfield-west-nsw-7
coincides with the release of new data from the Australian Petroleum Statistics (in this case August), the moment of the truth because these statistics are free from any political narrative which usually dominates the Minister’s press conferences.
(1) Fuel imports
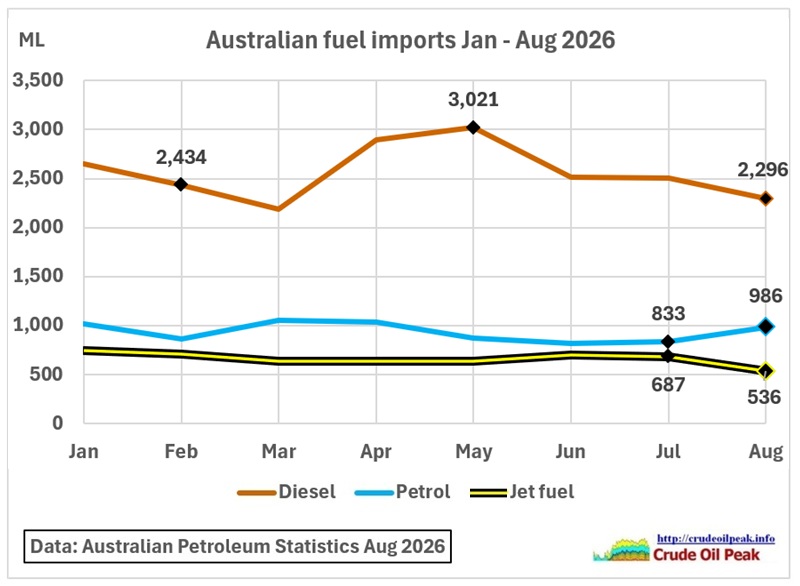 Fig 1: Fuel imports Jan – Aug 2026 (APS data)
Diesel imports dropped by 24% from 3,021 ML end May to 2,296 ML end August. Jet fuel imports came down by 22% while petrol imports went up 18% compared to July.
Diesel is of course very important and global supplies are under stress. The following graph showing lower global 2026 exports is from the IEA October monthly report
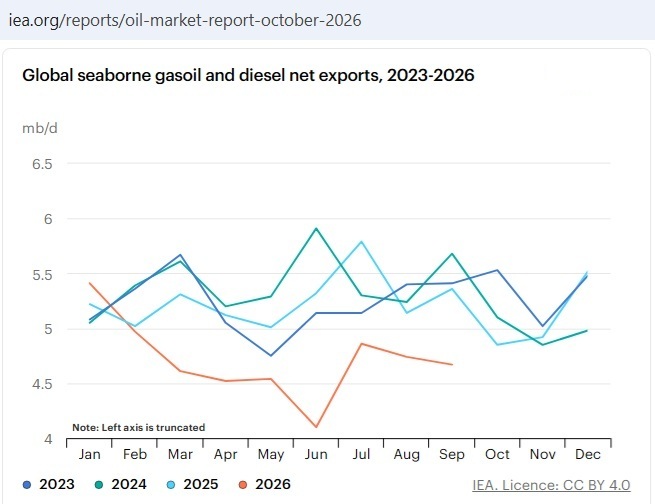 Fig 2: Global seaborne diesel net exports
“Reduced refinery output sharply lowered global gasoil exports to an average 4.7 mb/d over the first nine months of 2026, 10% below year-earlier levels. Preliminary trade data show flows falling to 4.7 mb/d in September, nearly 700 kb/d below a year ago. Combined net exports from the Middle East and Russia dropped by 1.3 mb/d to 820 kb/d in September, down more than 60% y-o-y. While the United States and China increased exports by 610 kb/d compared with year-earlier levels, volumes fell by 150 kb/d from their August peak, failing to offset the Middle East and Russia losses.”
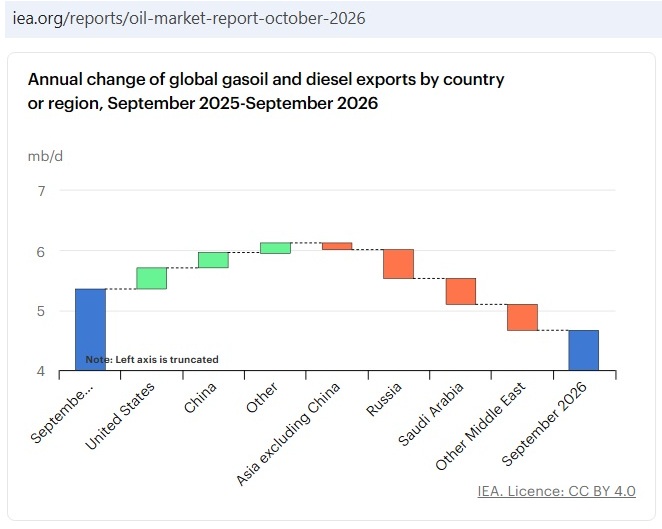 Fig 3: Diesel export balance Sept 2026
https://www.iea.org/reports/oil-market-report-october-2026
IEA: Russian refining sector struggles amid intensifying Ukrainian attacks
17 Sep 2026
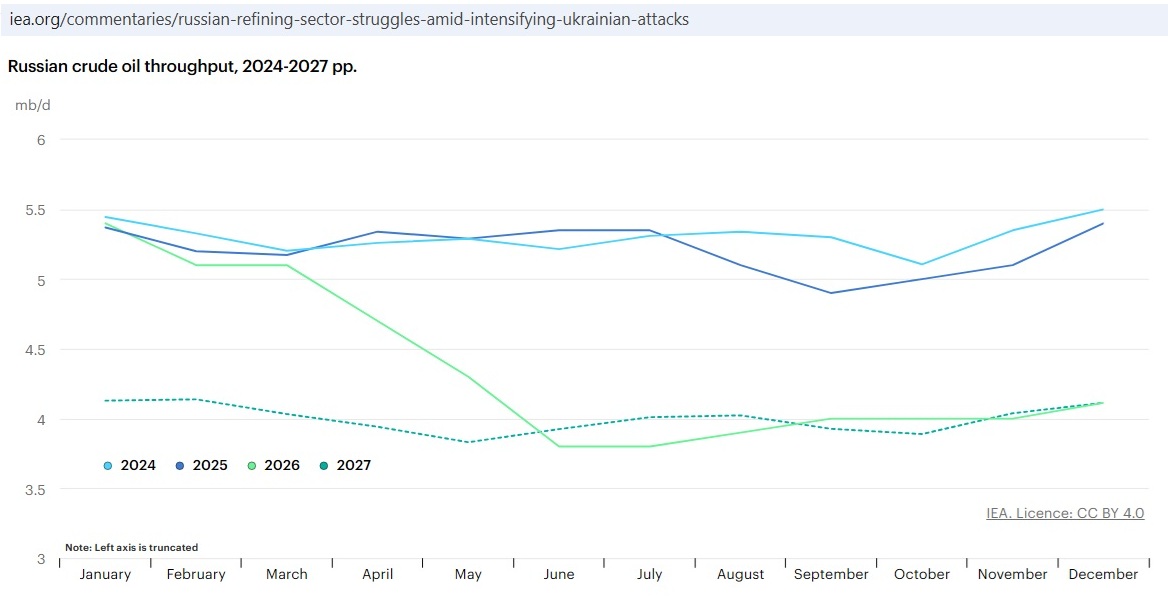 Fig 4: Russia refinery throughput down by more than 1 mb/d predicted even in 2027
Some refineries, particularly those closer to Ukraine, have now been attacked as many as 15 times since 2022, with significant damage reported to both primary and secondary crude oil processing units across the country. As of late August 2026, only five major Russian refineries remained untouched by Ukrainian drones. All are situated in eastern Siberia or the far east of the country, between around 3,500 and 6,500 kilometres from the Ukrainian border – currently beyond the reach of Ukraine’s most advanced long-range drones.
As Ukraine becomes more effective at striking Russian refineries, it is increasingly targeting specific refinery units in an effort to maximise the impact of each strike. In addition to attacks on crude distillation units (CDUs) – where crude is initially processed at a refinery – Ukraine looks to be targeting secondary units such as fluid catalytic crackers (FCCs), hydrocrackers, reformers and hydrotreaters. These units increase yields of lighter products such as gasoline, jet fuel and diesel – the latter two products are referred to as middle distillates – and improve their quality. Damage to these more complex units can lengthen the time needed for repairs and potentially require their replacement.
Minor damage to a CDU can typically be repaired within one or two weeks. However, repairs to more complex secondary units, particularly those that have suffered serious damage, can take six to eight months on average. The 250 kb/d Moscow refinery was so severely damaged during a Ukrainian attack on the capital in June 2026 that it is reported to be offline until early 2027
https://www.iea.org/commentaries/russian-refining-sector-struggles-amid-intensifying-ukrainian-attacks
Further reading:
Monthly analysis of Russian fossil fuel exports and sanctions
16 Oct 2026
https://energyandcleanair.org/september-2026-monthly-analysis-of-russian-fossil-fuel-exports-and-sanctions/
US-Russia Diesel Deal 2026: Can Russian Fuel Supplies Ease Global Price Pressures? Expert View by Spherical Insights
Oct 2026
The answer depends on how much fuel actually moves and how tight the market is.
First, scale. The announced volumes total about 4.8 million tons, or roughly 36 million barrels, which is less than eight days of global seaborne diesel trade based on IEA figures. The firm tranches through December total 1.8 million tons, about 13 million barrels.
Second, the shortage is in refining, not crude. The global fuels market has lost up to 6 to 8 million barrels per day of refining capacity since late spring because of Middle East outages, shipping constraints, damaged Russian refineries, and reduced Chinese refining. Analysts say sanctions relief on crude or asset sales would add little diesel.
Third, sentiment and signaling. A public commitment to release product can cool speculative buying and give traders a reason to expect more supply, even before volumes arrive. The G7 also agreed last week to release 100 million barrels of oil and diesel.
Finally, politics. Ukraine’s President Zelensky called sanctions relief without a lasting de-escalation agreement “an obvious weakness”, and an Atlantic Council analyst said the volumes are small, uncertain, and unable to solve the global shortage.
(2) Fuel sales
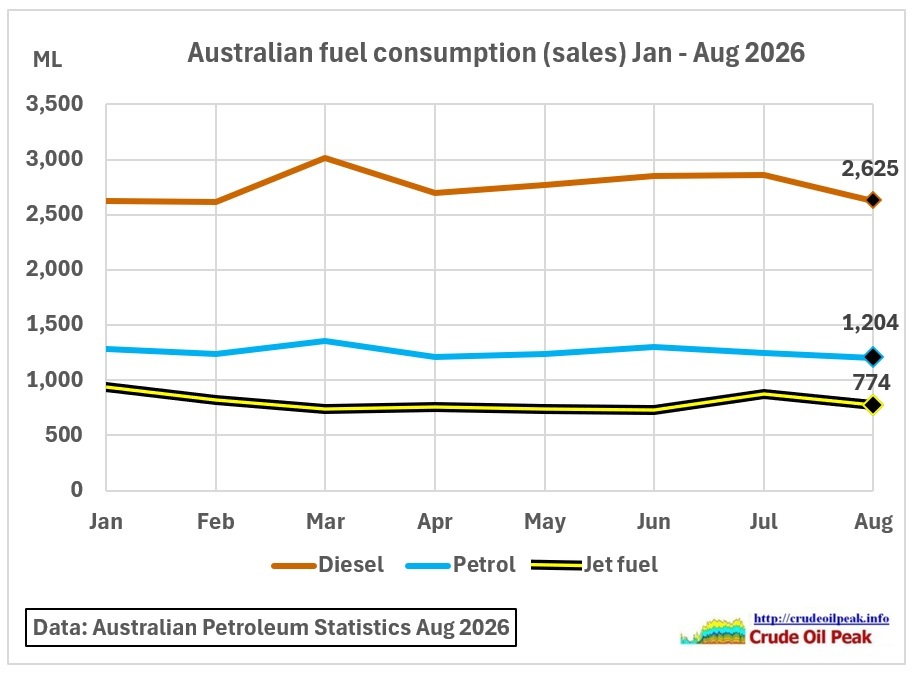 Fig 5: Fuel sales Jan – Aug 2026 (APS data)
Except for March, fuel sales (consumption) were comparatively steady, given the global crisis and high fuel prices. Business as usual, just as the Energy Minister “wants” it. Some say Diesel consumption is “sticky”. This all means that fuel prices must go much higher to induce behavioral change.
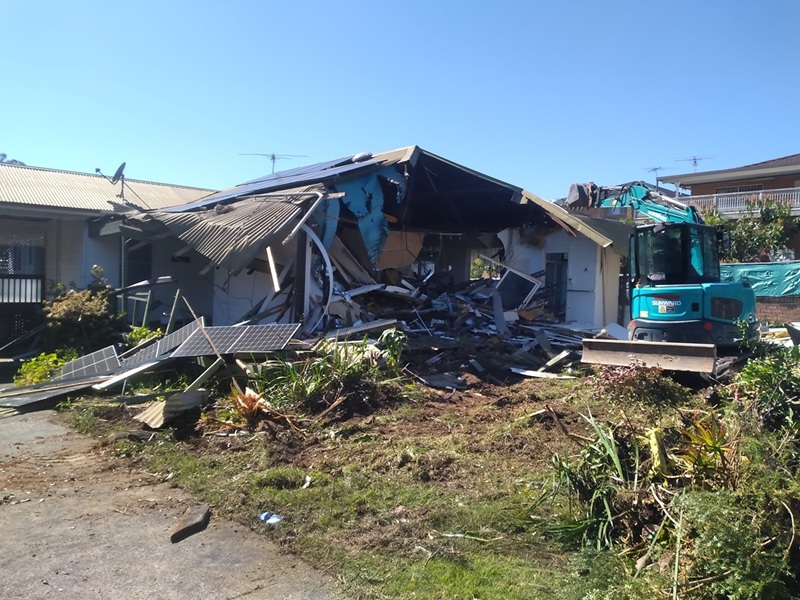 Demolition of “affordable housing” in Sydney
Diesel is obviously not expensive enough to stop diesel equipment and trucks from this wanton destruction of affordable housing in a Sydney suburb, caused by rich immigrants deliberately allowed to come to Australia to increase “prosperity” by replacing this house with an expensive luxurious duplex no Australian can afford.
Hello, Energy and Climate Change Minister. Why did your solar PV recycling pilot which started in April 2026 (why not earlier?) not reach this site in time?
https://www.dcceew.gov.au/environment/protection/waste/solar-panels
(3) Fuel stock
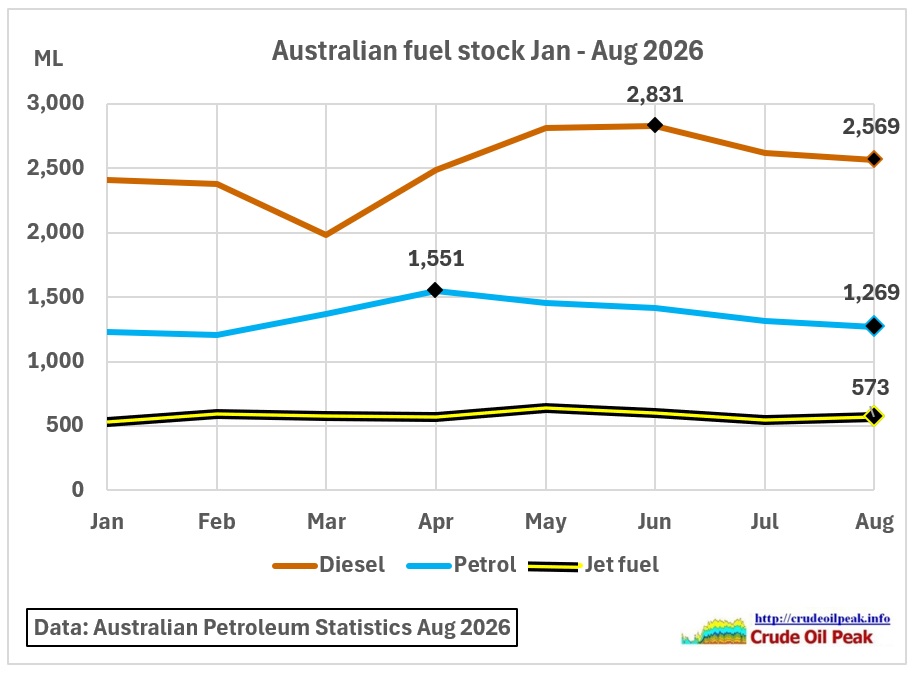 Fig 6: Fuel stock Jan – Aug 2026 (APS data)
Let’s compare the MSO stock data released by the Minister for Energy last Saturday, 17th Oct to the APS data:
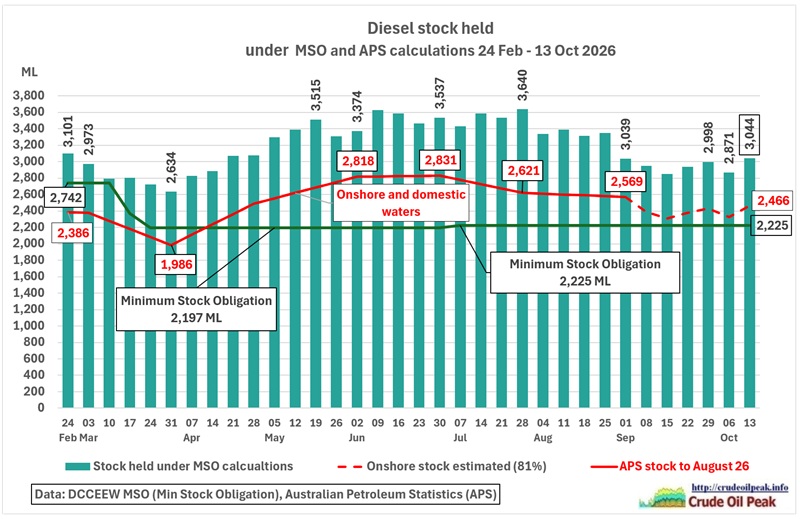 Fig 7: Diesel stock reported under MSO (green columns) and APS (red line)
Data from here: https://www.dcceew.gov.au/energy/security/australias-fuel-security/minimum-stockholding-obligation/statistics
The difference between 3,039 ML (MSO) and 2,569 ML (APS), around 18%, is offshore stock outside coastal waters (EEZ and beyond). The red dotted line – which is an estimate of the APS stock using the August data – comes close to the MSO level. So the battle is on the water.
Smoke on the water Deep Purple 1972
“Some stupid with a flare gun…”
“Fire in the sky”
https://www.youtube.com/watch?v=Rfirxs_NUcE
To be continued