10 June 2022 by Matt Mushalik (MEng)
These are typical headlines in the current situation:
Australians ‘panicking’ as power prices skyrocket, consumer advocates say
2 June 2022
https://www.abc.net.au/news/2022-06-08/energy-ministers-meet-to-discuss-rising-prices-gas-electricity/101133630
Short-term relief from rising gas and electricity prices is unlikely, with the nation’s energy ministers facing limited options to immediately curtail the spiralling costs
8 June 2022
https://www.abc.net.au/news/2022-06-08/energy-ministers-meet-to-discuss-rising-prices-gas-electricity/101133630
Let’s have a look at electricity demand, generation and whole-sale prices over a couple days, available on the AEMO dashboard. This analysis will give us an insight into the multiple problems which plague the system.
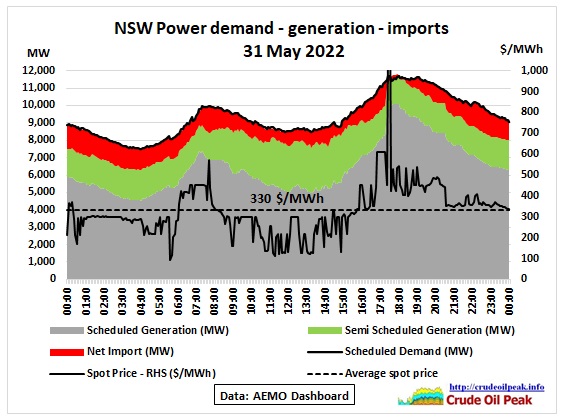 Fig 1: Demand and prices for 31 May 2022
Scheduled generation is mainly from coal, gas and hydro, while semi-scheduled generation is from wind and solar farms.
The exact definition of scheduled and semi-scheduled power generation is contained in the AEMO fact sheet “Visibility of the power system” (see Appendix)
There are 2 peaks: the morning and evening peak. The drop in grid demand after the morning peak is caused by solar rooftop installations (behind the meter, which AEMO cannot measure)
We can clearly see how prices go below the average (dotted line) when PV rooftop picks up during the day. This of course depends on the season. In Sydney, solar exposure in May 22 was 2.8 KWh/day compared with 6.1 KWh/day in January 22
http://www.bom.gov.au/climate/data/index.shtml?bookmark=193
There was increased cloud cover due to a double dip La Nina and also a negative Indian Ocean Dipole:
https://www.abc.net.au/news/2022-04-23/why-it-wont-stop-raining-la-nina-climate-driver/101008962
The price spike up to $1,300/MWh in the afternoon was caused by a sudden drop in imports at 17:20 from 1,346 MW to 419 MW in 5 min. These imports had been running at an average of 1,000 MW all day and were increasing at the time of the disruption. The high price lasted for only 10 min but it took more than 2 hrs until imports were back to 1,000 MW. There was a Lack of Reserve LOR1 warning for NSW (AEMO market notice 96689 31/5/2022 5:20:05 https://aemo.com.au/en/market-notices)
More details can be found in this article by Watt Clarity
Tight supply-demand, so price volatility, in NSW and QLD on Tuesday 31st May 2022
31/5/2022
https://wattclarity.com.au/articles/2022/05/31may-tight-supply-demand-so-price-volatility-in-nsw-and-qld/
 Fig 2: Demand and prices for 1 June 2022
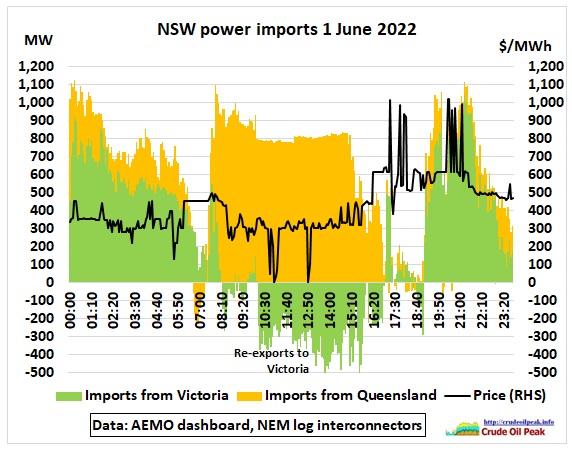 Fig 3: NSW power imports from Queensland and Victoria
Prices went up as imports from Queensland dropped in the afternoon (exported solar power)
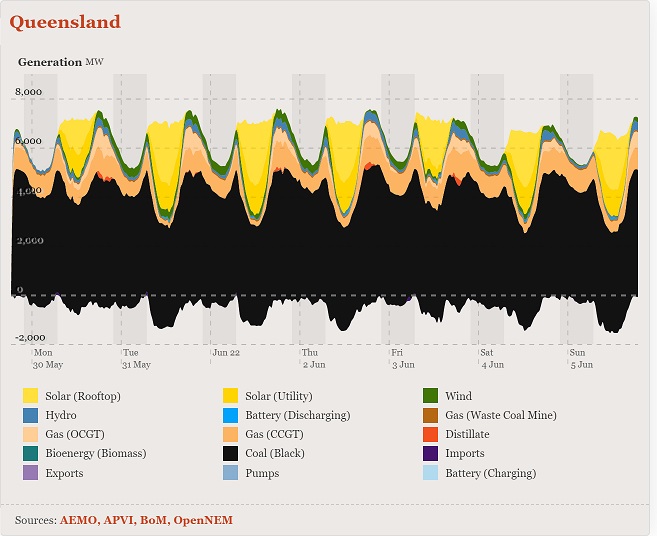 Fig 4: Queensland generation in the week 30 May – 5 Jun 2022
Generation in Queensland was so tight in the afternoon/evening that a distillate power plant had to be started:
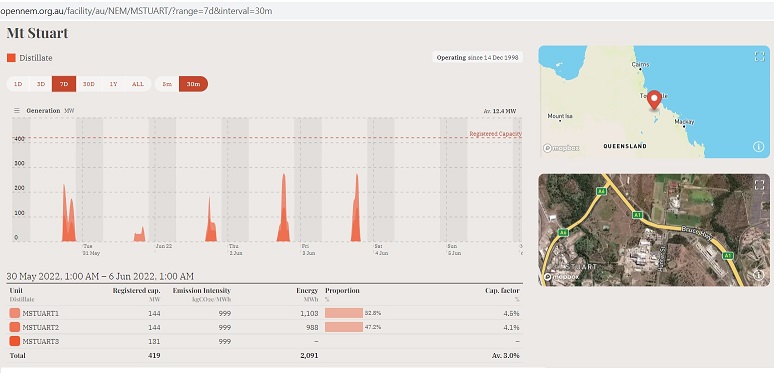 Fig 5: Mt Stuart power plant south of Townsville operating between 5 pm and 8 pm when needed
Mt Stuart uses an open-cycle gas turbine system in which the three turbines are fuelled by Extra Low Sulphur Diesel
https://www.originenergy.com.au/about/who-we-are/what-we-do/generation/
A detailed analysis can be found here:
NEM-wide IRPM drops below 15% on Wednesday 1st June 2022
1/6/2022
https://wattclarity.com.au/articles/2022/06/01june-irpm-14percent/
IRPM: Instantaneous Reserve Plant Margin
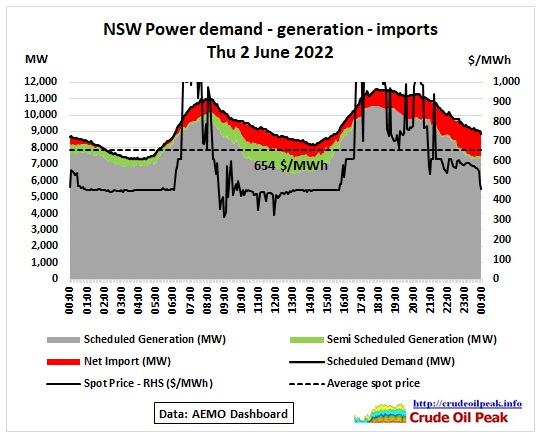 Fig 6: NSW demand and prices for 2 June 2022
An article from Watt Clarity sums up:
- Cold weather moving up to Queensland
- Fast ramping up of demand
- Lower wind output
- Callide B2 and Callide C4 (hydrogen explosion May 2021) offline
- 2 out of 6 units in Gladstone offline
- 1 of 2 units in Millmerran out
- In NSW 32% unavailability ratio
- In Victoria 23% unavailable
Morning price volatility on Thursday 2nd June 2022
2 Jun 2022
https://wattclarity.com.au/articles/2022/06/02june-morning-price-volatility/
• NEM market demand 30,412 MW against 33,570 MW available (IRPM 10.4%)
• NEM wind below 1,000 MW
Very tight supply-demand (NEM wide!) on Thursday 2nd June 2022
2 Jun 2022
https://wattclarity.com.au/articles/2022/06/02june-lowirpm/
Let’s have a look at wind:
 Fig 7: Actual wind supply versus average
In this particular instance, the storage requirement for a constant generation would have been 4,900 MWh for 1,258 MW provided. That is 4 MWh per 1 MW. The surplus of 4,100 MWh after 8 pm would not have been enough to replenish the storage.
 Fig 8: NSW demand and prices for 3 June 2022
The price spike pattern during demand ramp up periods established itself. Imports were at the highest level during the week, around 1,100 MW or 12% of demand. Without the price spikes the average price would go down from $564/MWh to $516/MWh (-9%)
Rooftop solar was the lowest during the week:
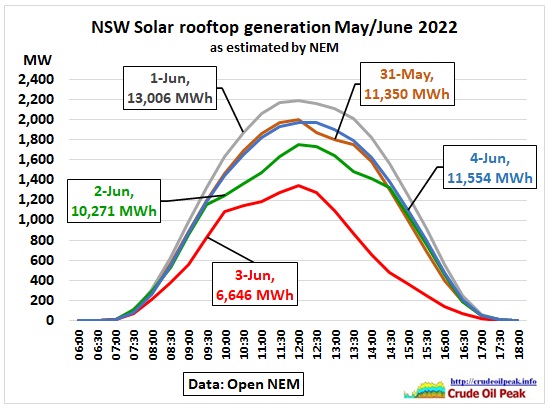 Fig 9: NSW rooftop solar behind the meter (reducing daytime demand)
There can be considerable variability from day to day (factor 2 possible). Due to lower sunshine it was cooler.
Watt Clarity wrote:
Demand is ramping up into the evening in all regions – but NSW is particularly worth noting, with ‘Market Demand’ at 11,697MW and out of the ‘green zone’ of the historical range compared to the 14,649MW all-time maximum at that measure.
https://wattclarity.com.au/articles/2022/06/03june-volatile-prices/
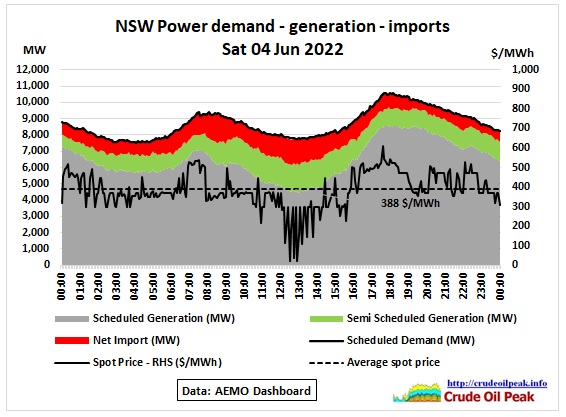 Fig 10: NSW demand and prices for 3 June 2022
A weekend. All quiet on the Eastern Front. Around $300/MWh seems to be the new norm.
Fig 11 and 12 show how prices have gone up within 1 year
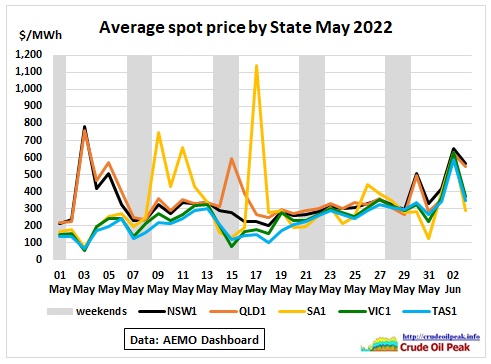 Fig 11: Spot prices May 2022
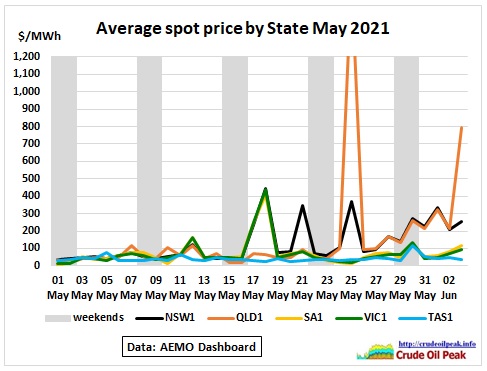 Fig 12: Spot prices May 2021 (hydrogen explosion C4)
The writing was on the wall:
14/6/2021
NSW power spot price spikes May 2021 become regular (part 2)
https://crudeoilpeak.info/nsw-power-spot-price-spikes-may-2021-become-regular-part-2
7/6/2021
NSW power spot price spikes May 2021 become regular (part 1)
https://crudeoilpeak.info/nsw-power-spot-price-spikes-may-2021-become-regular-part-1
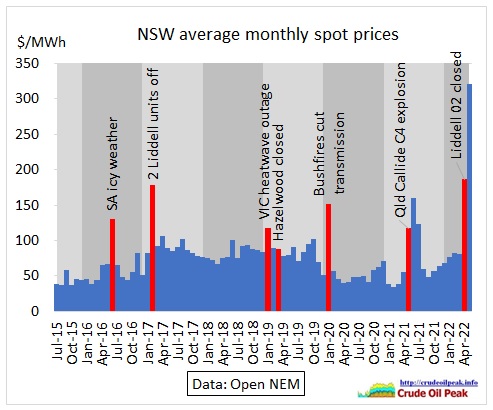 Fig 13: NSW spot price spikes (red) since 2015
The problem has evolved over many years but it was ignored.
21/1/2019
NSW power imports in January 2019 heatwave exceed 2 GW, drive up electricity prices
http://crudeoilpeak.info/nsw-power-imports-in-january-2019-heatwave-exceed-2-gw-drive-up-electricity-prices
10 Feb 2017
NSW running low on contingency reserves during hot days
http://crudeoilpeak.info/nsw-running-low-on-contingency-reserves-during-hot-days
Summary
NSW is utterly dependent on power imports from Queensland and Victoria. What was once an advantage has become a problem. Power supply issues in neighbouring States cascade through the whole East Coast as the system is stressed during simultaneous outages. This post also shows that the peakiness of demand has to be reduced. Planning legislation will have to include this as an objective.
Part 2 will look at aging coal fired power plants
Australia East Coast power crisis (part 2: NSW coal plants maxed out)
http://crudeoilpeak.info/australia-east-coast-power-crisis-part-2-nsw-coal-plants-maxed-out
Appendix (definition of 3 types of generation)
Scheduled generation
• A generating system with an aggregate nameplate capacity over 30 megawatts (MW) is usually classified as scheduled.
• Scheduled generation is currently predominantly made up of coal and gas-fired generation, and hydro.
• Scheduled generators offer their generation for dispatch.
• AEMO has ability to control this generation if required for system security.
• AEMO is informed of the technical properties of scheduled generation and receives real-time data
from the generators.
Semi-scheduled generation
• Since 2008, generating systems with intermittent output (such as wind or solar farms) and an aggregate name plate capacity of 30 MW, or more, are usually classified as semi-scheduled.
• AEMO forecasts wind and solar generation and includes this in the dispatch process.
• AEMO can constrain semi-scheduled generation down if required for system security reasons.
• AEMO is informed of the technical properties of semi-scheduled generation and some real-time data on performance.
Non-scheduled generation
• Non-scheduled generating systems generally have an aggregate capacity between 5–30 MW and do not participate in the central dispatch process. Most generation less than 5 MW is not required to register with AEMO and is generally considered as part of the demand side.
• AEMO forecasts non-scheduled generation to determine what remaining demand needs to be
met by scheduled and semi-scheduled generation.
• Through the registration process, AEMO has some information of its electrical properties but may not have information about real-time output
https://aemo.com.au/Electricity/National-Electricity-Market-NEM/Security-and-reliability/-/media/0DE87F5ADD5D42F7B225D7D0799568A8.ashx