This is because after the closure of 3 oil refineries in Sydney and Brisbane fuel imports have skyrocketed and these additional imports come from and pass through an area where there are high tensions now: the South China Sea and Korea.
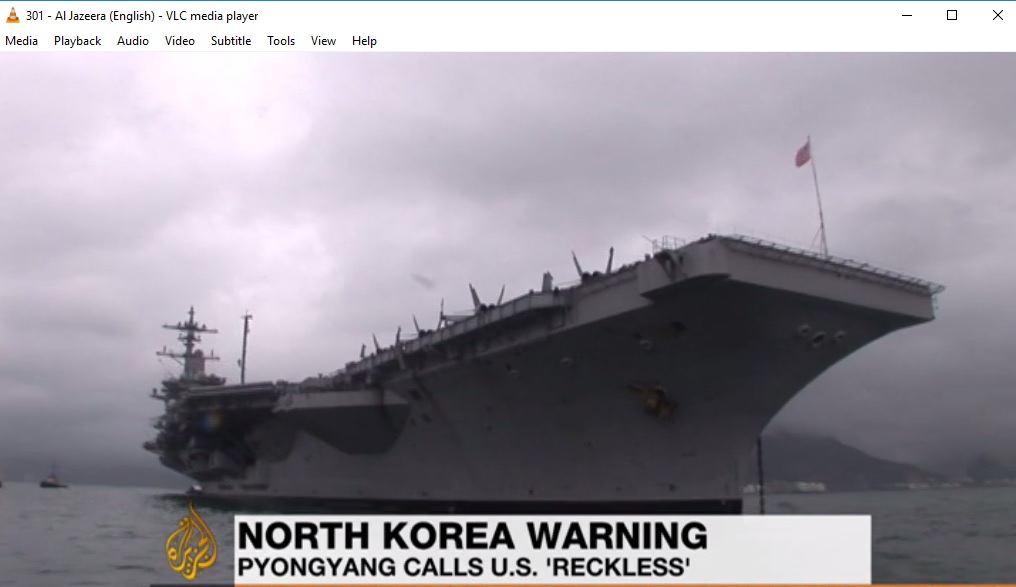
Fig 1: USS Carl Vinson
10/4/2017 A US Navy strike group including a nuclear-powered aircraft carrier has moved into a strategic position in the Western Pacific Ocean, just off the Korean peninsula.
http://www.abc.net.au/pm/content/2016/s4651328.htm
Apr 13 2017 U.S. May Launch Strike If North Korea Reaches For Nuclear Trigger
http://www.nbcnews.com/news/world/u-s-may-launch-strike-if-north-korea-reaches-nuclear-n746366
Asian oil supply context
This comes at a time when Asian oil production is on an oil production plateau for 5 years now while oil demand seems to increase forever.
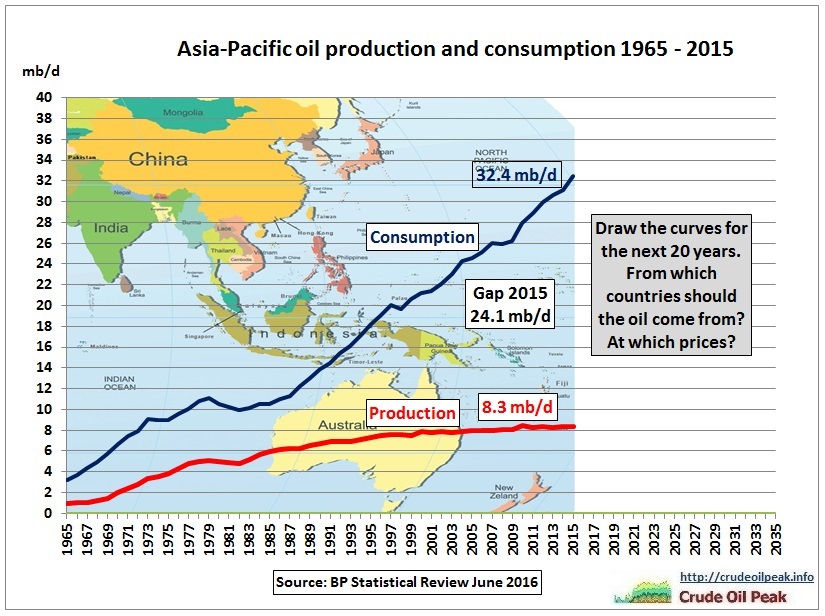
Fig 2: Asia’s oil consumption growth is unsustainable
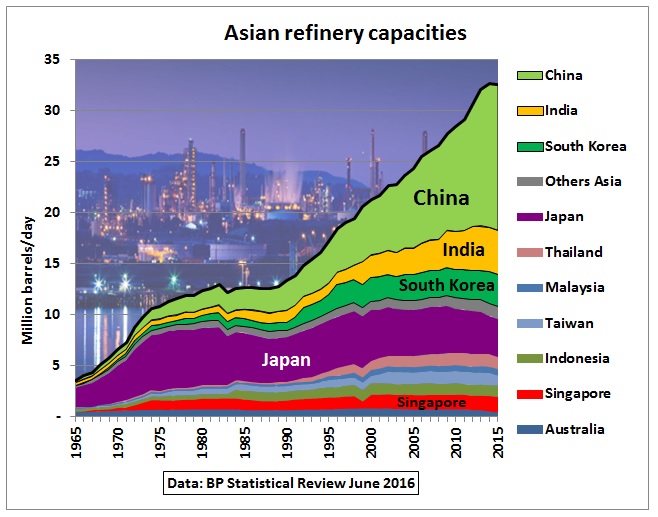
Fig 3: Stellar growth in Asian refinery capacities
Note that growth in the last 15 years has come only from 3 countries: China, India and South Korea. Singapore’s refining capacity and that of Indonesia, Malaysia, Thailand and Taiwan is basically flat. Japan’s capacity is in decline.
Most of Asia’s oil imports come from the Middle East as this tanker map shows:
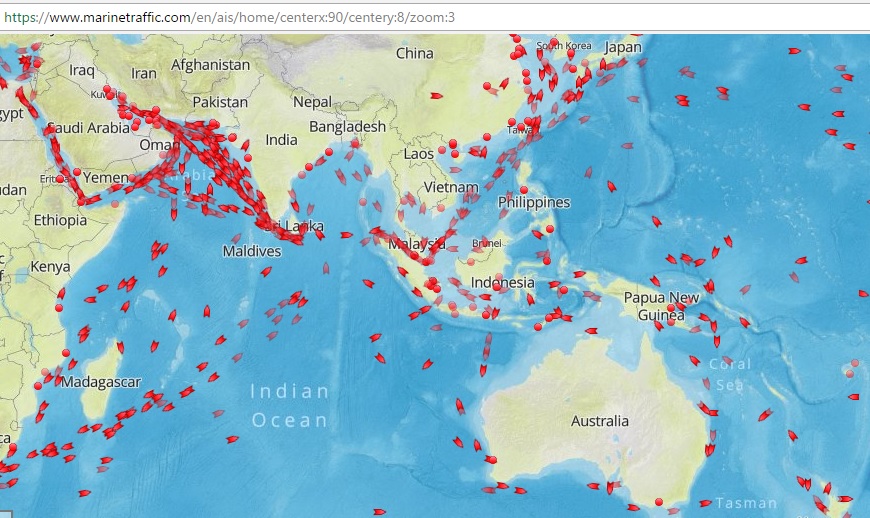
Fig 4: Tanker traffic between the Middle East and Asia
https://www.marinetraffic.com/en/ais/home/centerx:119/centery:-2/zoom:3
Australia net oil importer
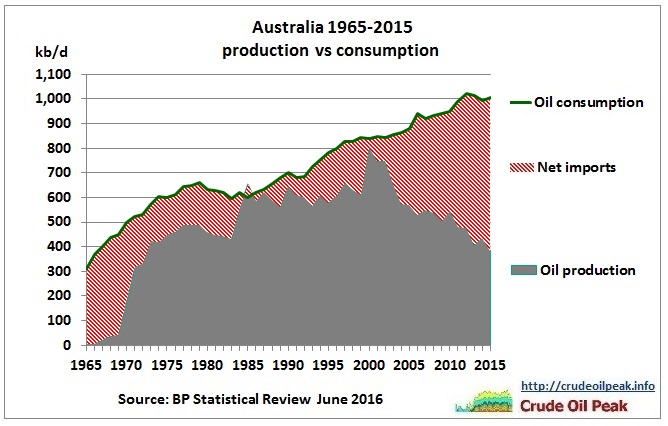 Fig 5: Australian oil balance
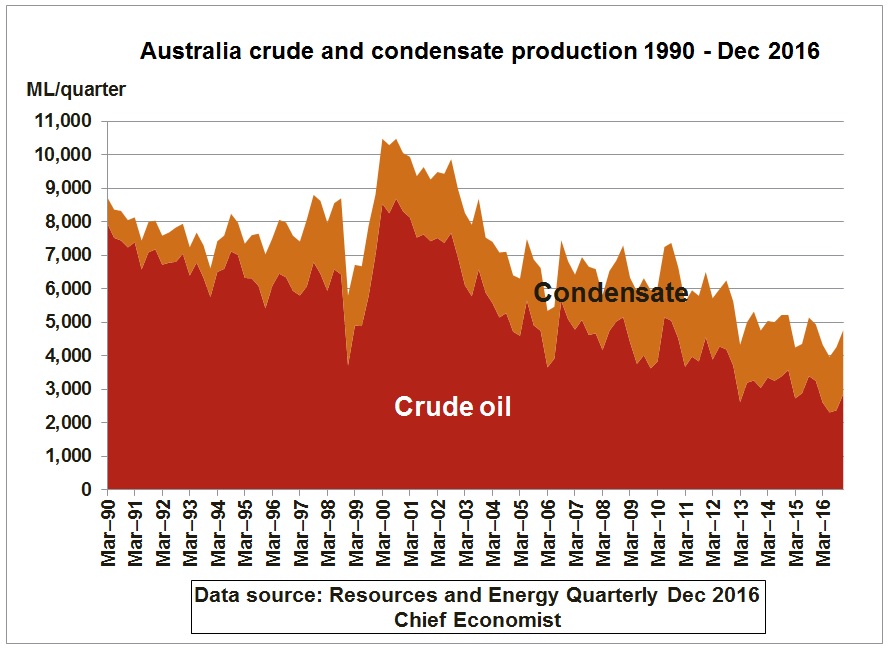
Fig 6: Australian oil production decline
Australian crude oil imports
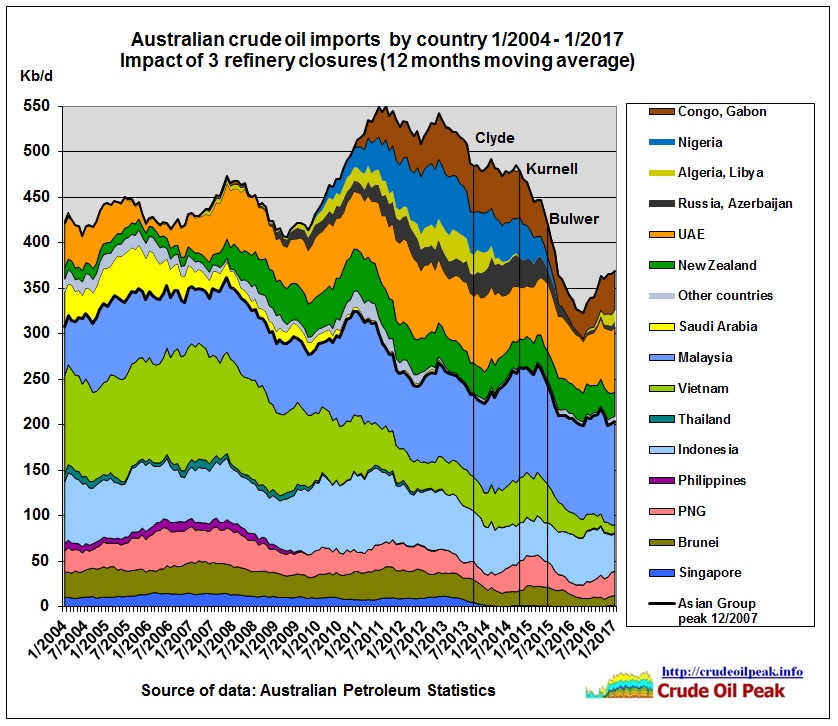
Fig 7: Australian crude oil imports
Fig 7 shows:
- Crude imports from neighbouring Asian countries peaked 12/2007
- Imports from Vietnam declined dramatically to 2% of imports because Vietnam’s crude production peaked in 2004-05
- UAE is the only long-term supplier from Middle East (19% of imports)
- Decline from Asia was compensated by imports from West Africa – good job
- Crude imports declined from 550 kb/d to around 350 kb/d as Australian refineries closed
- Before the refinery closures the diversity of crude imports was quite high and – given Australia’s remoteness on the global oil trade map – these refineries did a good job in sourcing crude oil from far away like Russia, Azerbaijan, the Mediterranean and West Africa
But as refineries were turned into fuel import terminals
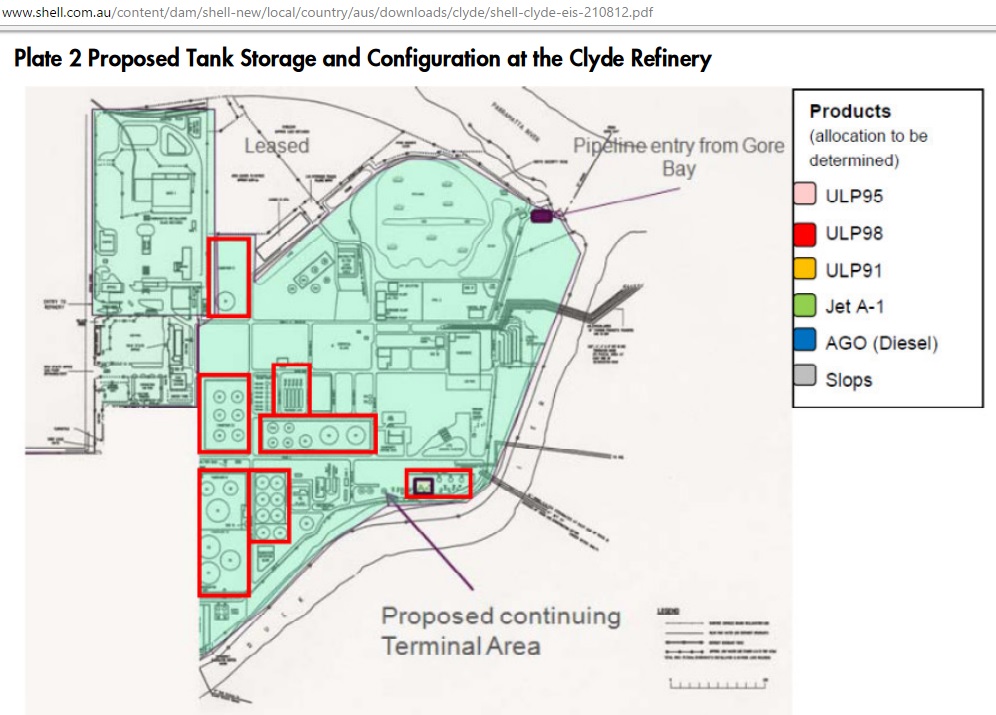 Fig 8: Shell’s fuel depot in Clyde, Sydney
fuel imports soared.
Australian fuel imports
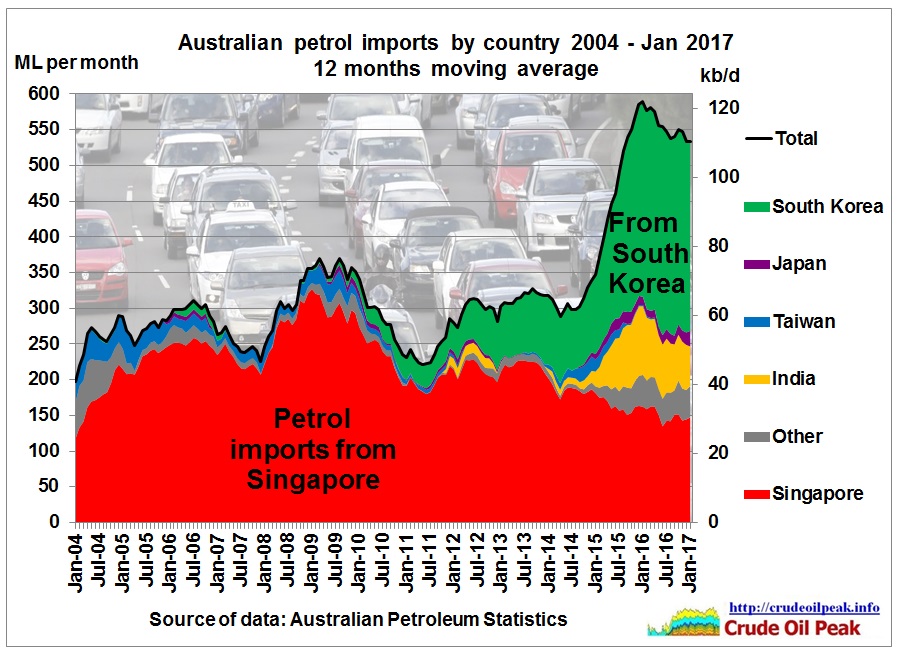 Fig 9: Australia’s petrol imports by country
Petrol imports from Singapore declined and were replaced by India. Petrol which was produced by Australian refineries now comes from South Korea.
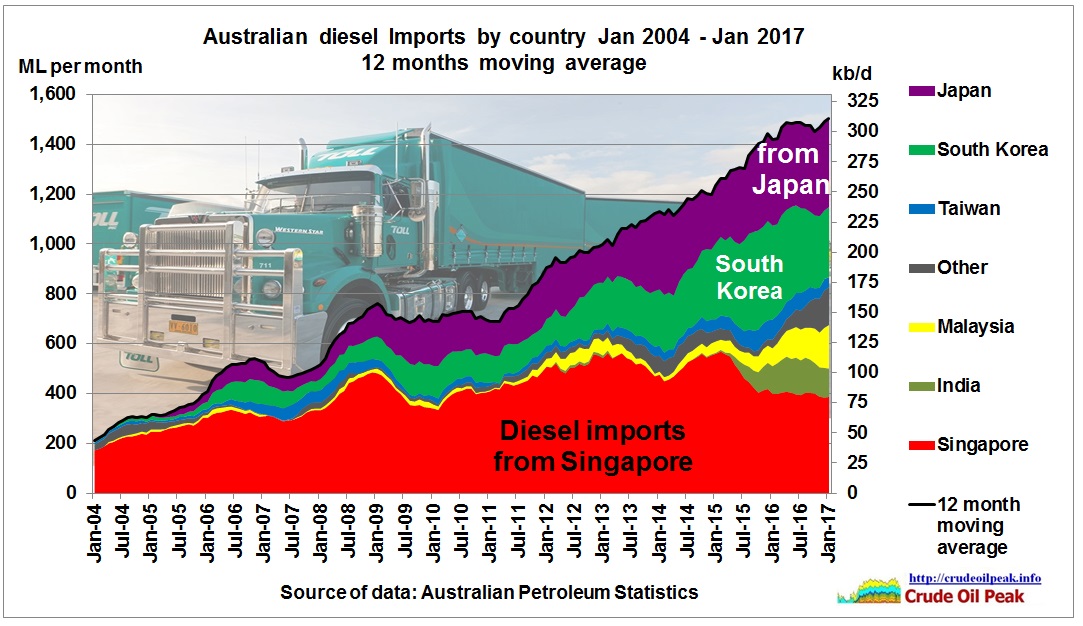
Fig 10: Australia’s diesel imports
After the financial crisis diesel imports took off – to fuel Australia’s mining boom. Additional diesel imports after the refinery closures mainly come from South Korea and Japan.
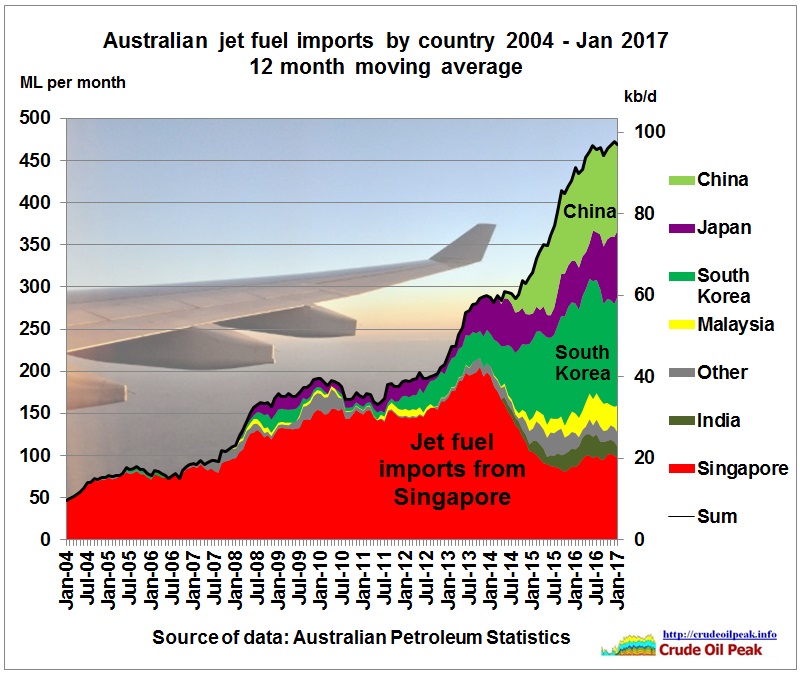
Fig 11: Australia’s jet fuel imports
Jet fuel imports also depend on South Korea and Japan, but surprisingly also from China.
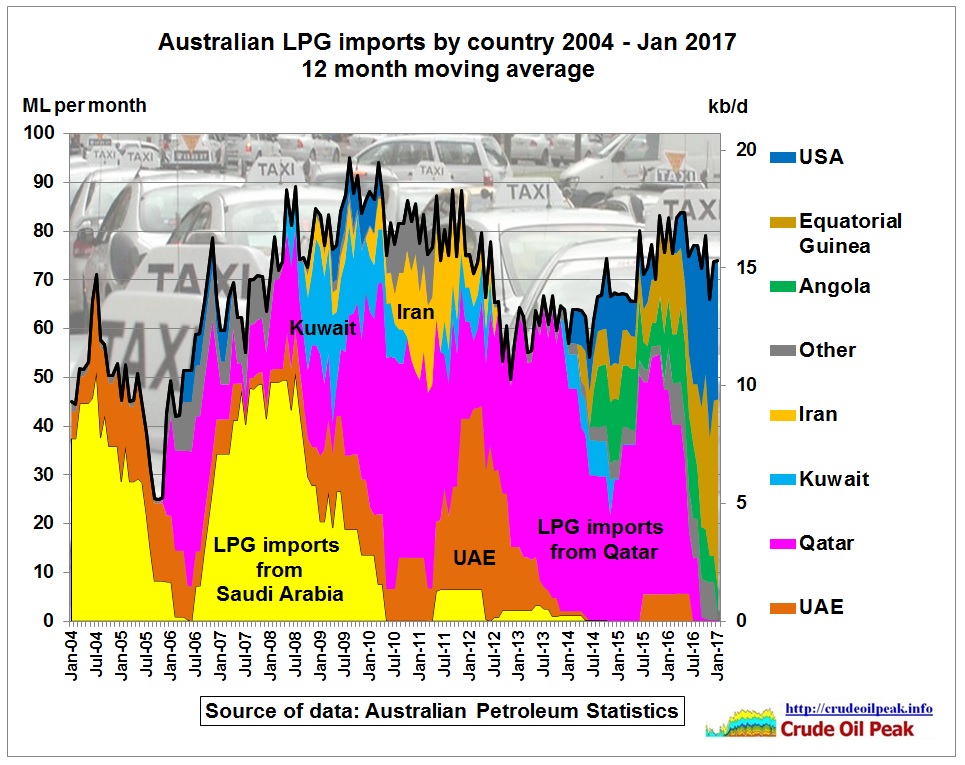
Fig 12: Australia’s LPG imports
Despite having naturally occurring LPG in gas fields, Australia is also importing LPG. This has been diversified away from the Middle East.
The above graphs show Australia’s external crude oil and fuel supply vulnerability. But how about the internal vulnerability?
Is Australia reducing its oil vulnerability? No
In Sydney, for example, travel behaviour has hardly changed in 10 years. The following graph is from the latest household travel survey:
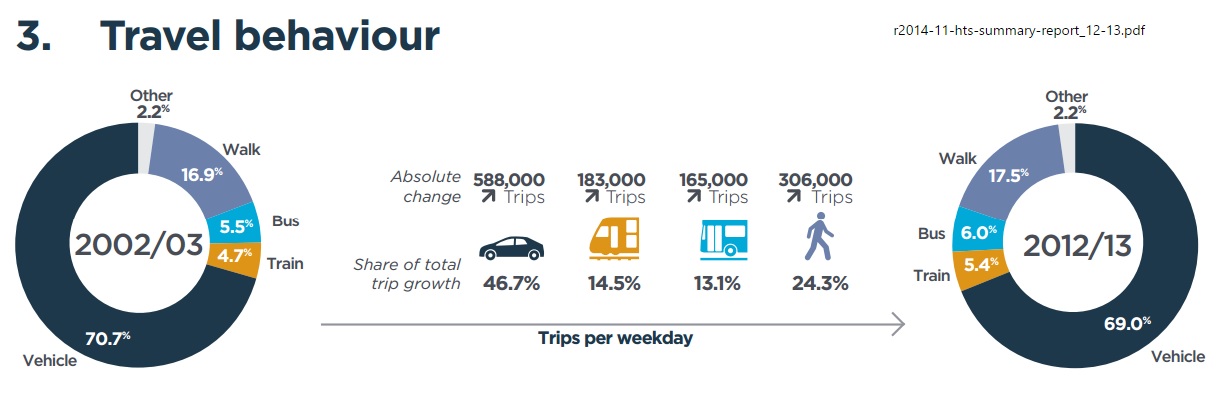
Fig 13: Modal split in Sydney (by number of daily trips)
http://www.bts.nsw.gov.au/Statistics/Household-Travel-Survey/default.aspx#top
In terms of distance – which is the energy related indicator – vehicle kms increased by 10.2% over 10 years.
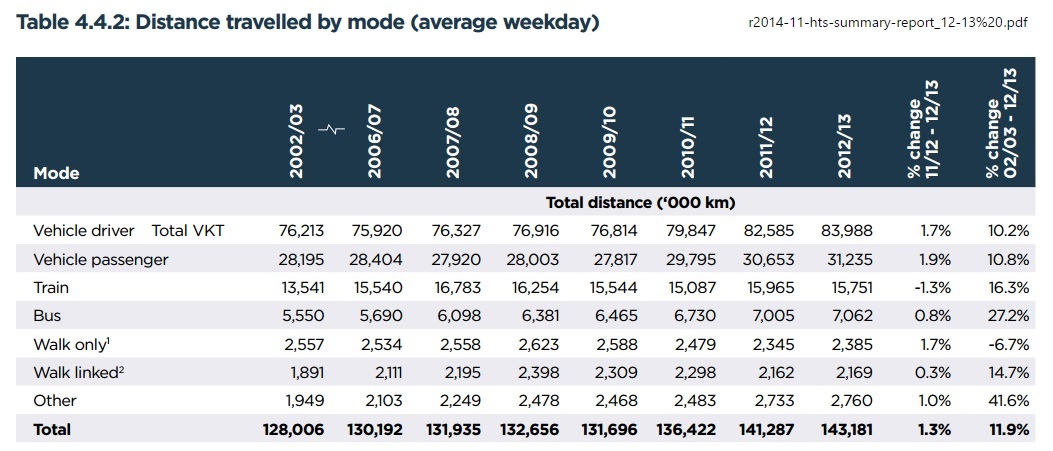
Fig 14: Sydney’s distances travelled by mode
Of course fuel rationing is one response to an oil crisis. Another is mandatory car pooling. The table in Fig 14 is good for estimating how much can/should be done depending on how much must be saved. Let us assume that the mode “vehicle passenger” means only one additional passenger, then 83-31 = 52 million kms would be from vehicles with just the driver. Let us also assume that only half of these drivers will be able to organise other drivers to leave their car at home then this would save 26 million kms, more than trains and buses together.
In another scenario let us assume that just 10% of the drivers only would switch to public transport, that would be 5.2 million kms or 23% of what trains and buses achieve now. Whether any such sudden increase could be accommodated in transport corridors which are already above capacity during peak hrs is a big question. The reader may want to consider any other saving scenario.
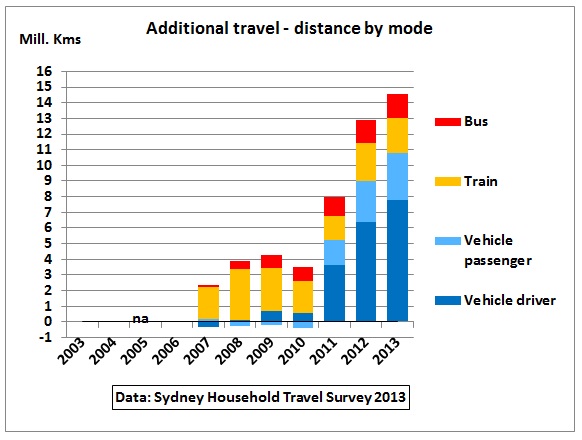
Fig 15: After the GFC vehicle kms grew more than public transport
This graph shows the changes in travel behaviour between 2003 and 2013, based on the numbers in Fig 14. Vehicle kms increased in the period 2011-2013. This is astonishing as petrol prices were very high in this period. Sydney definitely goes in the wrong direction.
Population increased by 12.9 %, mainly from immigration. Sydney burdens itself with the unnecessary job to house these immigrants and provide energy consuming transport infrastructure for them.
In line with Fig 15 Sydney is busy with continuing an ambitious toll-way program
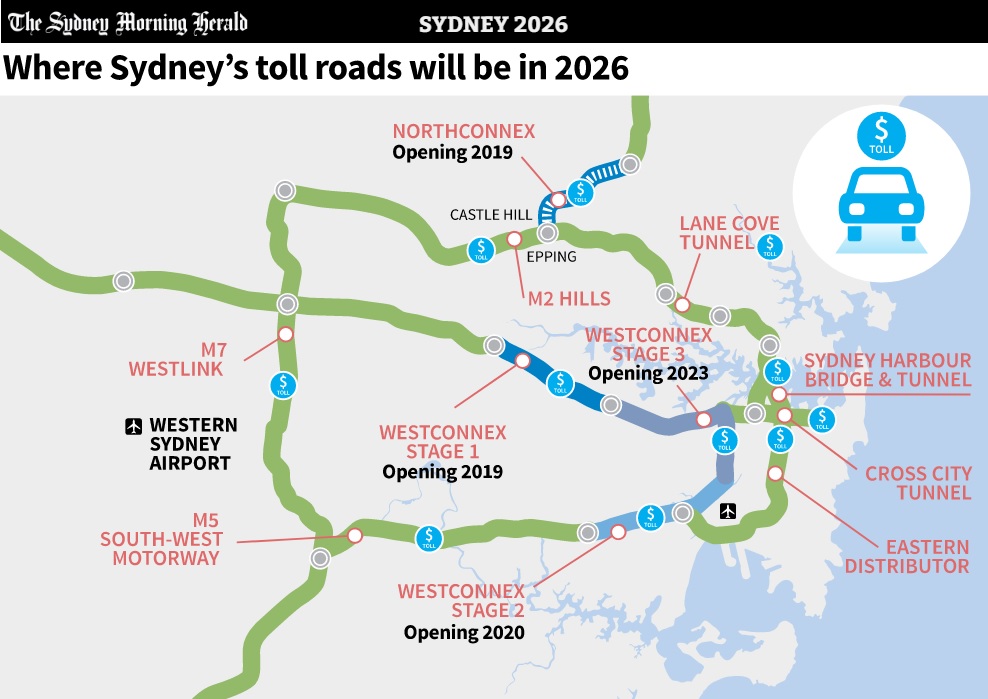
Fig 16: Tollopoly in Sydney
http://www.smh.com.au/interactive/2016/sydney2026/chapter1.html
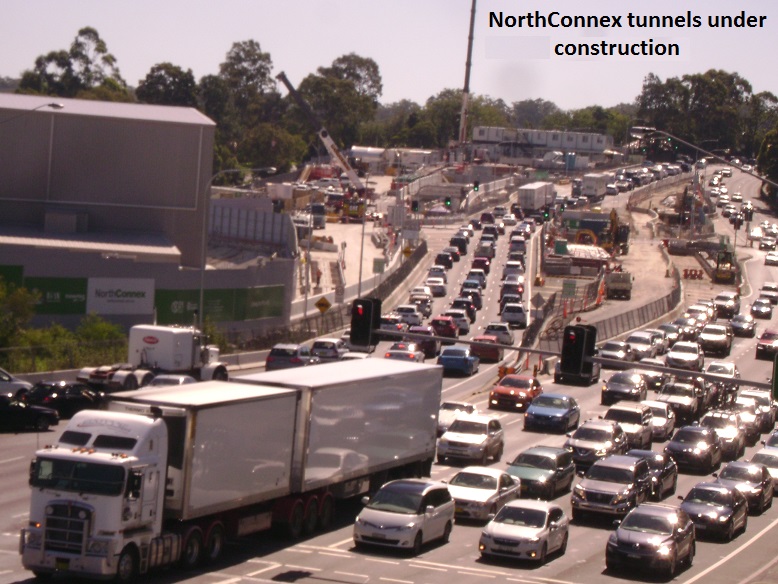
Fig 17: NorthConnex interchange with M2 under construction
When there are diesel shortages this may become a mushroom candidate
The main operator of Sydney’s toll-ways is Transurban
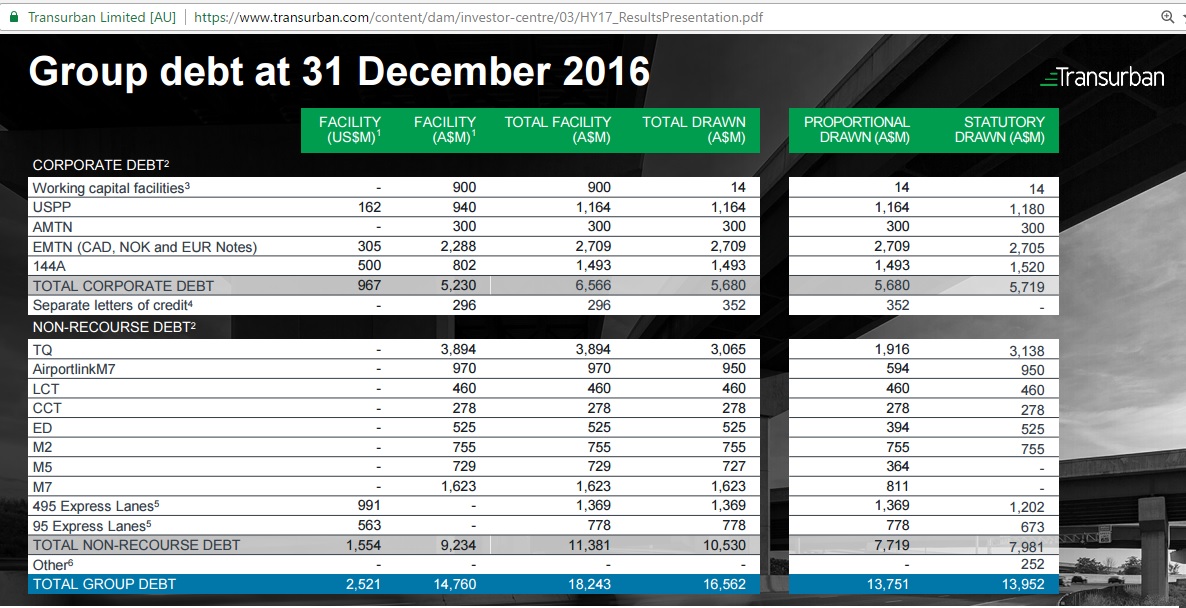 Fig 18: Too big to fail
I told you so
13/4/2011
Australia’s fuel import vulnerability increases as Sydney’s Clyde refinery is closing
http://crudeoilpeak.info/australias-fuel-import-vulnerability-increases-as-sydneys-clyde-refinery-is-closing
9/4/2014
Why the closure of BP’s Brisbane Bulwer refinery reduces Australia’s energy security
http://crudeoilpeak.info/why-the-closure-of-bps-brisbane-bulwer-refinery-reduces-australias-energy-security
17/10/2014
Sydney’s Caltex refinery closed as Chevron’s crude production and sales continue to decline
http://crudeoilpeak.info/sydneys-caltex-refinery-closed-as-chevrons-crude-production-and-sales-continue-to-decline
Transport Energy Resilience Senate Inquiry 9/4/2015 in Melbourne Parliament House
http://www.aph.gov.au/Parliamentary_Business/Committees/Senate/Rural_and_Regional_Affairs_and_Transport/Transport_energy_resilience/Public_Hearings
Submission #39
http://www.aph.gov.au/Parliamentary_Business/Committees/Senate/Rural_and_Regional_Affairs_and_Transport/Transport_energy_resilience/Submissions