Just a week before a Federal election was called the Australian Minister for Energy, Angus Taylor, released an interim report on fuel security on 4th April 2019 for public consultation (hereinafter called “Review”). The announcement of the report release was done without great fanfare, possibly with the intention not to enter a heated election debate.
http://www.environment.gov.au/minister/taylor/media-releases/mr20190404.html
This report was initiated by the previous Prime Minister Malcolm Turnbull in May 2018
https://www.abc.net.au/news/2018-05-07/australia-has-limited-emergency-fuel-stocks-left/9734164
The last report (National Energy Security Assessment 2011) was done by the previous government (Resource Minister Martin Ferguson) in December 2011
https://www.energy.gov.au/sites/default/files/national-energy-security-assessment-2011_0.pdf
What has changed since then?
In the 1st part of this article we look at Australian graphs. The Review doesn’t show these details.
Australian oil production has further declined, 3 refineries have closed, oil and fuel stocks have dropped by 45% and fuel imports from Asia have surged. China’s oil production peaked in 2015, oil imports doubled and the South China Sea has been militarized to secure oil supply routes. Oil prices went through a roller coaster from $110 in 2011 to $30 in Jan 2016 and back up to $70 now. It seems surging US shale oil production can’t keep prices constant at reasonable levels. The media hype about the US being a swing producer isn’t justified.
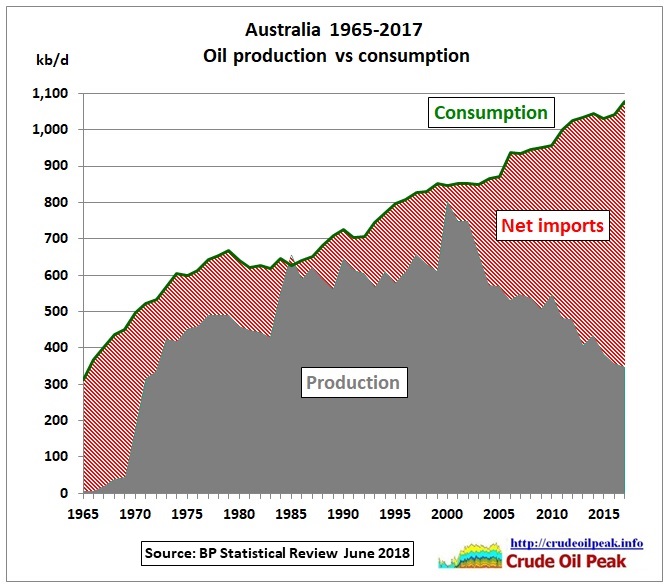
Fig 1: Australia in peak oil mode since 2000
Of course, the government doesn’t like the word “peak oil”. To be fair, the Review mentions that Australia’s oil production is in decline while consumption has increased (p 26). The following graph shows monthly production:
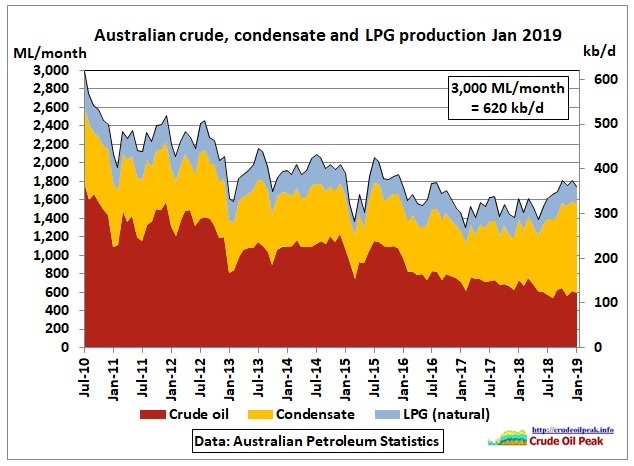 Fig 2: Crude oil, condensate and LPG production
The uptick in condensate production is a result of increasing offshore gas production. Note that condensate and LPG have lower energy content per barrel.
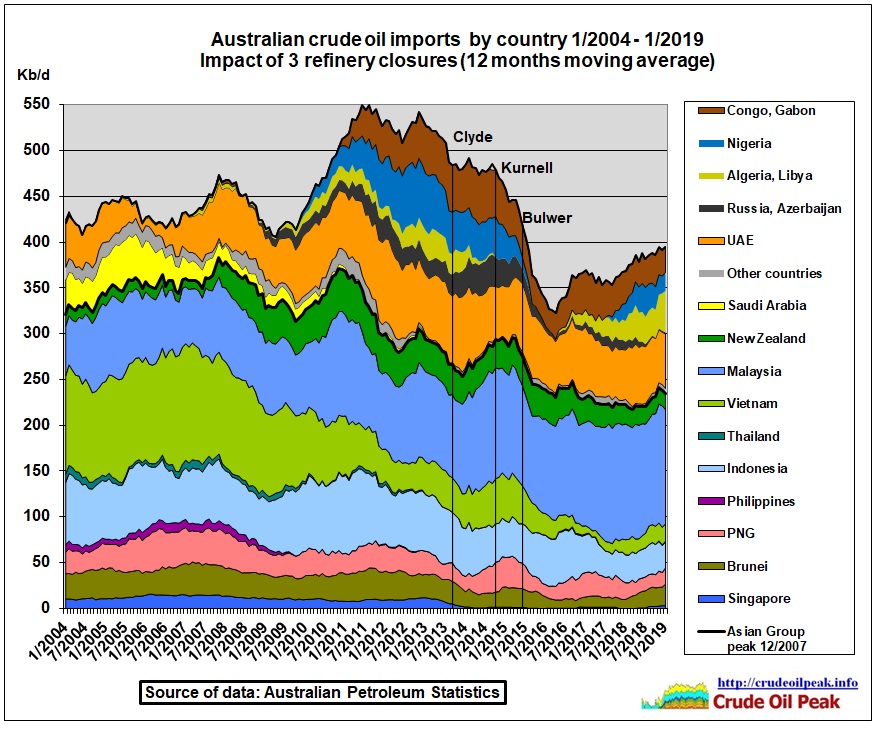 Fig 3: Crude oil imports by origin. 15% are from the Persian Gulf (UAE)
Crude imports from South East Asia peaked in 2007 at 380 kb/d. A secondary, lower peak occurred in 2010 at 370 kb/d. That was 7-10 years after the production peak (see Fig 4). The response of the refinery system to the Asian decline was to diversify into supplies from Africa (Fig 4). It seems this was too hard and 3 refineries closed. The diversity index slumped. In 2007, 80% of crude imports came from South East Asian countries, in 2018 only 60%. This means that supply chains have become longer.
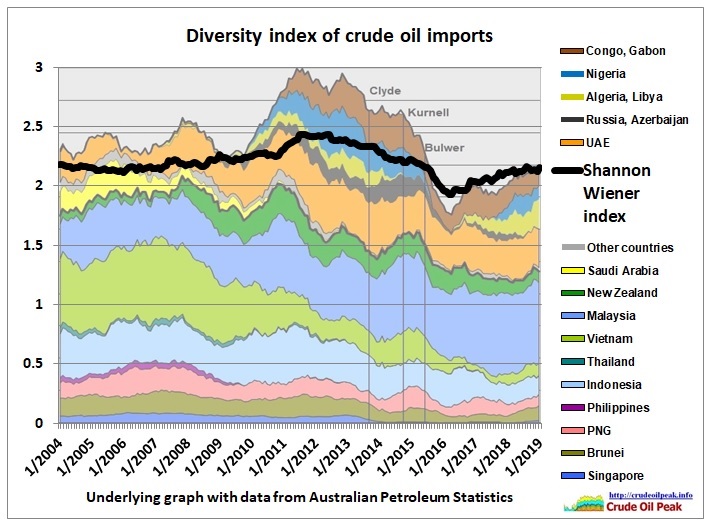 Fig 4: Diversity index of Australian crude oil imports
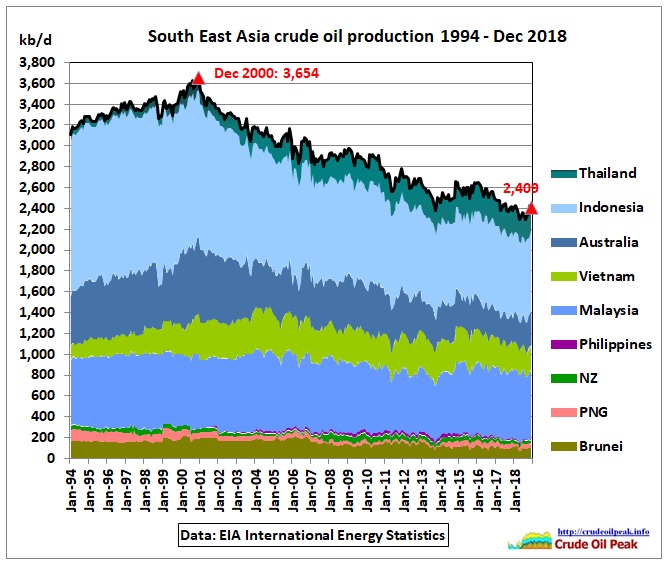 Fig 5: South East Asian crude production
What we see in Fig 5 is peak oil in South East Asia. The decline rate was 1.9% pa (Australia: 3.3%). The decline is dominated by Indonesia which is already a net importer since 2003
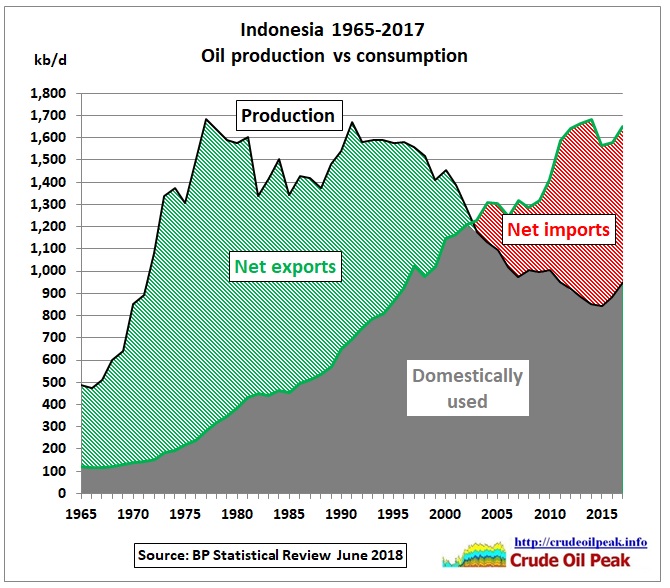 Fig 6: Indonesia oil production and consumption
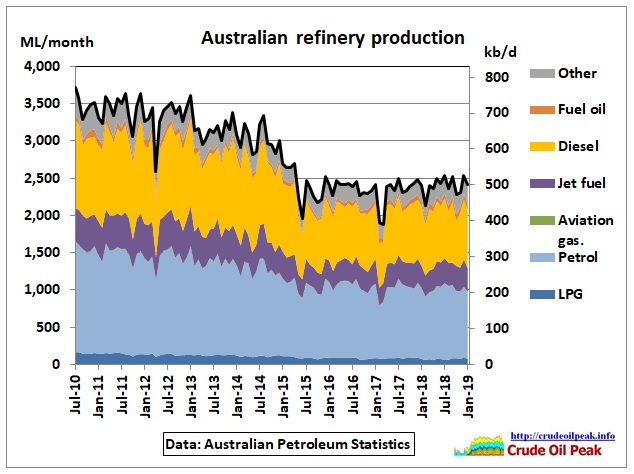 Fig 7: Australian refinery production
As 3 refineries were closed, total refinery output went down.
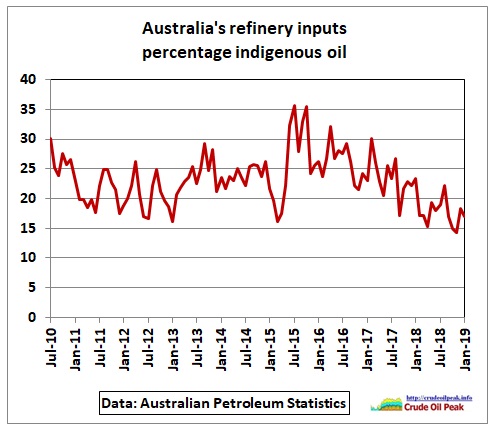 Fig 8: Australia’s use of indigenous oil
In the last 4 years, Australian refineries have reduced the use of Australian oil from a maximum of 35% to a minimum of 15%.
The import of fuels has surged:
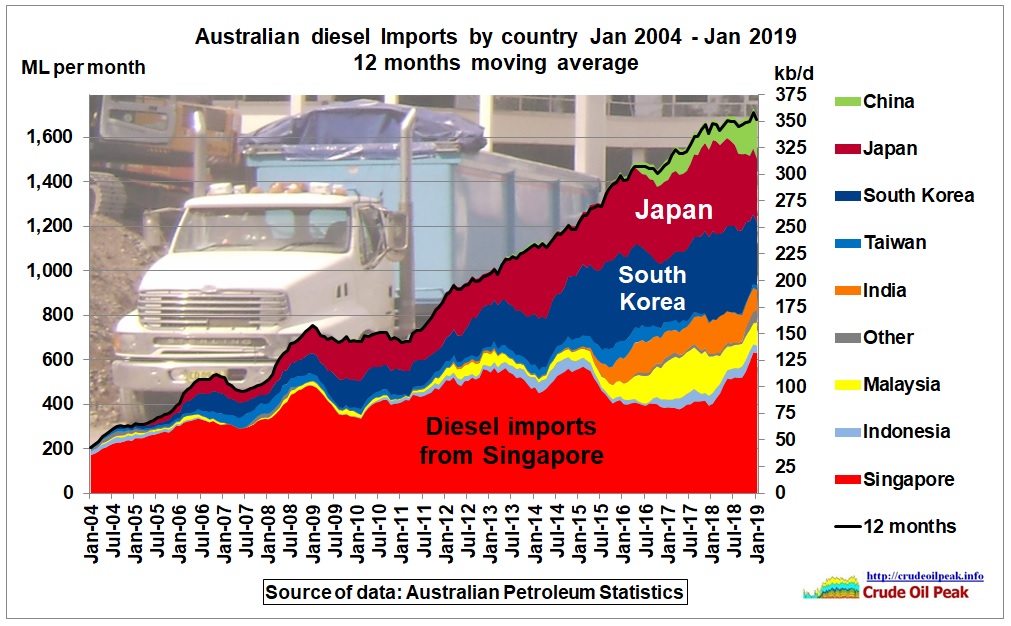 Fig 9: Diesel imports
After the 3 refinery closures, diesel imports increased from Japan and South Korea, recently also from Malaysian, India and China
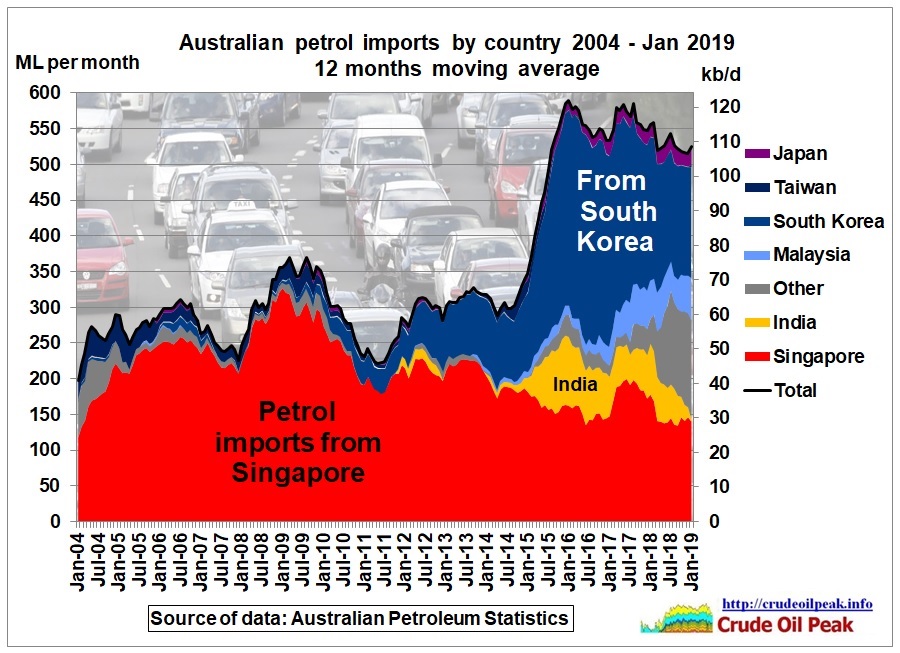 Fig 10: Petrol imports
Petrol imports are dominated by South Korea. Recently, imports have also come from UK and Netherlands.
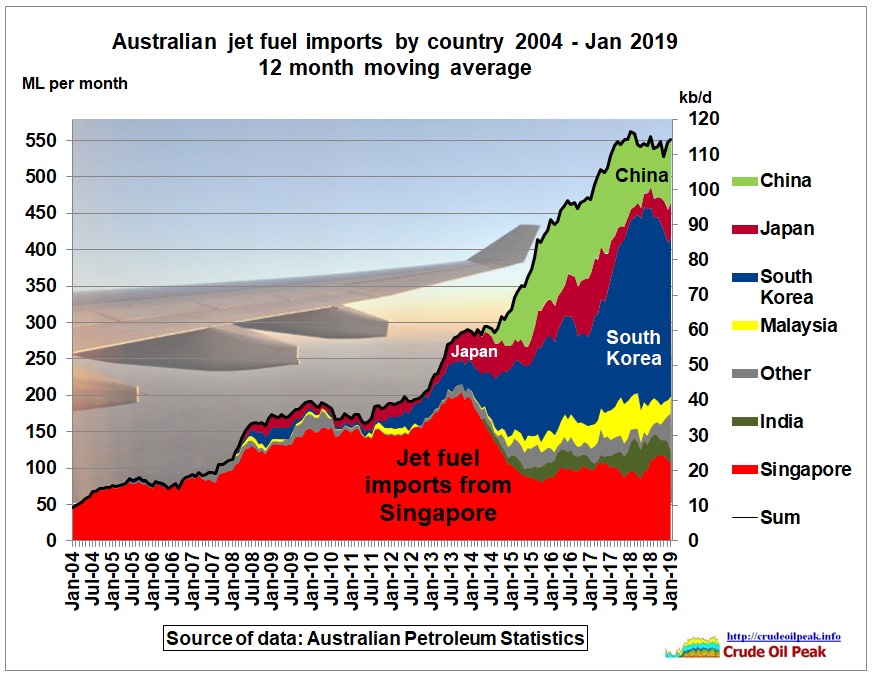 Fig 11: Turbine fuel imports
Jet fuel imports are also dominated by South Korea and China.
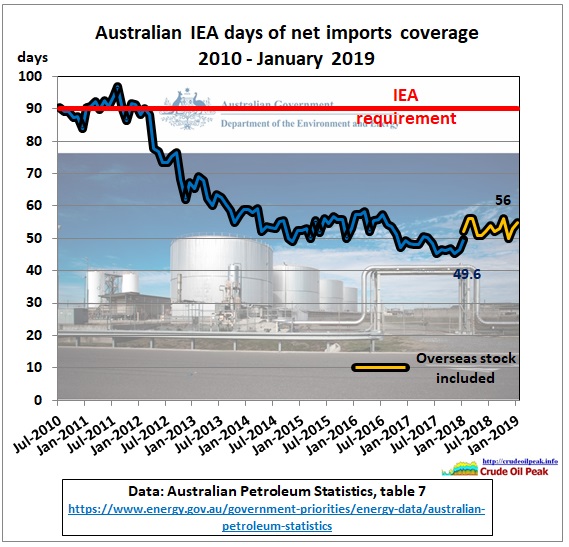 Fig 12: Australia’s net imports coverage (IEA requirement 90 days)
The coverage dropped sharply in mid 2012, ahead of the closure of Clyde. Australia is dragging its feet to get back to compliance levels. The latest trick is to include overseas stock held under ticket contracts. In an emergency that is not very useful, especially when you are far off main oil supply lines. The following IEA table compares Australia’s poor rating with its neighbours:
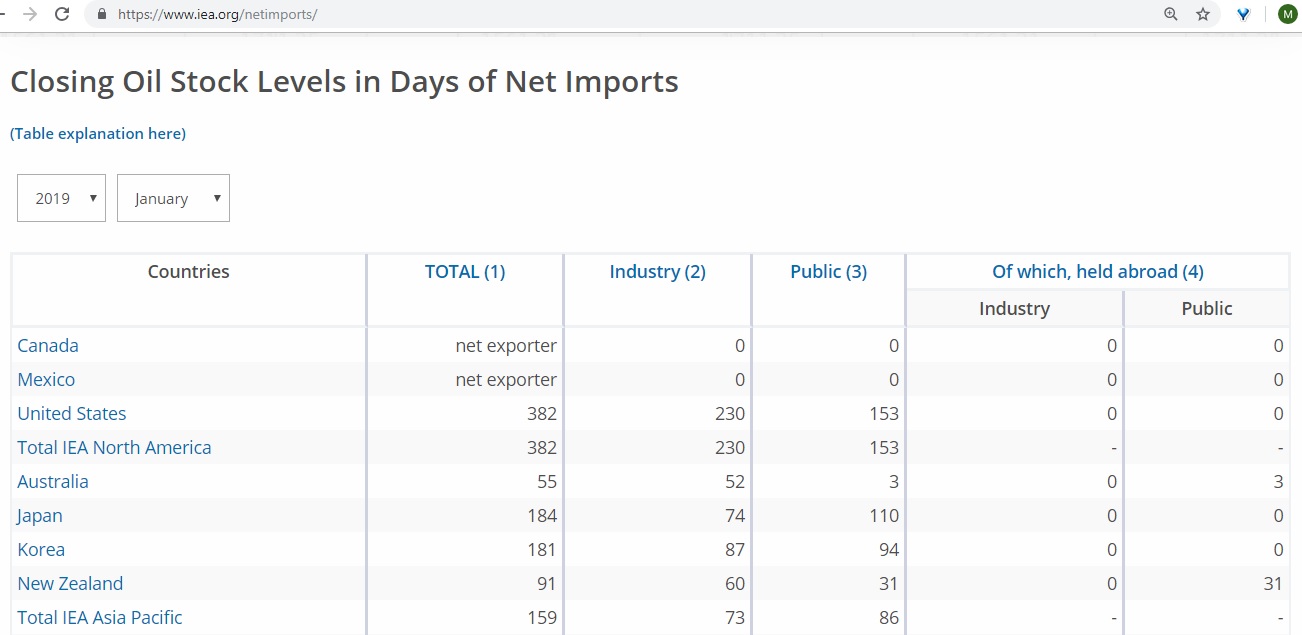 Fig 13: OECD stock levels in days of net imports
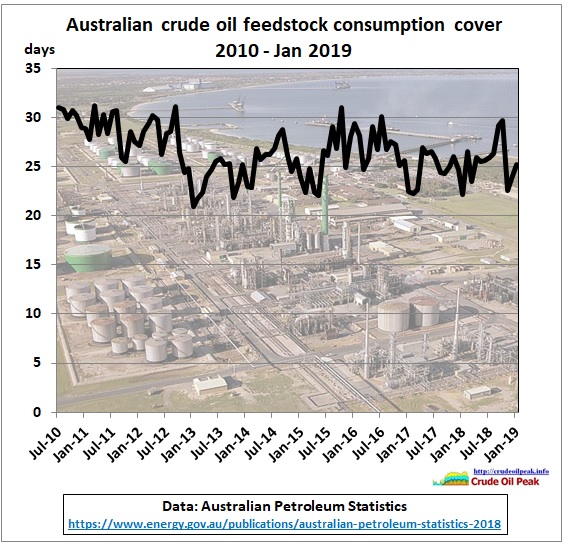 Fig 14: Crude stocks consumption cover
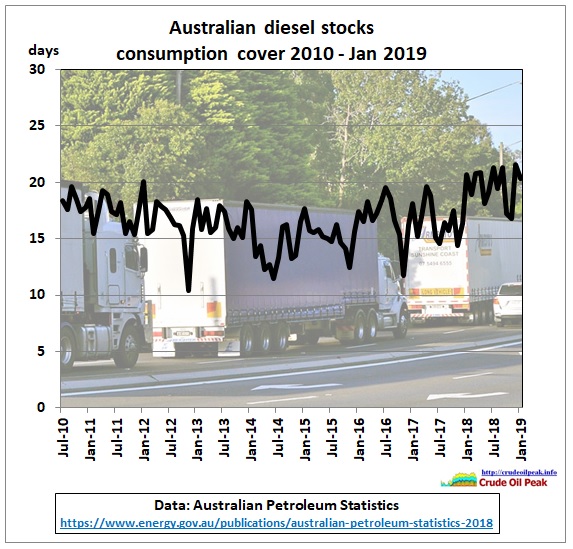 Fig 15: Diesel stocks consumption cover
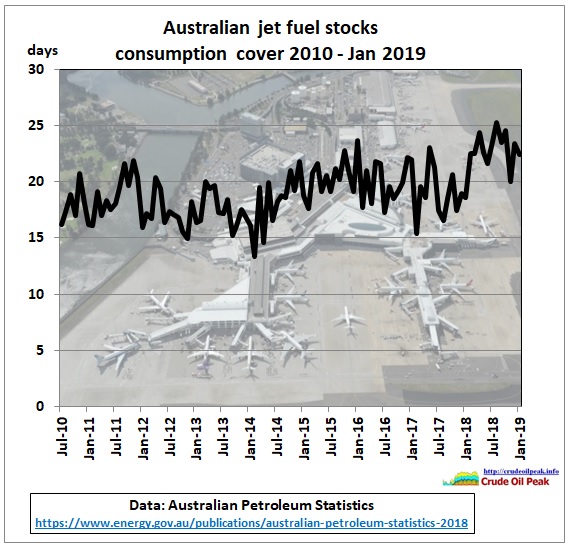 Fig 16: Jet fuel stocks consumption cover
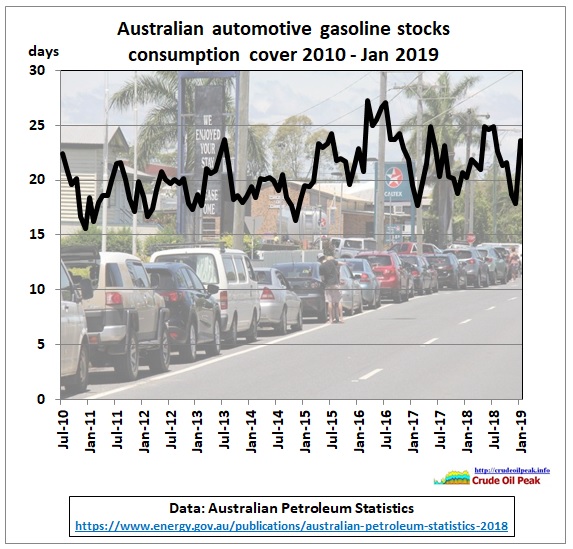 Fig 17: Gasoline stocks consumption cover
In part 2 we’ll have a closer look at how the Fuel Security Review ignores peak oil in Asia, in particular peak oil in China
http://crudeoilpeak.info/australian-fuel-security-review-ignores-peak-oil-in-china-2015-part-2