AEMO warns of NSW power gaps within three years, calls for ‘urgent’ investment in grid
21 Feb 2023
New South Wales is set to bear the brunt of reliability risks in Australia’s biggest electricity network as mass coal-fired power exits hit before sufficient replacement capacity can be built, the system operator has warned.
https://www.abc.net.au/news/2023-02-21/nsw-facing-power-gaps-within-three-years-energy-grid/102002862
From AEMO’s Electricity Statement of Opportunities (ESOO) update February 23, 2023
“This Update to the 2022 ESOO has been issued in response to the following material changes to available capacity in the National Electricity Market (NEM) relative to the 2022 ESOO:
• AGL has brought forward its expected closure date for the 800 megawatts (MW) gas-fired Torrens Island B Power Station in South Australia from 2035 to 2026.
• Origin Energy has reported a three-year extension to the operation of the 180 MW gas-fired Osborne Power Station in South Australia to 2026, and no longer advises closure on 31 December 2023.
• The 123 MW gas-fired Bolivar Power Station in South Australia is now considered committed, and is modelled as available over summer 2022-23.
• Snowy Hydro has advised a one-year delay on the Snowy 2.0 hydro project from December 2026 to December 2027, and on the gas-fired Kurri Kurri Power Station from December 2023 to December 2024.
• The Waratah Super Battery Project in New South Wales – with associated network upgrades, and system integrity protection scheme (SIPS) – is considered committed and scheduled for operation from late 2025.”
“As Figure 1 also shows, reliability risks relative to the 2022 ESOO have:
• Increased in New South Wales in 2023-24 due to the advised delay to the commissioning of the Kurri Kurri generator, however reliability risks remain within the IRM.
• Decreased in New South Wales and Queensland, following the commitment of the Waratah Super Battery Project from 2025-26 when Eraring Power Station is advised to retire. Despite this improvement, risks remain and USE continues to be forecast greater than the reliability standard from 2027-28 in New South Wales, increasing further from 2029-30 when Vales Point Power Station is expected to retire.
• Decreased in South Australia and Victoria prior to 2026-27, due to the commitment of new generation and storage projects and the delayed retirement of Osborne Power Station.
• Increased in South Australia and Victoria from 2026-27, when Torrens Island B in South Australia is now expected to retire. Forecast reliability risks increase further from 2028-29 in Victoria when Yallourn Power Station is expected to retire, and in South Australia from 2030-31 when numerous gas-fired power stations are expected to retire.”
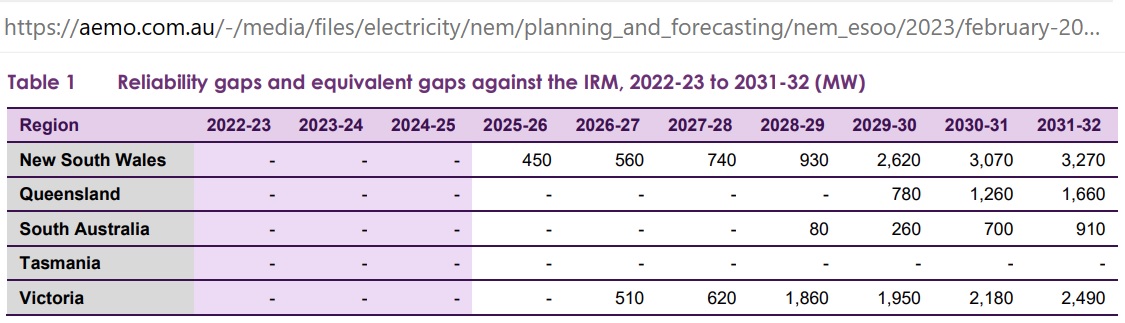 Fig 1: Reliability gaps by State
IRM=Interim Reliability Measure (0.0006% of unserved energy USE)
The reliability gaps made it into the evening news 21/2/23 thanks to Alan Kohler who extracted the most important information from Fig 1 of the above ESOO (p 4):
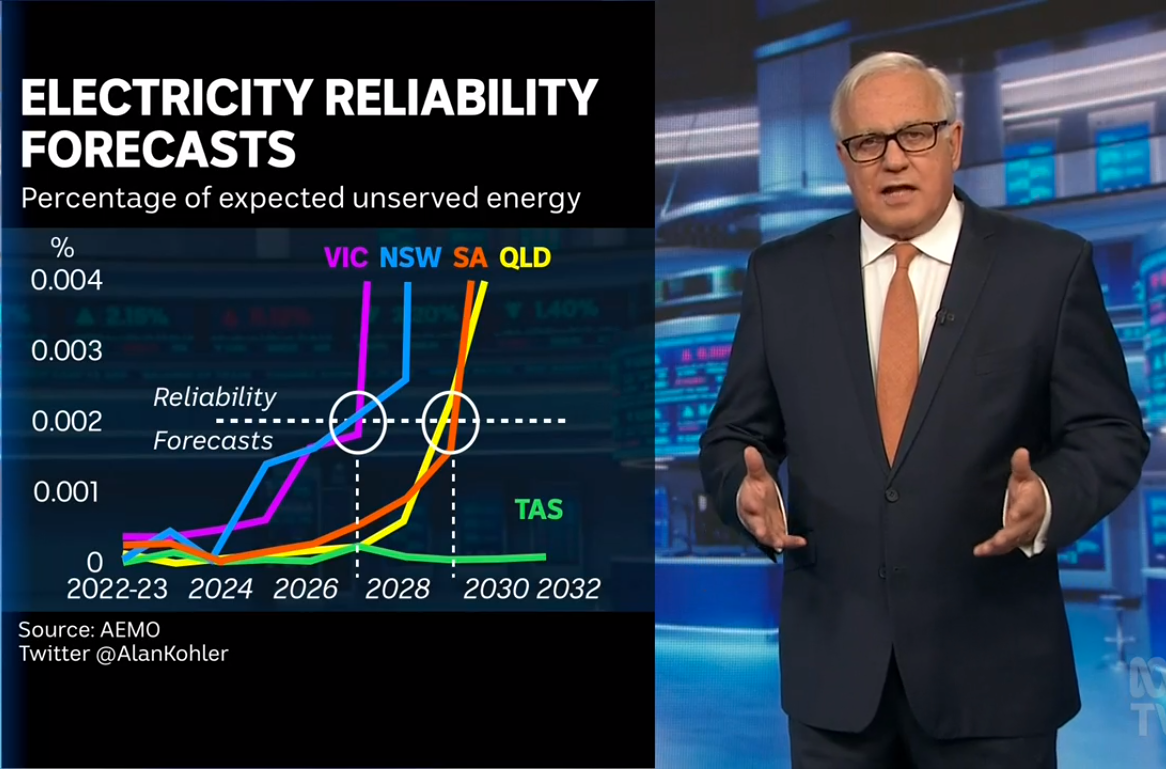 Fig 2: Unserved energy (USE) in % of total energy demanded for a given FY
Before Covid NSW annual electricity consumption was around 72 TWh. So 0.002% would be 1,440 MWh in 1 year or appr. 3 hrs of a 500 MW unit.
It is interesting to note that ESOO Feb 2023 does not mention that the coal fired power plant Liddell will close end of April 2023 (Unit 4 on the 19th, unit 2 on the 25th and unit 1 on the 29th)
On the day before the above AEMO report was published, the generation by type of fuel over the last 3 days looked like this:
 Fig 3: NSW generation by fuel 19-22 Feb 23 with coal peaks after sunset (7 pm)
https://opennem.org.au/energy/nsw1/?range=7d&interval=30m
The Open NEM website stacks this graph as follows: imports (dark violet area hardly visible), coal, gas, hydro, wind and solar (both utility from solar farms and roof top PV)
We see the critical period is after sunset as described in this post:
30 Jan 2023
When the sun sets in Queensland, energy guzzler NSW is on its own
http://crudeoilpeak.info/when-the-sun-sets-in-queensland-energy-guzzler-nsw-is-on-its-own
(1) Ramp up coal
You may not like it but it can happen. Let’s stack all the coal plants together:
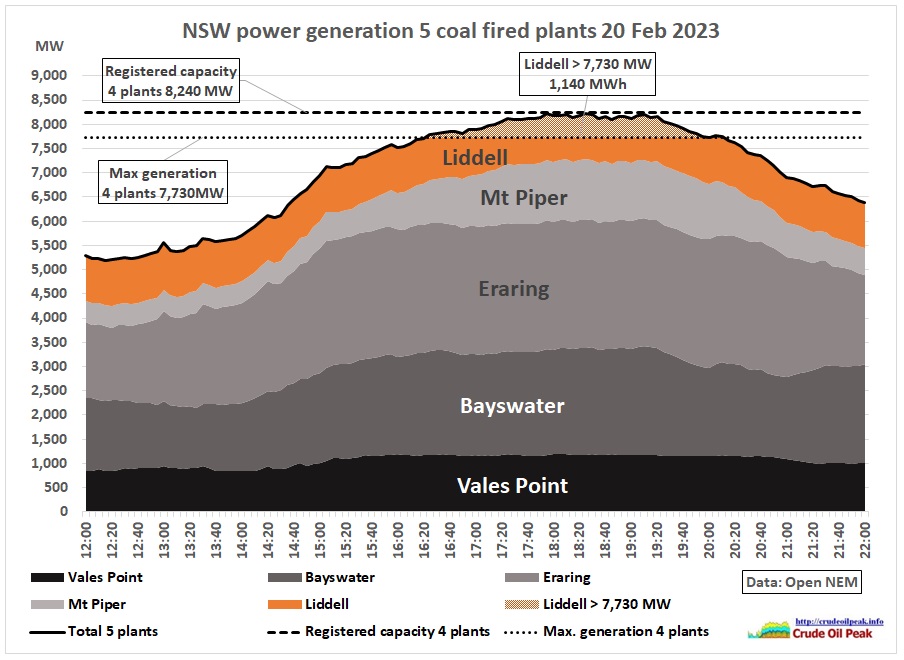 Fig 4: NSW coal powered generation 20 Feb 2023
Liddell supplied 920-960 MW baseload power (i.e. 24 hrs/day).
(a) To fully replace Liddell during peak hour, the 4 remaining coal fired power plants would need to run at their combined registered capacity of 8.240 MW (dashed line). This is unlikely to happen.
(b) The sum of maximum outputs achieved by each of the 4 plants in the preceding 7 days was 7,730 MW (dotted line) or 510 MW less, amounting to a loss of 1,140 MWh over a period of 4 hrs. In a renewable energy solution this would have to be the size of the battery, charged by solar or wind power. AGL’s own Liddell battery is only 250 MW over 2 hrs (500 MWh)
(c) The maximum combined output achieved by the 4 remaining plants on the day itself was 7,280 MW or 960 MW less, amounting to a loss of 3,190 MWh over a period of 5 hrs. This goes beyond the job of batteries.
(d) Off-peak, Bayswater, Eraring and Mt Piper could in theory replace Liddell. But that would require several more units running full time and make maintenance more difficult.
The range of possible losses gives us an idea about the magnitude of the problem on a selected day (which was not particularly hot, 29 degrees at 3 pm)
Ramping up coal would of course increase emissions.
(2) Wind
How about wind replacing Liddell? Let us swing a magic wand and double current wind capacity at the same exact locations where wind farms are now.
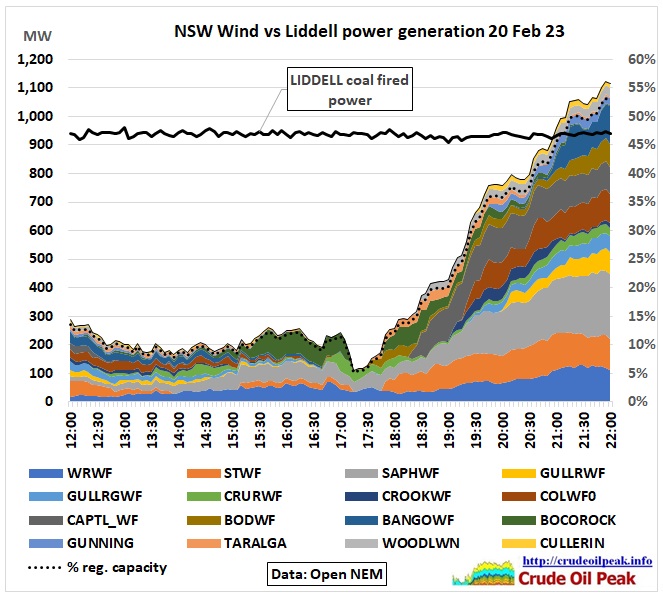 Fig 5: Generation from 16 windfarms in NSW. The right scale shows % of registered capacity
Wind picked up in the afternoon but approached only 300 MW when the peak period started around 6 pm. It would not even have been sufficient to cover the 510 MW under (b) above. There remained a big gap until wind exceeded the 930 MW supplied by Liddell.
(3) Hydro
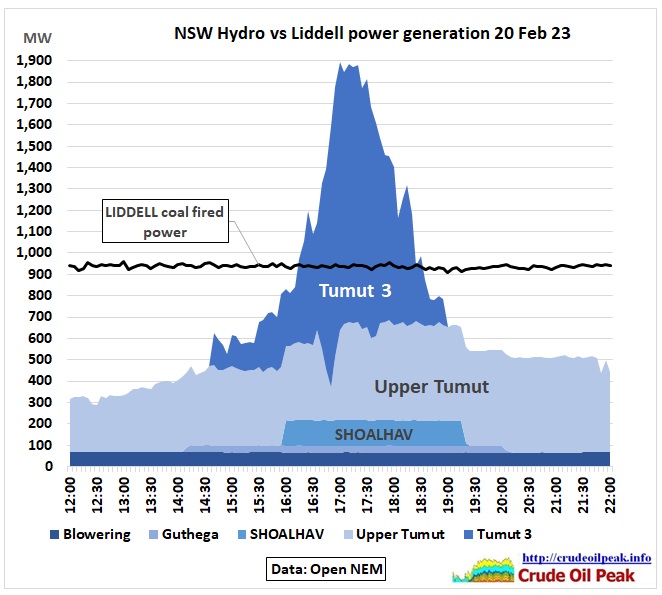 Fig 6: Hydro power generation on 20 Feb 2023
Upper Tumut comprises underground power stations Tumut 1 and 2 (616 MW reg. capacity). Tumut 3 is a pumped hydro plant (6×250=1,500 MW reg. capacity, pumps 600 MW) for use during peak demand. Shoalhaven is also a pumped hydro with 240 MW.
The Tumut 3 area above the Liddell line represents 1,180 MWh, enough to cover case (b) above (instead of exporting it to Victoria).
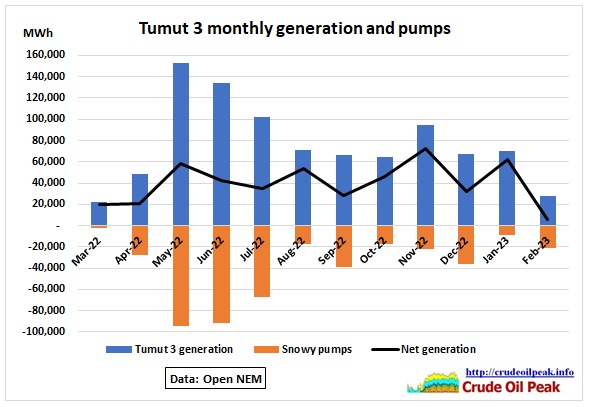 Fig 7: Tumut generation Mar 2022 -February 2023
Tumut 3 generation and net output (average 40,000 MWh per month) is highly variable from day to day and month to month. As operated now, it is not an energy storage system for renewables which could replace Liddell. That will be done by Snowy2 expected to be completed in 2027.
(4) Gas
NSW has 3 main gas fired power plants for which data are available, with following registered capacities
Colongra OCGT 4×181 MW = 724 MW
Uranquinty OCGT 4×166 = 664 MW
Tallawarra CCGT 440 MW
There is also a smaller plant:
Smithfield CCGT 39 MW
Total 4 plants 1,867 MW
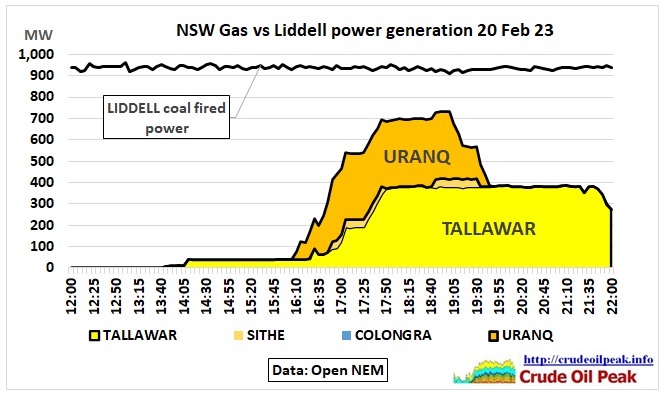 Fig 8: Gas power generation on 20 Feb 2023
At peak, Tallawarra was running at 380 MW (86 % cap.), Uranquity at 315 MW (47% cap.) and Smithfield at 35 MW (90 % cap.).
The Colongra gas plant, located on the site of the decommissioned Munmorah coal fired power plant, was not in operation on the 20th. In one month it was used only on 5 days. It is connected by a 10” feeder pipeline to the Sydney – Newcastle pipeline. Since its gas pressure of 3.4 MPa is insufficient, there is a 9 km long, winding 42” storage pipeline with a compressor station to fill that storage over a 24hr off-peak period to a pressure of 13 MPa, to allow a 5 hr operation at full capacity.
https://jemena.com.au/pipelines/colongra-pipeline
A similar solution is being used for the Kurri-Kurri gas plant under construction. There is also the problem of peak conventional gas on the East Coast.
(5) Imports
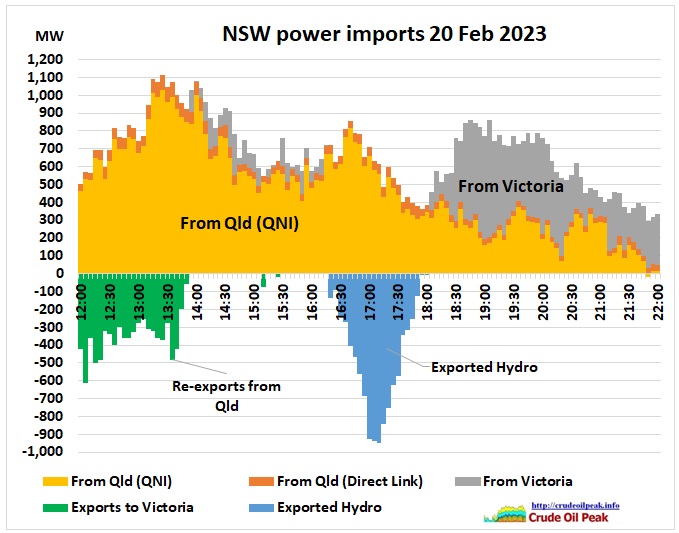 Fig 9: NSW power imports and exports (=negative imports) on 20 Feb 2023
Most of the time, NSW is in power generation deficit and has to import from Victoria or Queensland. On 20 Feb, there were also exports to Victoria, first around noon re-exports from Queensland (green area) and then in the afternoon an unusual export surge from Tumut 3 (blue area, see also Fig 6). A quick, but not comprehensive look at Victoria shows that at that time there was a temporary generation drop in Loy Yang by 300 MW and an increase in exports to South Australia by 600 MW.
The problem with power imports is of course that any advantage NSW thinks can be gained in this way may quickly turn into its opposite. An example is the Callide C4 hydrogen explosion in Queensland
7/6/2021
NSW power spot price spikes May 2021 become regular (part 1)
https://crudeoilpeak.info/nsw-power-spot-price-spikes-may-2021-become-regular-part-1
Conclusion
Current gas, wind and hydro capacities in NSW cannot fully and reliably replace baseload Liddell. Pumped hydro Snowy2 is only ready by 2027. In theory, 3 coal plants could replace Liddell off-peak but that will increase CO2 emissions and make maintenance more difficult.
Therefore, this shut down will eat up any redundancies in the system and expose vulnerabilities when supplies get tight. It is imperative that power demand be reduced or at least not increased. Every major project proposal must be accompanied by an estimate of operational power demand. Cumulative demand has then to be compared to available supplies. What is not affordable are 100s of new apartment towers facilitated by associated metros and light rail projects, the new airport with the aerotropolis and millions of electric vehicles. The current high rate of urban immigration (235K pa) must be reduced to an absolute minimum because additional population increases power demand.