The longest price spike periods happened in South Australia after sunset and under low wind conditions, requiring gas fired power to reach 80% in the generation mix. Gas is in short supply and expensive as conventional gas production in the neighbouring State of Victoria has peaked in 2017. At the same time, coal fired power plants in NSW were running at 97% capacity.
 Fig 1: Power supply by fuel in South Australia 28-30 July 2024
https://opennem.org.au/energy/sa1/?range=1d&interval=30m&view=discrete-time
Let’s zoom into 28 July:
 Fig 2: Power generation by fuel in South Australia
South Australia after sunset and with very little wind:
 Fig 3: South Australia dependency on gas (1,660 MW) after sunset and little wind
Note that DIESEL was used (for the grid!). Much hyped batteries 36 MW. Variable imports
 Fig 4: Huge price spikes in South Australia between $10,000 to $12,000/MWh on 28/7/24
https://aemo.com.au/en/energy-systems/electricity/national-electricity-market-nem/data-nem/data-dashboard-nem
Cumulative prices (bottom panel) for 2,016 trading intervals increased to $500,000, or 70% over levels 7 days earlier. As of writing this post, the cumulative reached $1 million. The threshold (CPT) is $1,574,700 (equivalent average spot price of $780/MWh) at which administered price capping (APC) is introduced. https://aemo.com.au/-/media/files/electricity/nem/security_and_reliability/dispatch/policy_and_process/guide-to-administered-pricing.pdf?
 Fig 5: NSW power generation by fuel type 28/7/2024 https://opennem.org.au/energy/nsw1/?range=1d&interval=30m&view=discrete-time
NSW coal maxed out 97%
of which 518 MW exported to Victoria
of which 479 MW re-exported to Tasmania and 39 MW to SA
as shown in next graph:
 Fig 6: Demand/supply balances on the east coast on 28 July
Violet bars show demand, blue bars supplies. The double arrows indicate the direction of power exports. It is quite rare that NSW exports power.
Let’s have a look at gas fired power plants in South Australia. We zoom into 28 July
 Fig 7: Gas fired power in SA 28-30 July
The role of batteries (blue areas) is negligible in terms of MW.
While writing this article, we witness a perfect example of simultaneous price spikes on 31 July, 2014, 18:10 hrs.
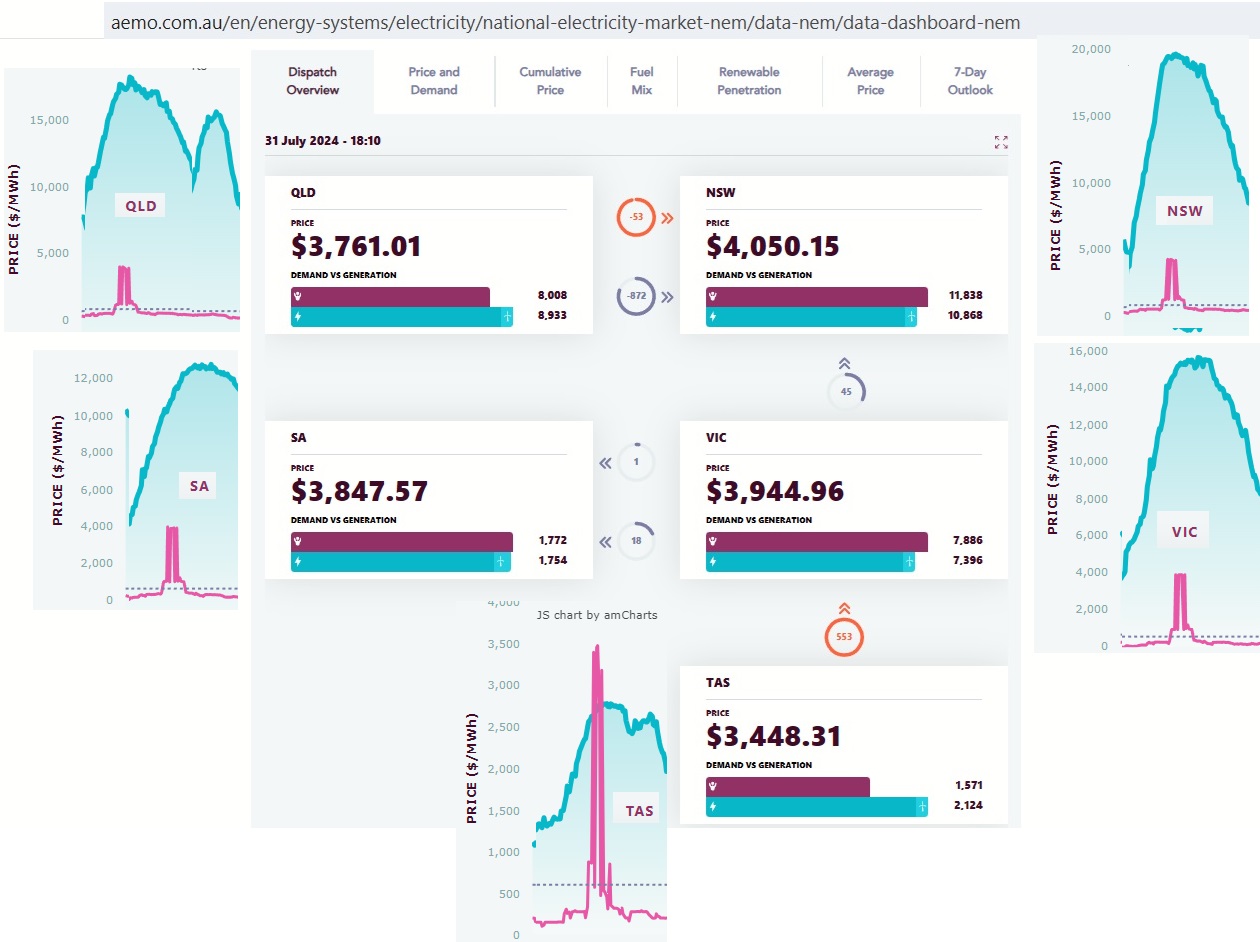 Fig 8: Price spikes pasted into screenshot of demand/supply balances at 18:10
Note the scales for the price spikes are not the same. We can see that NSW is living – as usual – beyond its means and has to import power, mainly from Queensland. Victora is cold and imports power from Tasmania.
Conclusion:
Weather conditions in winter with early sunsets expose underlying power supply problems which are systematically ignored by governments when they promote and approve power hungry projects like airports, skyscrapers and apartment towers (with associated metros), all increasing peak demand. High rates of immigration are not helpful. EVs and increasing use of datacentres will also add new demand for power.
Further reading:
An initial pass over ENERGY bids during price volatility of 30th July 2024
31/7/24
https://wattclarity.com.au/articles/2024/07/an-initial-pass-over-energy-bids-during-price-volatility-of-30th-july-2024/
Eraring output at five-year high as coal dependence persists
31/7/24
https://www.afr.com/companies/energy/eraring-output-at-five-year-high-as-coal-dependence-persists-20240731-p5jxwt