Oil production and consumption
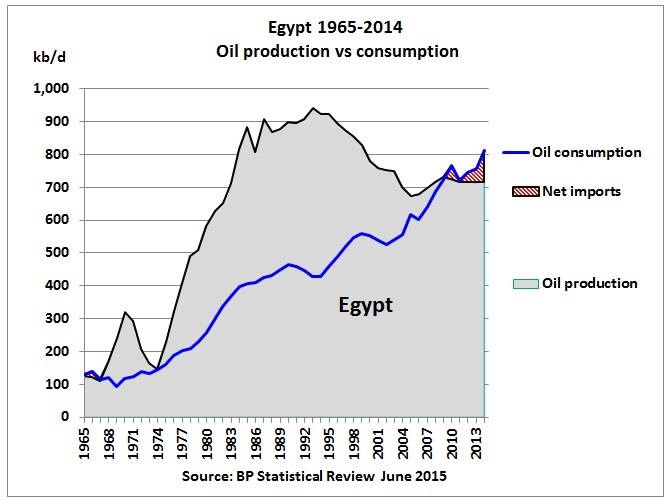
Fig 1: Oil production vs consumption
After a post-peak decline production has stabilized but consumption has increased relentlessly at a long-term 1.7% pa, slightly below population growth of around 2% pa. Egypt is now a net oil importer. On these trends, the gap between consumption and production is likely to get larger. This increases imports and the need for fuel subsidies. Let’s zoom into the monthly oil production (crude and NGL separately)
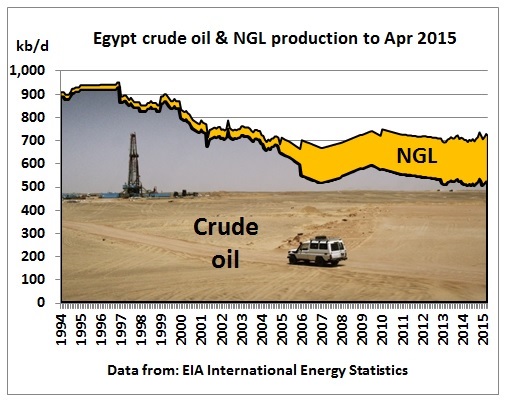
Fig 2: Production of crude oil and natural gas plant liquids
Crude oil production declined again since 2009 at 2.5% pa, offset by an increase in NGLs of 4.7% pa
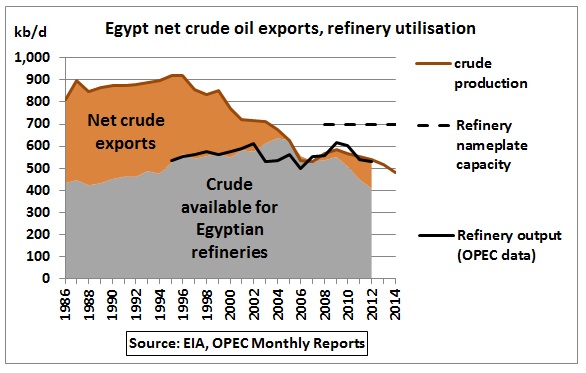
Fig 3: Net crude exports and refinery utilisation
The crude oil exported up to 2005 (at low oil prices!) is now missing. EIA data are presently only available up to 2012. The EIA writes:
According to data from OPEC’s Annual Statistical Bulletin, Egypt’s refined petroleum output averaged 445,000 b/d in 2013, suggesting that refinery utilization was about 63%. Egypt’s refining output declined by 28% from 2009 to 2013. Facts Global Energy attributes this decline to Egypt’s policy that permits foreign oil producers to export more crude oil as repayment of EGPC’s financial debt. As a result, Egypt’s crude oil exports [56% EU, 28% India, 13% China] have not declined over the past few years, despite declining production. In turn, there is a lower volume of domestic crude oil available for the domestic refineries, and Egypt must make up for the difference by importing petroleum products and/or crude oil. Egypt imported about 145,000 b/d of petroleum products in 2014, according to Global Trade Information Services. Egypt also exported about 60,000 b/d of petroleum products that same year
http://www.eia.gov/beta/international/analysis.cfm?iso=EGY
| Refinery operator | Location | Nameplate capacity (barrels per day) |
|---|---|---|
| Cairo Petroleum Refining Co. | Mostorod (Cairo) | 142,000 |
| Alexandria Petroleum Co. | Alexandria (El-Mex) | 115,000 |
| El-Nasr Petroleum Co. | El Suez | 100,000 |
| Middle East Oil Refinery | Alexandria (Sidi Kerir) | 100,000 |
| Ameriya Petroleum Refining Co. | Alexandria | 75,000 |
| Suez Petroleum Processing Co. | El Suez | 68,000 |
| Assiut Petroleum Refining Co. | Assiut | 50,000 |
| Cairo Petroleum Refining Co. | Tanta | 54,000 |
| Total | 704,000 | |
| Source: Arab Oil & Gas Directory, Egyptian General Petroleum Company | ||
Fig 4: Egyptian refineries
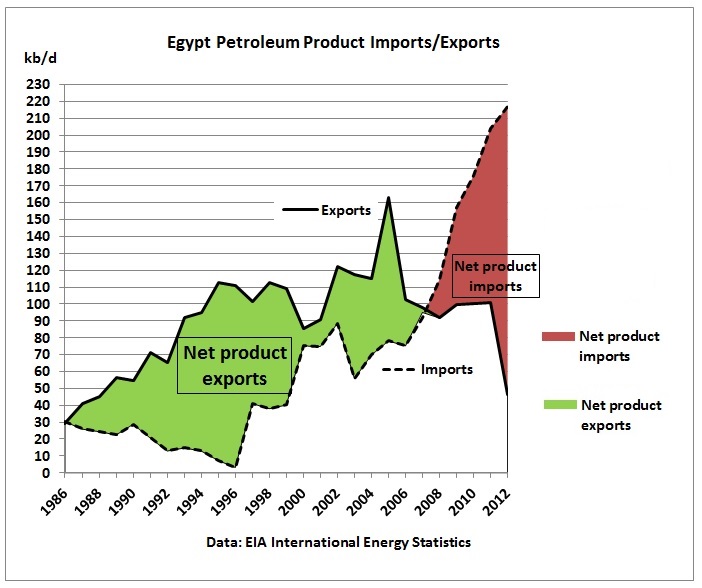
Fig 5: Petroleum product imports and exports
As long as oil production was much higher than consumption, petroleum products were exported. The turning point came in 2007/08. Since then net product imports have skyrocketed.
All data are from here: http://www.eia.gov/cfapps/ipdbproject/iedindex3.cfm?
Oil consumption by fuel type
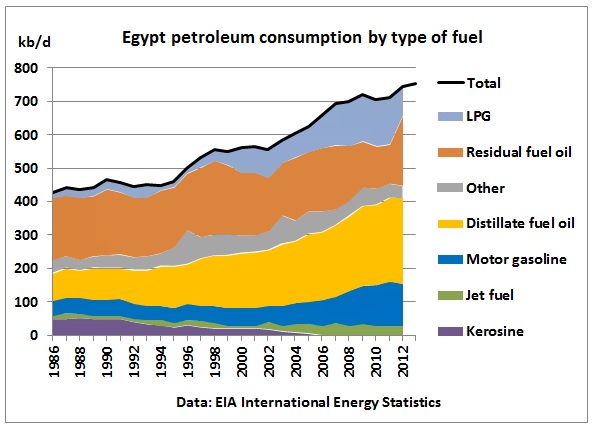
Fig 6: Petroleum consumption by fuel
The main drivers of consumption are diesel and petrol. LPG also played an increasing role. Data are only available to 2012.
Gas production and consumption
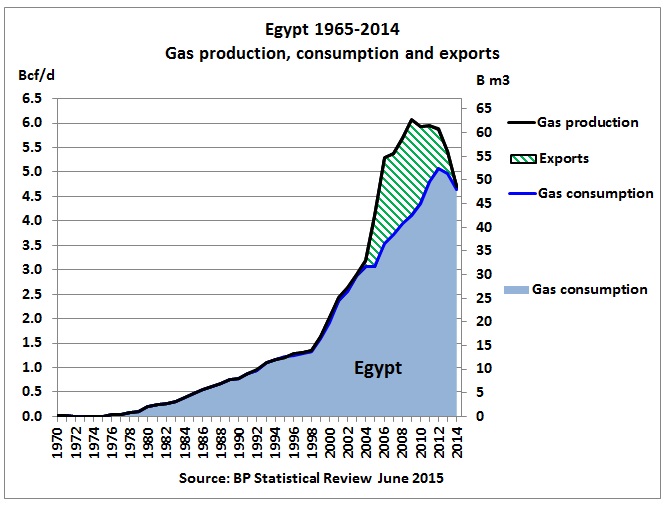
Fig 7: Gas production and consumption
Gas production peaked in 2009 and consumption in 2012. Gas exports have trended towards zero. New gas discoveries have been made offshore Egypt’s Mediterranean coast.
Choke points
Suez Canal and SUMED pipeline
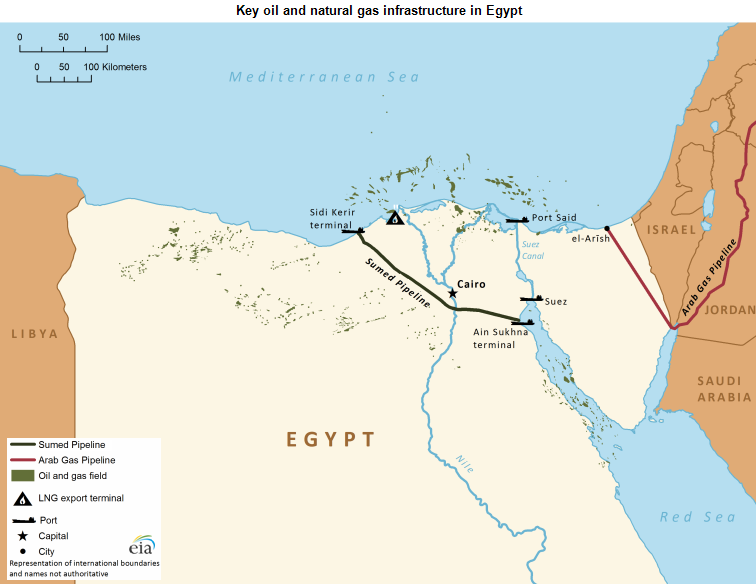
Fig 8: Oil and gas infrastructure in Egypt
http://www.eia.gov/todayinenergy/detail.cfm?id=12371
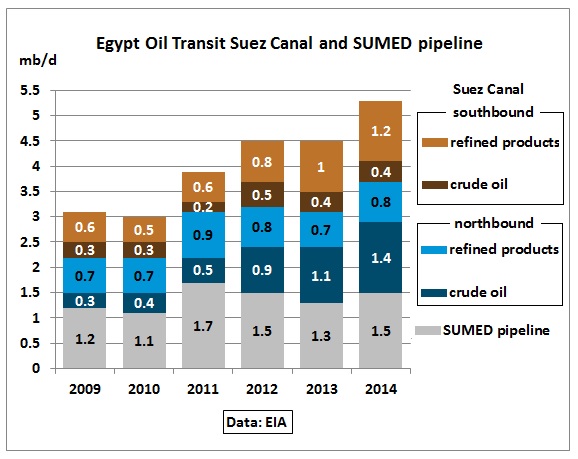
Fig 9: Oil transit in Egypt (SUMED north bound capacity 2.3 mb/d)
Data are from here: http://www.eia.gov/beta/international/analysis.cfm?iso=EGY
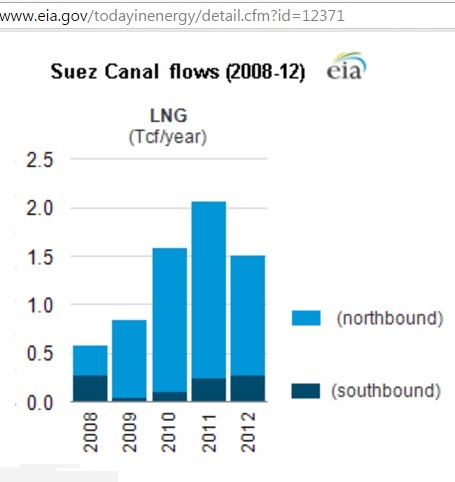
Fig 9: LNG flows in Suez Canal
http://www.eia.gov/todayinenergy/detail.cfm?id=12371
Strait of Tiran
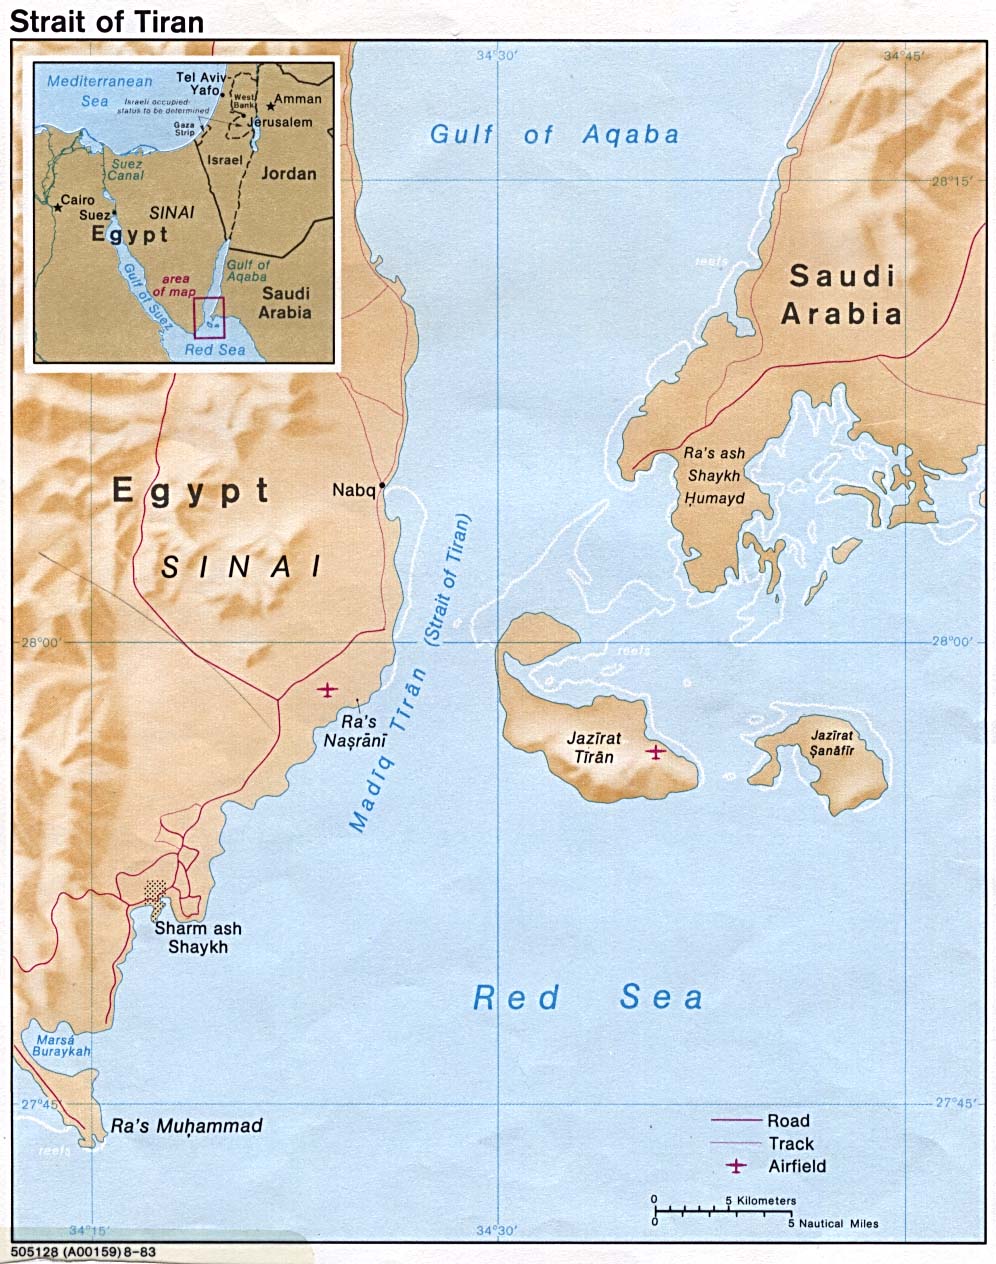
Fig 10: Straits of Tiran between Egypt and Saudi Arabia
https://en.wikipedia.org/wiki/Straits_of_Tiran https://en.wikipedia.org/wiki/Tiran_Island
These straits connect the Gulf of Aqaba and the Red Sea. The Gulf of Aqaba is important for Jordan (port of Aqaba) and Israel (port of Eilat and the Ashkelon pipeline).
The Tiran island belongs to Saudi Arabia but is leased to Egypt which allows a Multinational Force of Observers (MFO) to implement the 1979 Camp David Accord. In this peace treaty Israel was given free passage through the Straits of Tiran and Israel guaranteed free passage to Aqaba.
https://en.wikipedia.org/wiki/Camp_David_Accords
The website of the Eilat – Ashkelon Pipeline Company shows Russian and Caspian oil (via the BTC pipeline) going towards Asia.
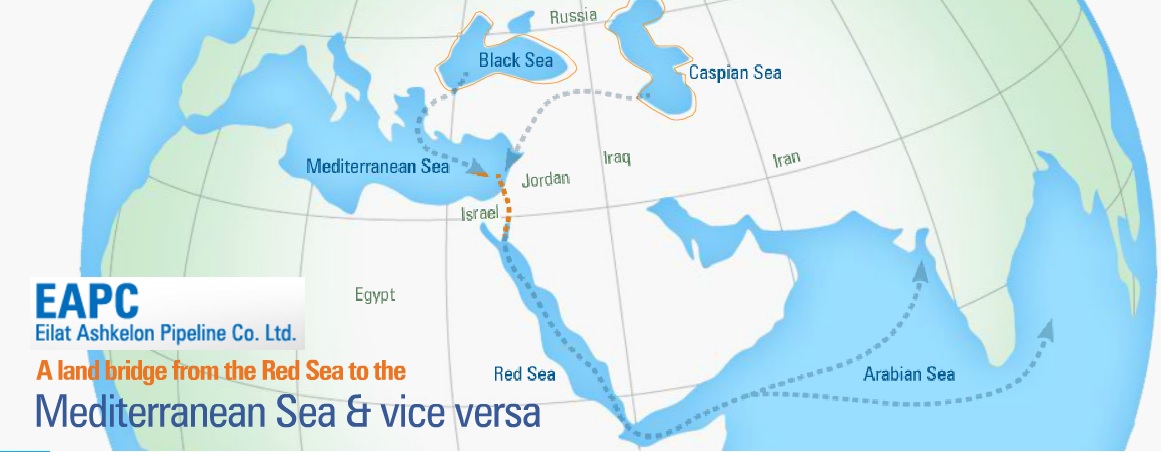
Fig 11: South bound oil flows via Israel through the straits of Tiran
EAPC’s range of facilities offers the possibility of collecting several cargoes of 600,000 barrels or 1,000,000 barrels at the company’s storage terminals, and then redelivering larger cargoes in Eilat. This flexible system along with other transportation and handling alternatives can produce solutions tailored to the customers’ needs.
http://eapc.com/reverse-flow-project/
The Multinational Force of Observers has its South Camp near Sharm-el-Sheikh and an observation post 3-11 on the heavily mined Tiran island itself.
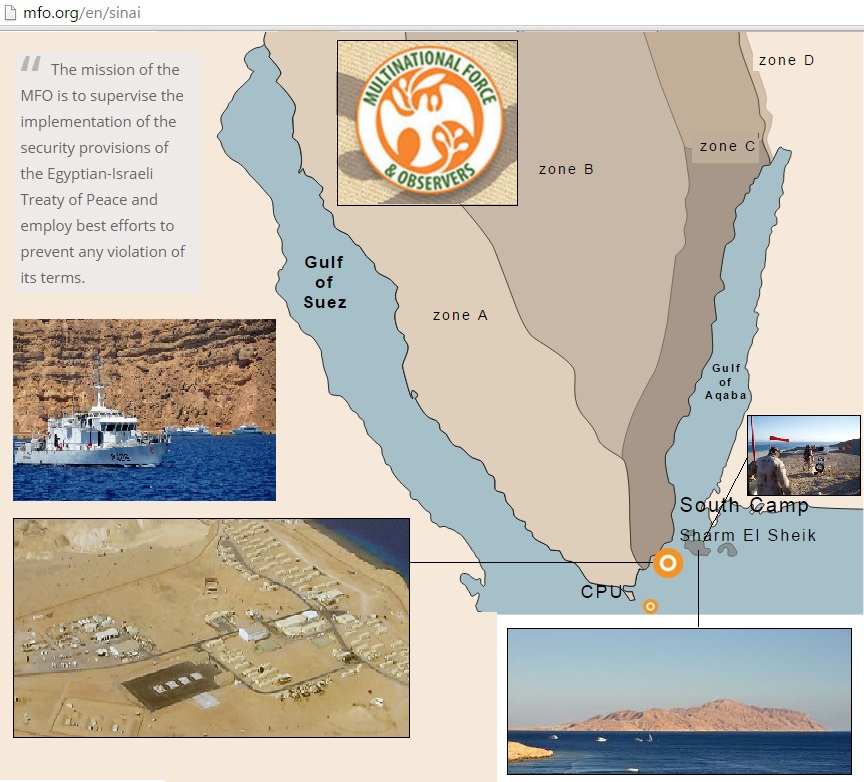
Fig 12: Multinational Force & Observers on Sinai, CPU=coastal patrol unit
(Excerpt shows Southern Sinai)
The East coast of Sinai is zone C. Only the MFO and Egyptian police are allowed in this zone.
However, that changed when an insurgency in Sinai started in 2011 (gas pipeline Egypt-Jordan sabotaged repeatedly). Israel allowed Egyptian troops to be positioned in zones B and C. http://english.ahram.org.eg/News/19979.aspx
Aviation Chokepoints
A new type of chokepoint has emerged. After the shooting down of MH17 over Ukraine, the public is aware that certain air corridors are deadly. Sinai is now on the list of areas to be avoided.
2 months before the Russian Metroliner was brought down by a bomb, there was another incident:
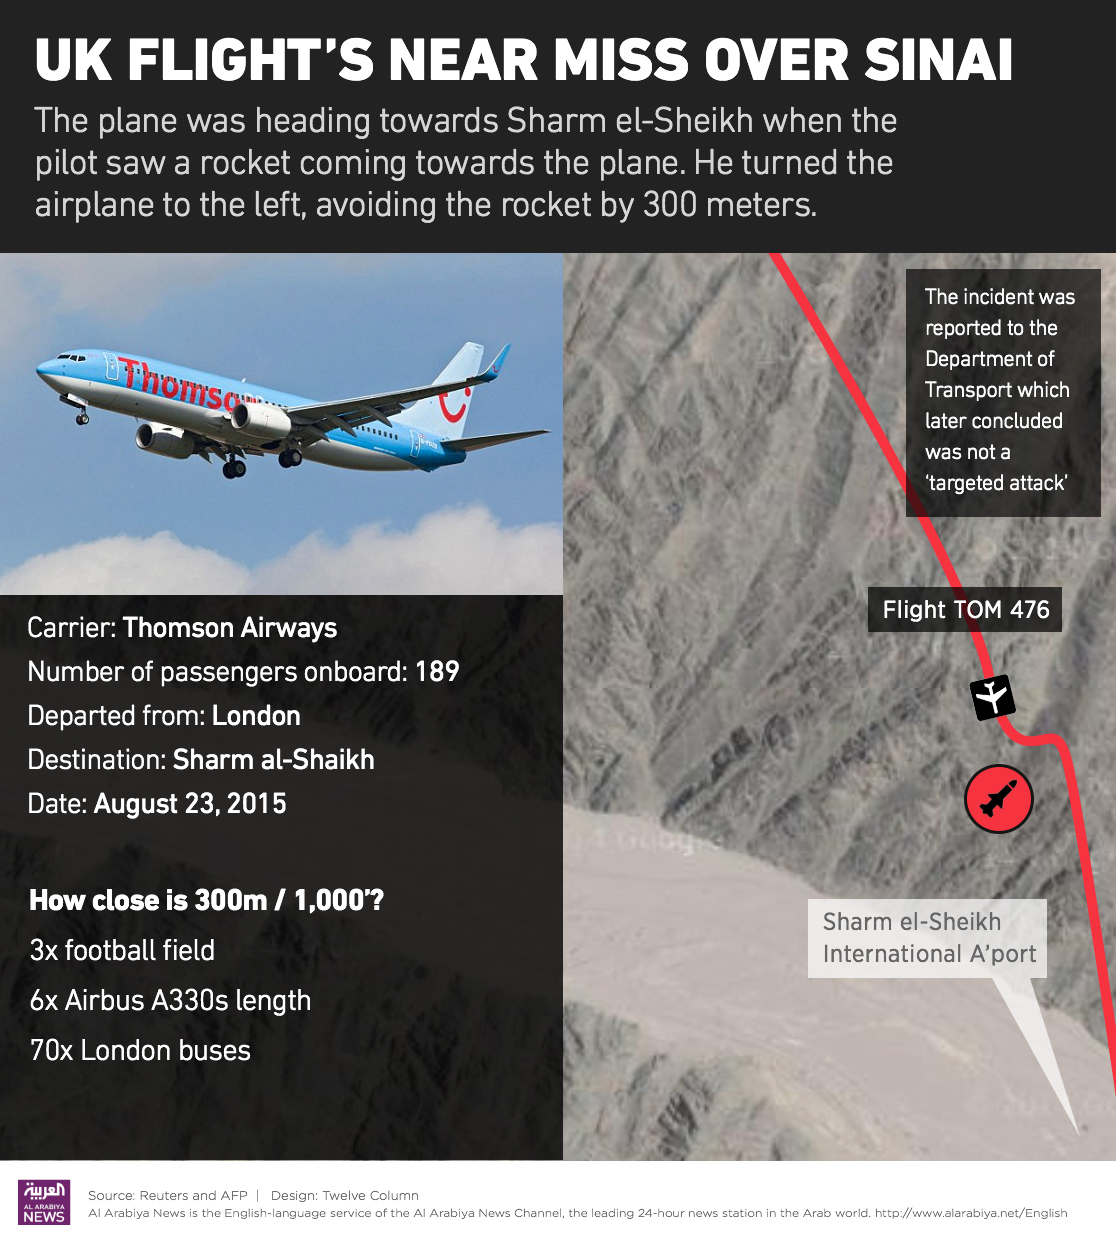
Fig 13: Attention passengers, our skilled pilot just evaded a routine missile
“The crew were told the rocket was from an Egyptian military exercise, but with what has happened there is a lot of fear. The incident left staff petrified.”
A spokesman for Britain’s Department for Transport (DfT) said of the August near-miss: “We investigated the reported incident at the time and concluded that it was not a targeted attack and was likely to be connected to routine exercises being conducted by the Egyptian military in the area at the time.”
http://english.alarabiya.net/en/News/middle-east/2015/11/07/UK-plane-entering-Sharm-missed-rocket-by-300m-in-August.html
Let’s plot that onto a map:
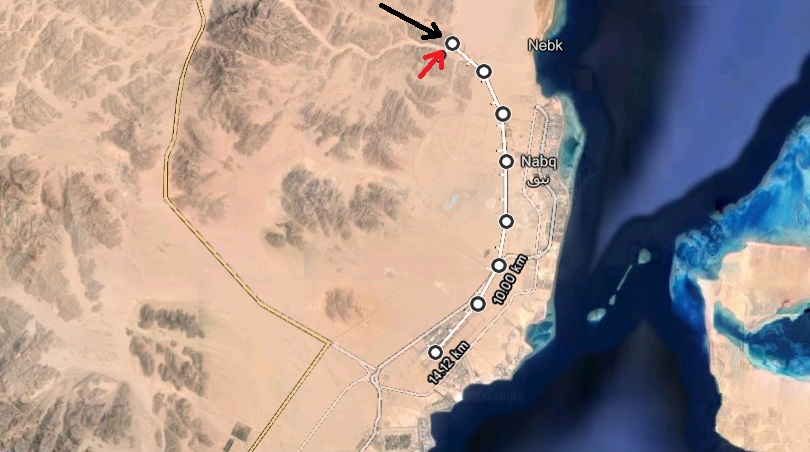
Fig 14 Indicative flightpath of TOM 476 on approaching Sharm el Sheikh airport
That’s clearly in zone C and just where the Strait of Tiran is (due to some coral islands the safe passage is only around 1 km wide). So the stationing of Egyptian military around Sharm el Sheikh had some unintended effects.
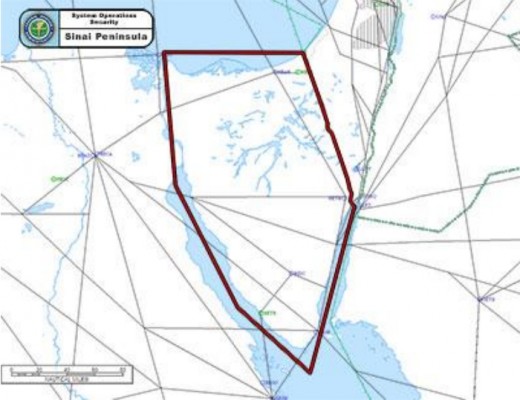
Fig 15: Flight paths over Sinai
Conclusion:
We see how oil depletion, attacks on energy infrastructure and problems at chokepoints converge. Egypt is strategically located at the cross roads of North Africa, the Mediterranean, the Middle East and the Indian Ocean. The world better paid more attention to what is happening there.
In the next update on Egypt we’ll have a look at Egypt’s budget deficit.
Previous posts
6/7/2013
Egypt’s future crude oil import requirements for 3 population scenarios
http://crudeoilpeak.info/egypts-future-crude-oil-import-requirements-for-3-population-scenarios
4/7/2013
2/3 of Egypt’s oil is gone 20 years after its peak
http://crudeoilpeak.info/23-of-egypt%e2%80%99s-oil-is-gone-20-years-after-its-peak