On the first really hot day in 2018 Sydney experienced temperatures above 45 degrees.
 Fig 1: BOM Temperature map for NSW on 7 Jan 2018
http://www.bom.gov.au/web03/ncc/www/awap/temperature/maxave/daily/colour/history/ns/2018010720180107.hres.gif
These were the temperatures in Sydney’s suburbs:
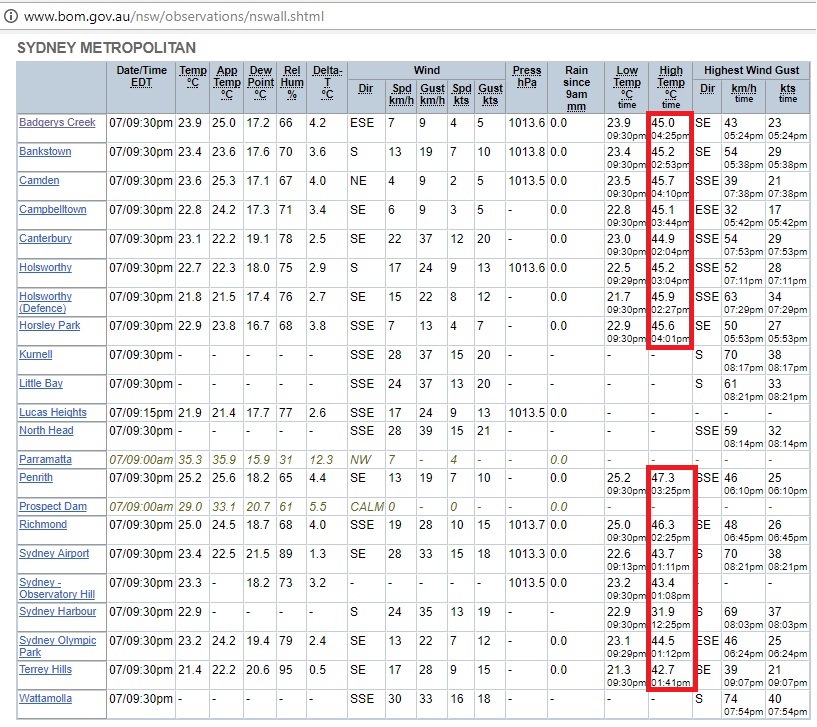 Fig 2: Maximum temperatures on 7th January 2018 in the Sydney Metropolitan area
Energy guzzling NSW had to import 1,659 MW on Jan 7th 2018 at 16:40 NEM time. This was a Sunday during summer holidays with a comparatively low demand.
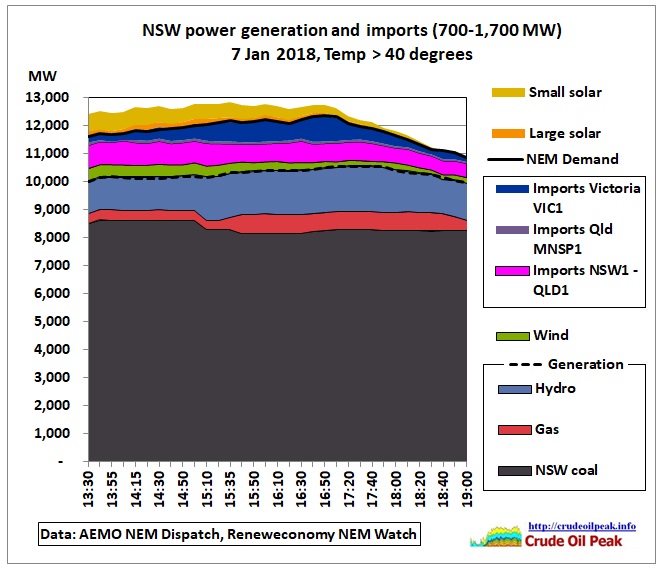 Fig 3: NEM generation, imports and demand during the afternoon
Note that solar is not included in the definition of “generation” but sits on top of the NEM demand curve. It lowers the grid supply peak as described in this graph of the Australia Institute
https://twitter.com/TheAusInstitute/status/950614571286380545
AEMO Dashboard
The generation and import data are from AEMO’s dashboard (NEM Dispatch Overview tab)
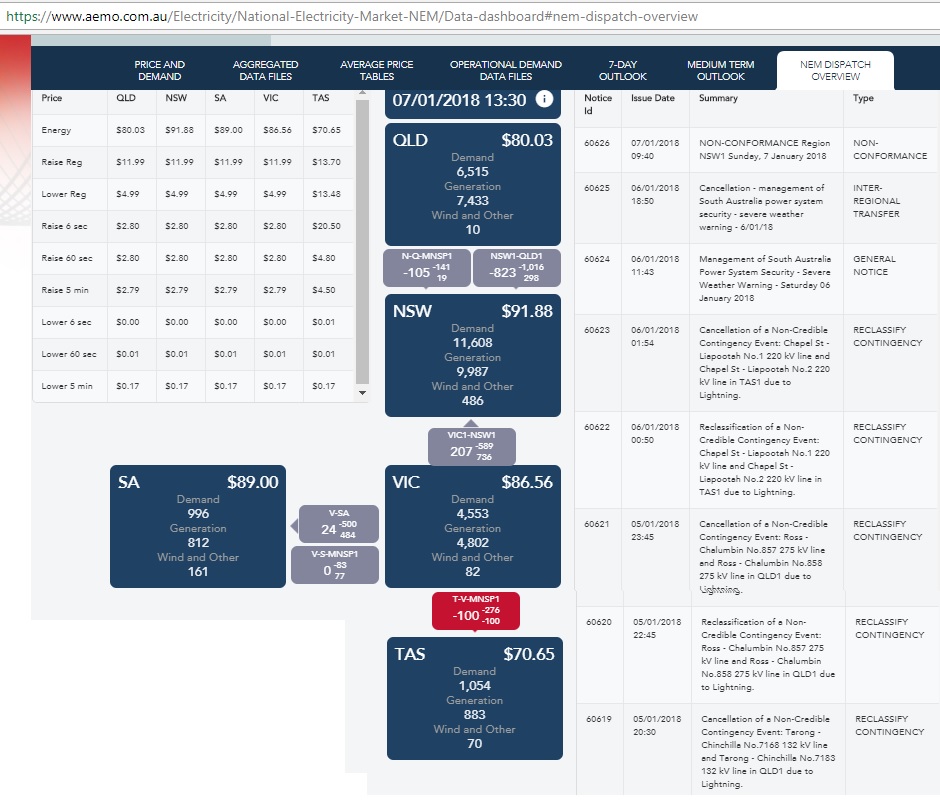
Fig 4: Screen shot of AEMO’s NEM dispatch tab on 7/1/2018 13:30 NEM time (14:30 AEST)
https://www.aemo.com.au/Electricity/National-Electricity-Market-NEM/Data-dashboard#nem-dispatch-overview
We can see that in NSW at 14:30 EAST demand of 11,608 MW was higher than generation 9,987 + 486 = 10,473 MW, a deficit of 1,135 MW.
AEMO’s dashboard also shows demand curves and electricity spot prices in a moving window of 2 days, separate for each State:
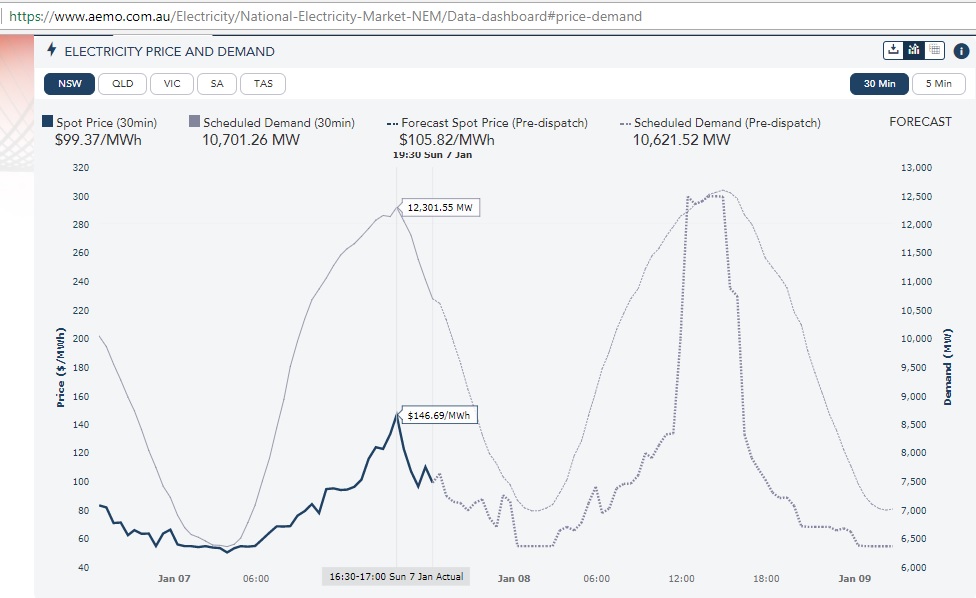 Fig 5: AEMO’s spot electricity prices and demand in NSW
In NSW, NEM demand on 7/1/2018 peaked at 16:30 with 12,302 MW. At the same time, demand in Victoria was rather low due to a cool change in the previous night. Victorian demand had gone up to 8,000 MW the day before
http://www.wattclarity.com.au/2018/01/a-stinking-hot-weekend-poses-a-reminder-of-the-difficulty-of-forecasting-electricity-demand/
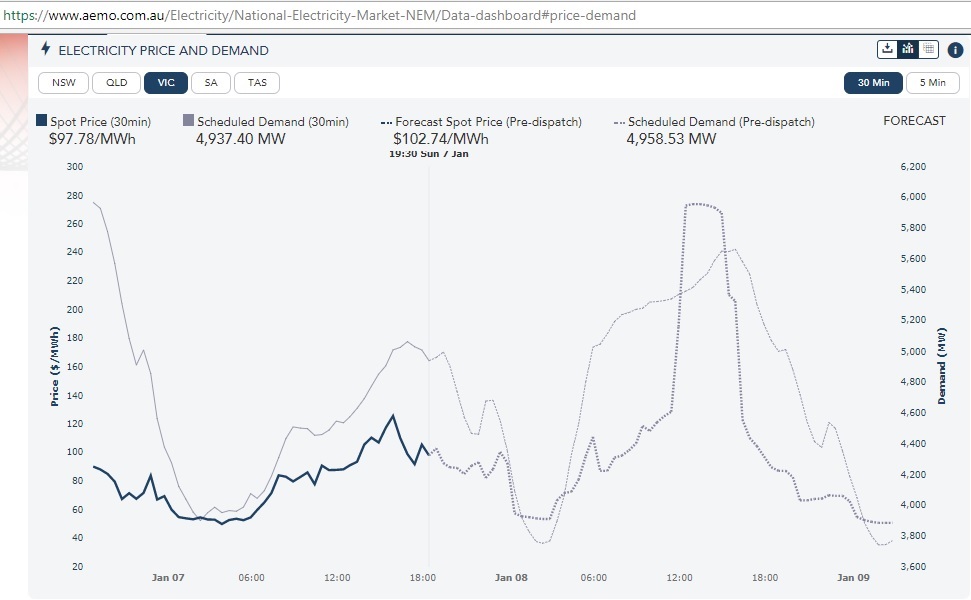 Fig 6: AEMO’s spot electricity prices and demand in Victoria
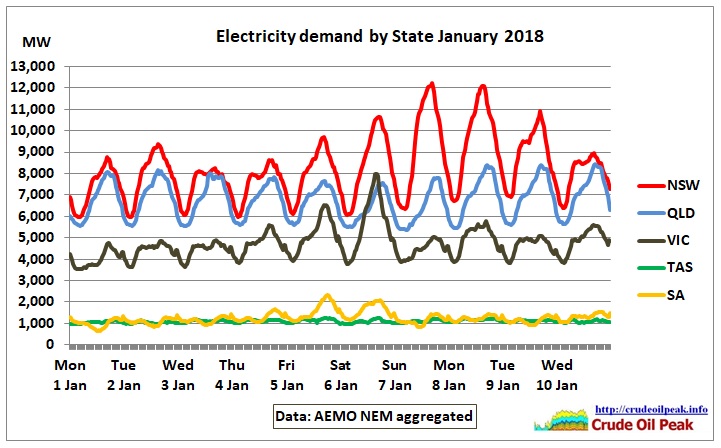 Fig 7: Demand for Electricity by State during the first 10 days of January 2018
Lucky East coast: the heat waves and therefore demand peaks came 2 days earlier in Victoria and South Australia. The demand peak differences between cool and hot periods were approximately 4,000 MW in NSW, 3,000 MW in Victoria, 1,000 MW in South Australia and 1,000 MW in Queensland. Tasmania was basically flat. It should be clear that the maximum load on the grid will come when there is a heatwave in 3 Eastern States.
The coal, gas and hydro generation data for Fig 3 are from the Renew Economy website as shown in the next graph:
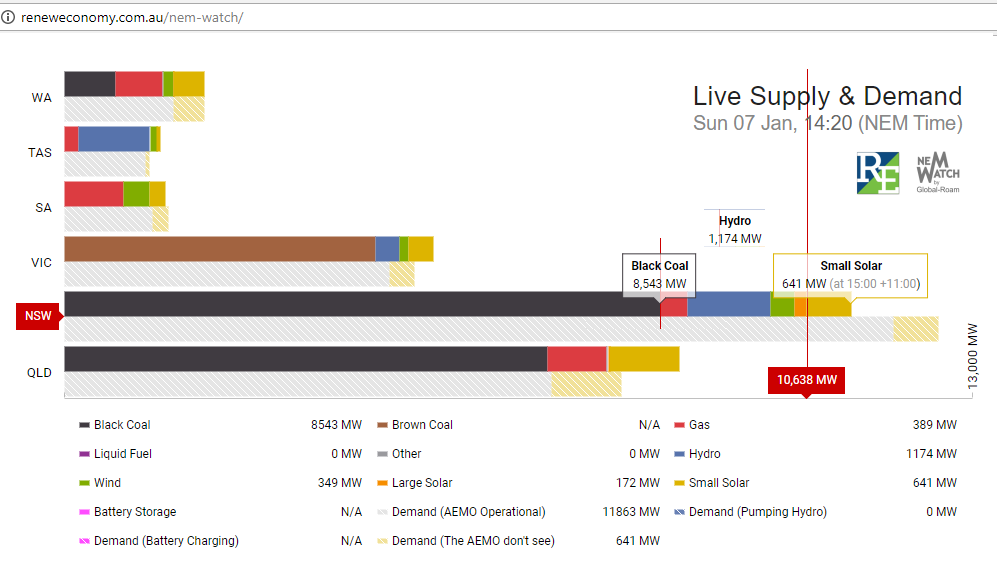 Fig 8: Power generation by type in Australian States on 7/1/2018
http://reneweconomy.com.au/nem-watch/
NSW power imports
Now let’s have a look at NSW power imports from Queensland and Victoria on that hot afternoon
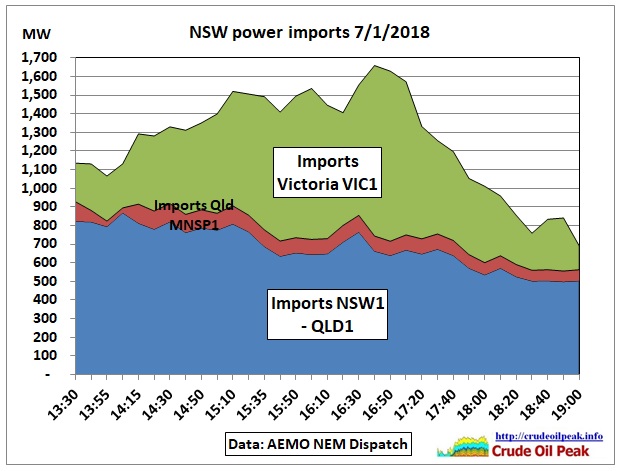 Fig 9: NSW power imports from neighboring states
Between Queensland and NSW, there are 2 interconnectors:
Terranora (N-Q-NSMP1)
Nominal capacity 210 MW, constrained by thermal limits
NSW1-QLD1
Nominal capacity 1,078 MW (w/o oscillatory stability control) limited by voltage collapse of largest Qld unit or trip of Lidell – Muswellbrook line
https://www.aemo.com.au/-/media/Files/Electricity/NEM/Security_and_Reliability/Congestion-Information/2017/Interconnector-Capabilities.pdf
Information on which constraints are in force at any one time is available under AEMO’s market notices.
https://www.aemo.com.au/Market-Notices
For example, on 7/1/2018 notices 60627/8 show that controls to vary the Terranora output were not available for 45 minutes.
Interconnector QLD1 was utilized at 869/1,078=81% on 7/1/2018.
Now let’s have a look at NSW power imports from Victoria. Where actually does it come from?
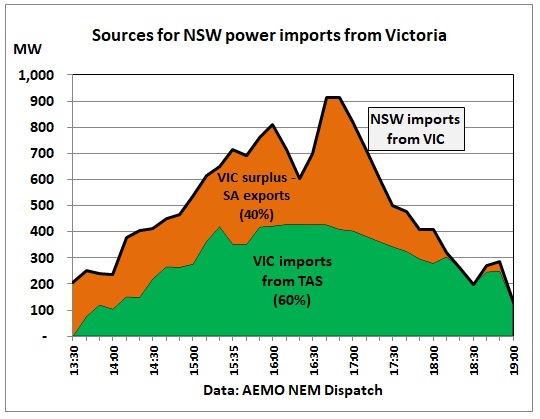 Fig 10: NSW power imports from Victoria by source
Only 40% of the power came from Victoria’s own generation i.e. the surplus of generation above demand and after deducting Victoria’s exports to South Australia. 60% came actually via Tasmania’s exports to Victoria.
The inter-connectors needed here are:
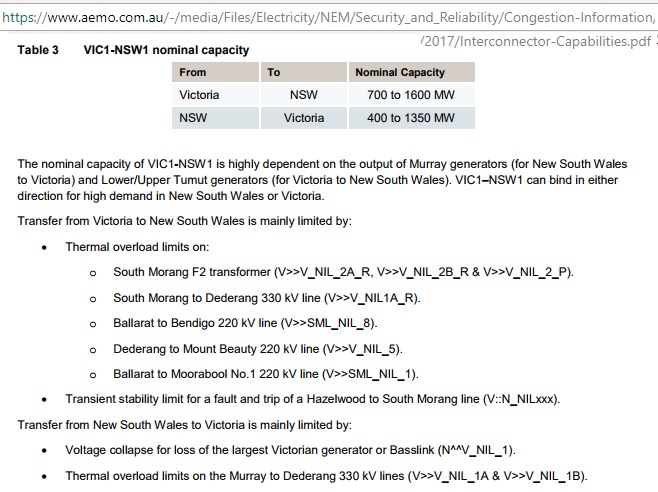 Fig 11: NSW – Victoria interconnector capacity
https://www.aemo.com.au/-/media/Files/Electricity/NEM/Security_and_Reliability/Congestion-Information/2017/Interconnector-Capabilities.pdf
The Victoria link was utilized at up to 68% on 7/1/2018
From Tasmania, there is Basslink:
T-V-MNSP1
George Town – Loy Yang, nominal capacity 594 MSW, constrained by South Morang F2 transformer overload or over voltage at George Town
The Basslink capacity was used by up to 72% on 7/1/2018
Generating capacities (coal)
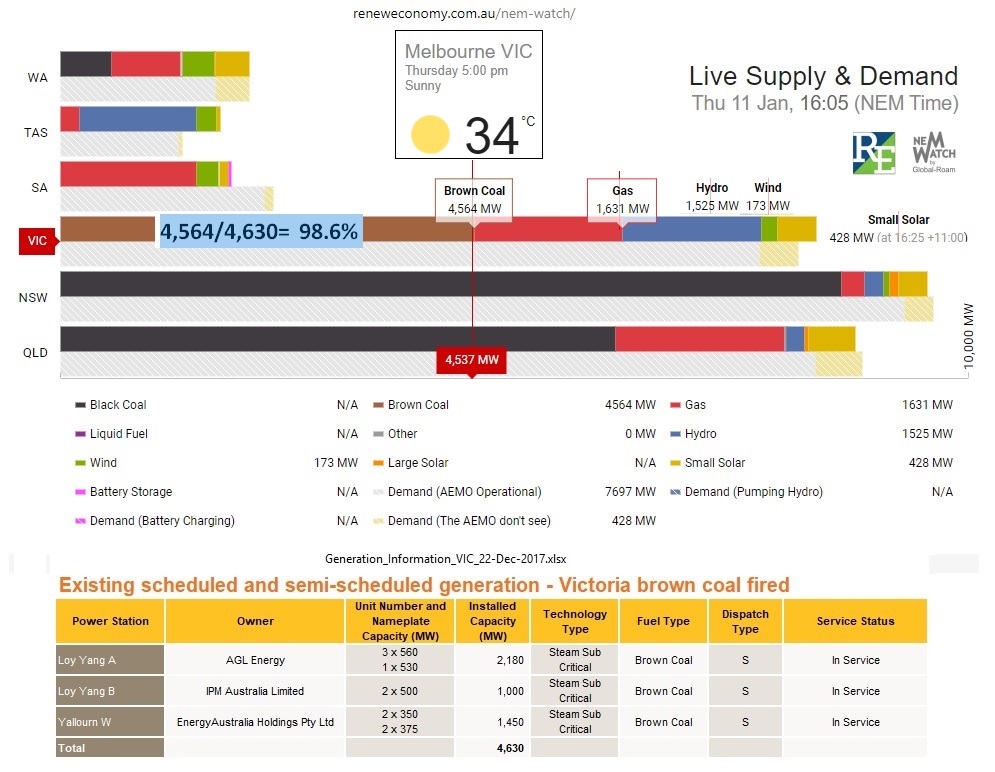 Fig 12: On hot days, Victoria’s name plate capacity of brown coal is fully utilized
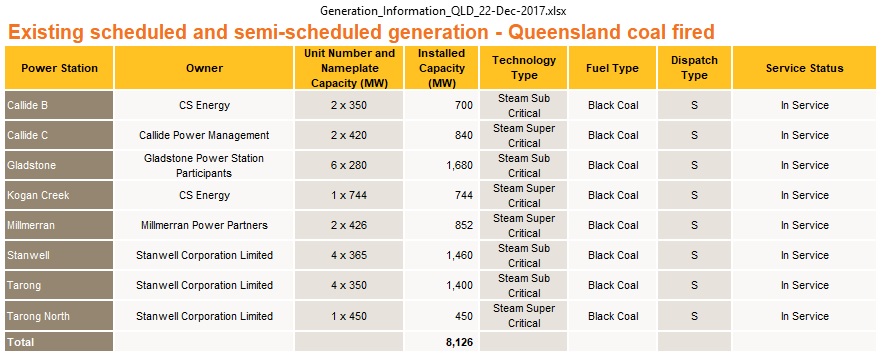
Fig 13: Queensland’s coal fired generation capacity (nameplate)
On 7 Jan 2018, 16:45 Queensland’s coal use was 7,075 MW, or 87% of nameplate capacity
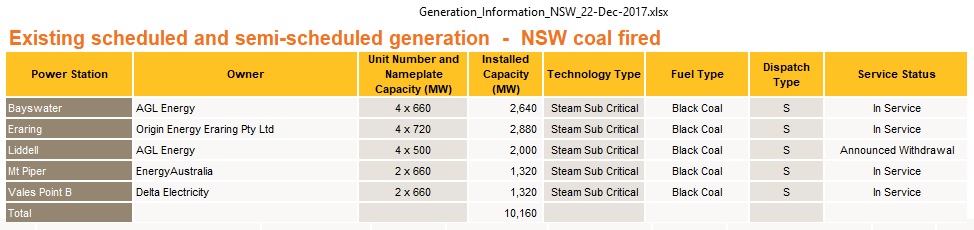
Fig 14: Name plate capacities of coal fired power plants in NSW
https://www.aemo.com.au/Electricity/National-Electricity-Market-NEM/Planning-and-forecasting/Generation-information
Max coal use was 8,606 MW/10,160 MW nameplate =85%
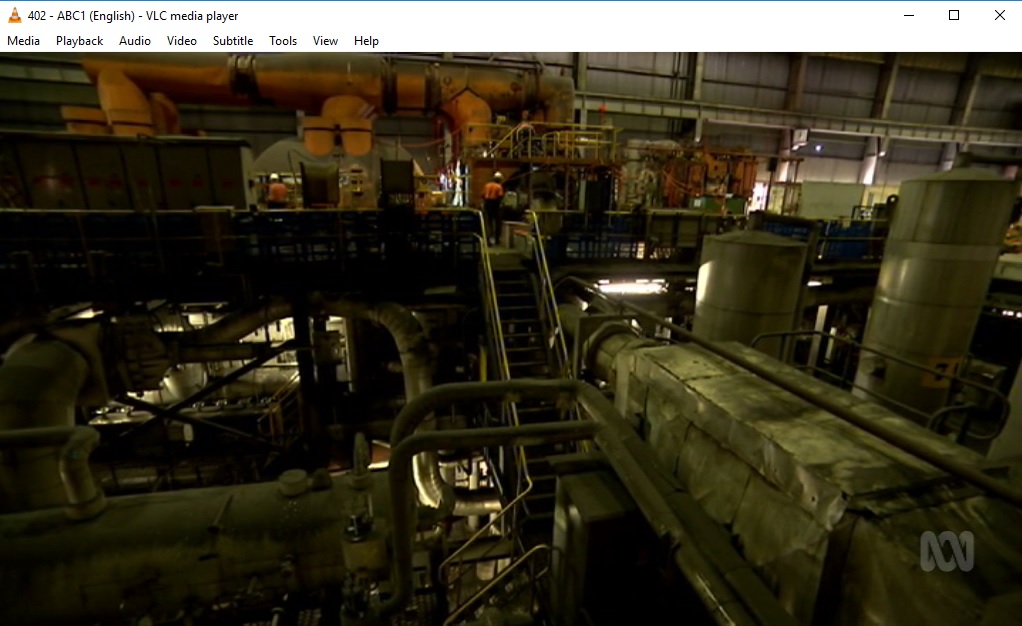 Fig 15: Liddell power plant (650 GWh/month = 900 MW in 2016)
Therefore, we need to reduce the NSW scheduled capacity for coal by 1,100 MW. This means on 7 Jan 2018, coal was maxed out by 8,606 MW / 9,060 MW = 95%. While that sounds good for accountants it’s not good for when other things go wrong. In fact, when one looks at Fig 3 the system could not hold 8,600 MW for very long. At 15:00 NEM time (16:00 AEST) coal generation suddenly dropped by 300 MW (see Addendum). Not gas, but hydro replaced this loss.
The problems with Liddell have been made public in recent months and became a political issue when Prime Minister Turnbull himself – under pressure from coal friendly Abbott supporters – tried to convince the owner AGL to continue running the plant beyond 2022, but AGL refused.
AGL rebuffs Malcolm Turnbull and commits to ditching Liddell power station for gas, wind and solar
9/12/2017
http://www.smh.com.au/federal-politics/political-news/agl-rebuffs-malcolm-turnbull-and-commits-to-ditching-liddell-power-station-for-gas-wind-and-solar-20171208-h01qn0.html
A detailed report on heatwave events by the Australia Institute was published in November 2017
Can’t stand the heat
The energy security risk of Australia’s reliance on coal and gas generators in an era of increasing heatwaves
http://www.tai.org.au/sites/defualt/files/P454%20Can%27t%20stand%20the%20heat%20FINAL%202.31_0.pdf
This report mentions the unavailability of gas, a problem which has emerged as conventional gas production on the east coast has peaked and coal seam gas is squandered in LNG exports. Details can be found in this post:
20/10/2017
Australia’s east coast gas crisis will be permanent
http://crudeoilpeak.info/australia-east-coast-gas-crisis-will-be-permanent
The belated response of the NSW government to load shedding in February 2017 was published by the Chief Scientist in December 2017, conveniently 2 days before New Year when everyone is celebrating and no attention is paid to government reports.
The report had indeed nothing to celebrate. Here is an excerpt:
Energy Security Taskforce
4.2.2.2 Risks to health and safety
A range of risks and vulnerabilities exist for the State’s essential services during a black system or
extended outage that need to be planned for and managed. These include:
Hospitals
• public hospitals in NSW have back-up diesel generators with fuel that would last a variable amount of
time, but would need new fuel delivered after six hours
• back-up generators would only be used to supply electricity to run core functions (ventilators, monitors, primary lighting). All elective surgeries would be cancelled, food and laundry services would cease, diagnostic equipment would not be used, healthcare records would not be fully accessed and the sterilisation processes would take up to three days to complete
• hospitals are reliant on air-conditioning systems for ventilation of the buildings, with many having fixed windows. In extended power outages, the room temperature in hospitals would increase and patients may need to be evacuated should conditions get critical for patient care and comfort
• hospitals would be under significant strain due to an increase in patients seeking services that may be unavailable elsewhere
• while the functions of hospitals would be reduced when operating on back-up generators, community expectations do not change. Communications would be needed to explain to the public that hospitals would be under significant strain and only urgent and life-threatened patients would be the priority.
Transport
• a widespread outage would halt all rail services in the Sydney Trains managed network (extending to Kiama, Macarthur, Broadmeadow and Lithgow) due to the fact the rail network is electric. Light rail services would also cease operation. During peak commute periods, there can be as many as 10,000 people on underground trains who may need to be evacuated. Assistance for evacuations from the rail network would be required from NSW Fire & Rescue and NSW Police. However, these emergency services may also be responding to other emergency situations such as people stuck in lifts in buildings
• road traffic will be affected as road tunnels would be closed and all tunnel traffic redirected to surface roads. Select CBD traffic lights would initially operate on UPS, with key metropolitan intersections
connected to deployable generators. The road network would be very congested which would place added stress on emergency services responding to incidents. Buses would provide a limited train replacement service. Buses would also be reliant on access to fuel during longer outages
• ferry services would be operable and could be used to move people from CBD areas. Ferries would have between 12 hours and one week’s fuel on board.
http://www.chiefscientist.nsw.gov.au/__data/assets/pdf_file/0019/136711/171219-MASTER-NSW-Energy-Security-Taskforce-report-FINAL-SIGNED.pdf
Not much is planned and managed. The Australia Institute recommended a “demand response” in addition to (p 13) battery storage, solar thermal and pumped hydro. But what is actually being done? More electricity hungry high rises and skyscrapers are being built in many suburbs. Example Parramatta.
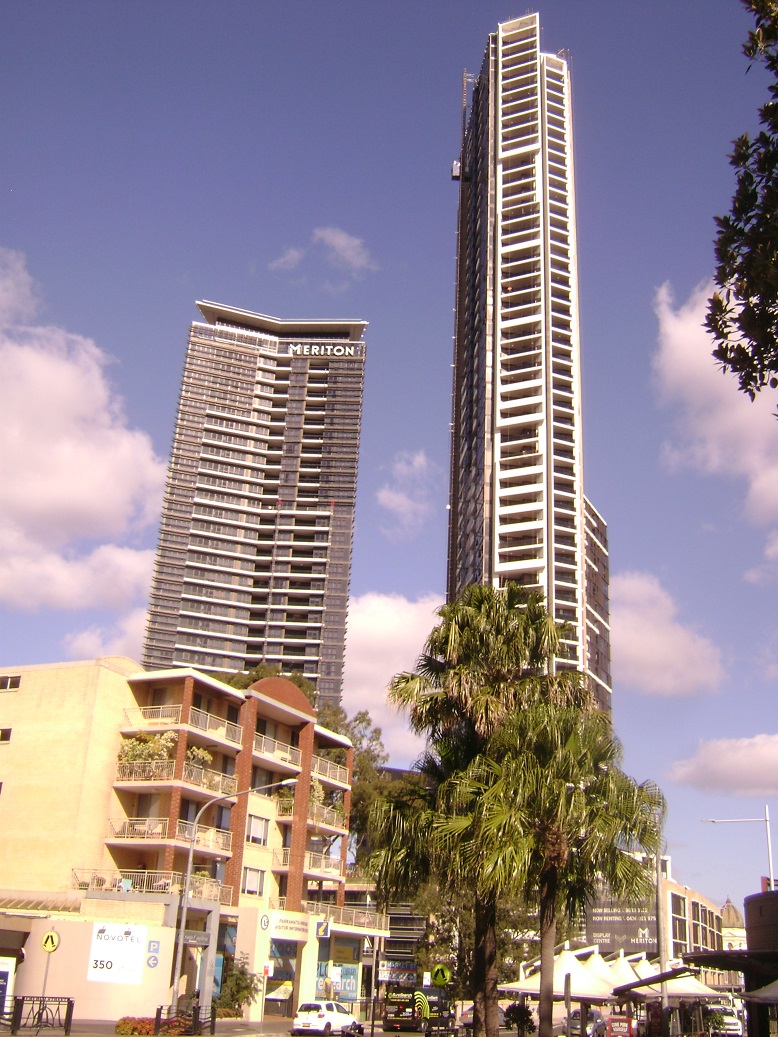 Fig 16: New, coal dependent residential towers in Sydney (Parramatta)
If all plans for the new Parramatta CBD are implemented, these towers will increase peak demand by more than 150 MW
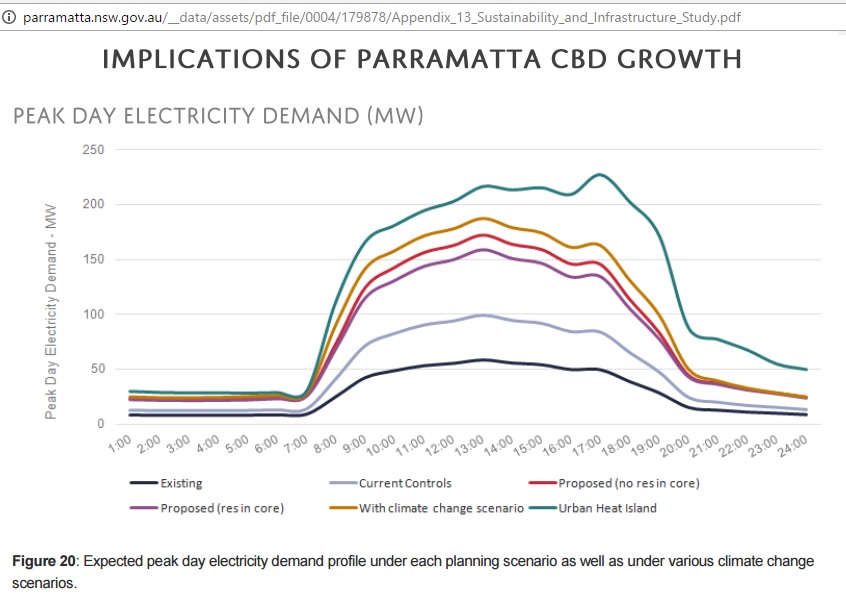 Fig 17: Skyscrapers and high rises increase peak demand
Let’s see how that fits into a grand plan to perpetually grow Sydney:
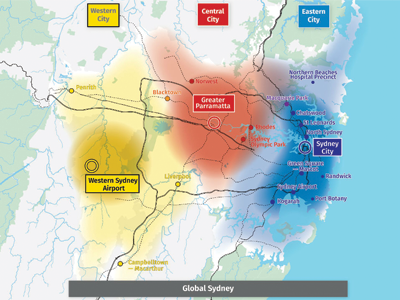 Fig 18: The Greater Sydney Commission’s fantasy to build 3 cities for 8 million by 2056
https://www.greater.sydney/draft-greater-sydney-region-plan
Note the 3rd city (yellow, mainly under the flightpath of the proposed 2nd Sydney airport) lies in the hot West with the highest temperatures in the Sydney basin (see Fig 2).
The “planning” could not be more climate and energy illiterate. The CEO of the Sydney Greater Commission is Lucy Turnbull, the wife of Australia’s Prime Minister!
Near Term Outlook
Save, baby, save – for the demand peak
November 2017
AEMO published a report titled “Summer operations 2018” which lists additional generating capacities and savings (called demand response):
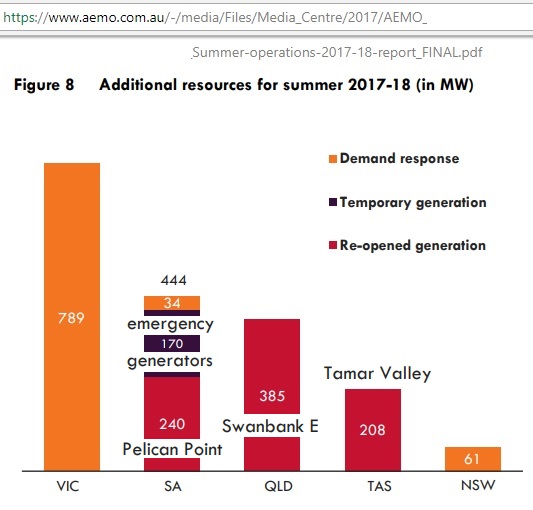 Fig 19: AEMO’s Rescue efforts
1. South Australia’s Pelican Point Power Station returned to full capacity 240 MW
2. Queensland Government directed Stanwell Corporation to return its Swanbank E Power Station to service 385 MW
3. Tasmania’s Tamar Valley combined cycle gas turbine 208 MW
Total market generation previously mothballed gas plants: 833 MW
Reliability and Emergency Reserve Trader (RERT)
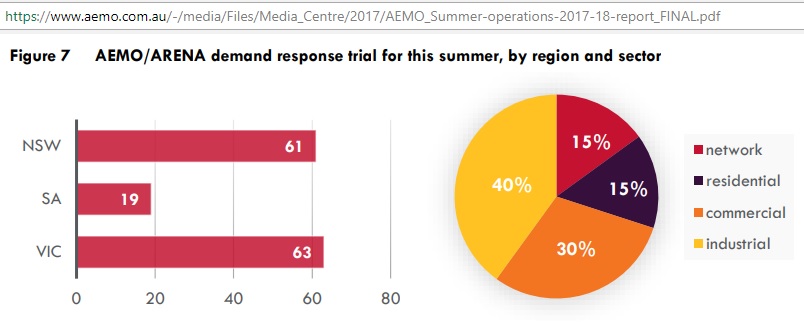 Fig 20: Energy users volunteer to conserve energy for short periods in exchange for incentives 143 MW
For Victoria’s demand response 741 MW no details are given in the report.
South Australian Government’s emergency generators, 170 MW
https://www.aemo.com.au/Media-Centre/AEMO-releases-summer-readiness-report-for-2017-18
Conclusion
New South Wales is the Premier State in energy deficits and utterly depends on power imports from the neighboring States of Queensland and Victoria – which in turn has to import power from Tasmania. The capacity of Victoria to export power has been reduced after the closure of Hazelwood in March 2017 (around 1,100 MW). Although AEMO and all operators have prepared for this change the power supply system without Hazelwood has not been tested yet in a hot summer (February after school holidays), especially if there are any additional problems like storms and fires which could damage or bring down vital transmission lines needed for NSW’s power imports.
Recently, Government Ministers brought and displayed lumps of coal in Parliament, telling MPs they should not be afraid of it. Australia’s continuing inability to develop a stable, bi-partisan climate change policy for the last 10 years has led to uncertainties how aging coal fired power plants are to be replaced and when. This had a negative impact on the long-term maintenance planning for these power plants which have become unreliable. Given that they are running at high utilization rates there are serious doubts about whether the system will cope with simultaneous heatwaves in Queensland, NSW and Victoria.
Related posts:
20/10/2017
Australia’s east coast gas crisis will be permanent
http://crudeoilpeak.info/australia-east-coast-gas-crisis-will-be-permanent
14 Feb 2017
NSW’s privatized giveaway coal plant causes load shedding in extreme weather
http://crudeoilpeak.info/nsws-privatized-giveaway-coal-plant-causes-load-shedding-in-extreme-weather
Other useful links:
Electricity map
http://energyconsumersaustralia.com.au/connect/electricity-map/
International generation statistics
http://data.reneweconomy.com/LiveGen
Australia Institute gas and coal watch
http://tai.org.au/gas-coal-watch
AEMO PARTICIPANT REGISTRATIONS LIST
http://www.whit.com.au/aemo-registered-participants/
Addendum
Eraring Unit 3 power loss 275 MW on 7/1/2018
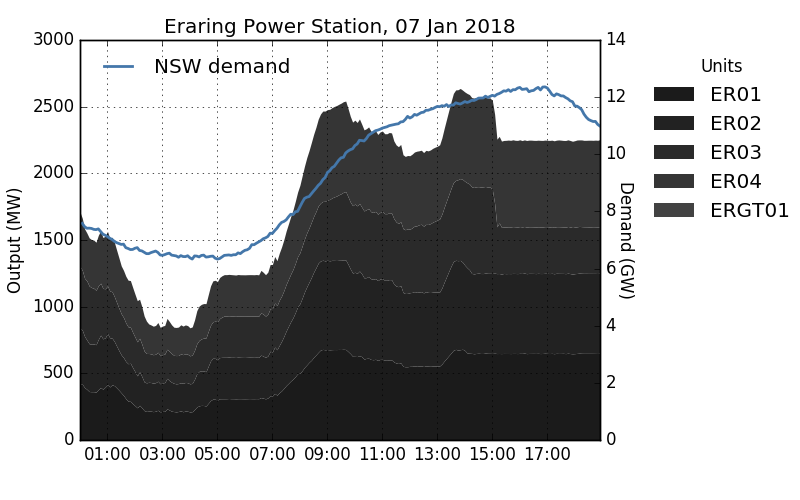 Fig 21 Eraring generation profile by unit
http://tai.org.au/content/decrease-eraring-2018-01-07