Tight power supplies in NSW 14 Dec 2013
 Fig 1: Warning to reduce electricity use
A severe early summer heatwave across New South Wales is bringing the hottest weather since 2020 to many parts of the state.
Prelude
Sat 9 Dec 2023
The heatwave had started
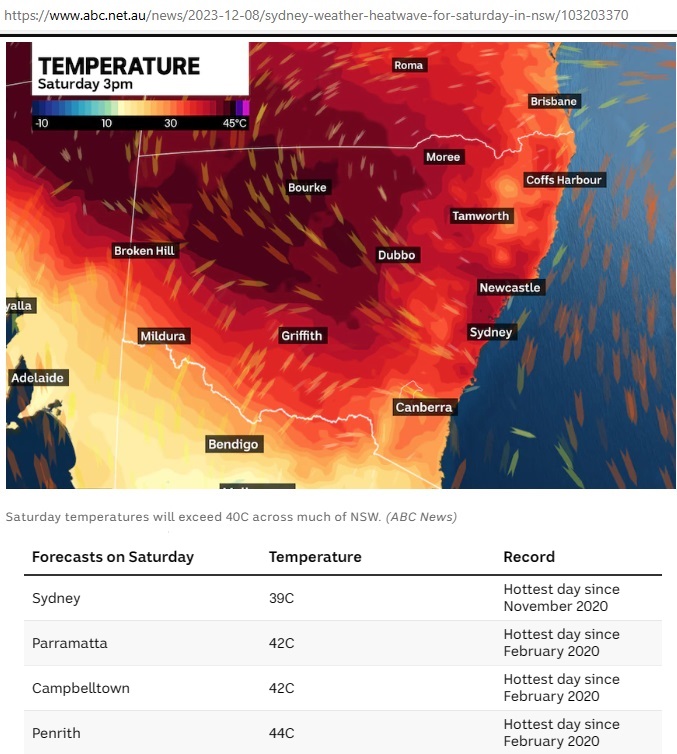 Fig 2: Temperatures in NSW 9th December 2023
https://www.abc.net.au/news/2023-12-08/sydney-weather-heatwave-for-saturday-in-nsw/103203370
On that day there was an actual lack of reserves LOR1 notice at 5:16 pm (#112137) which ended at 6:50 pm (#112154). Lucky it was a Saturday when power consumption is lower than on a weekday.
11 Dec 2023
Unit MP2 (700 MW) of the Mt Piper coal fired power plant suffered a boiler tube leak and was shut down. https://www.energyaustralia.com.au/about-us/media/news/operations-update-19-december-2023
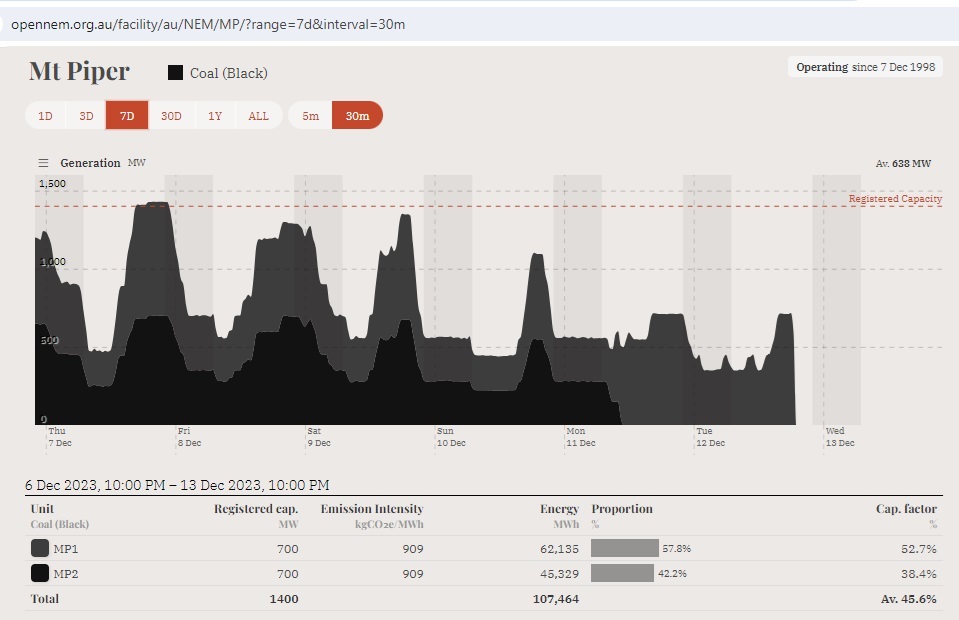 Fig 3: MP2 broke down on 11 Dec 2023
12 Dec 2023
AEMO gets worried about the power supply on 14th December:
112200 RECALL GEN CAPACITY 12/12/2023 11:01:01 AM
Request for Generator Recall Information for 14/12/2023 for NSW Region
AEMO ELECTRICITY MARKET NOTICE
Refer to AEMO Electricity Market Notice no. 112198.
Please provide Generator Recall Information for the period 14/12/2023, by 1200 hrs on 13/12/2023 via the Generator Recall communication system, in accordance with clause 4.8.5A of the National Electricity Rules.
SO_OP_3719 Procedure for Submitting Generator Outage Recall Information is available at:
https://aemo.com.au/-/media/files/electricity/nem/security_and_reliability/power_system_ops/procedures/so_op_3719-procedure-for-submitting-recall-information-scheduled-generator-outages.pdf
Procedure on how to use Generator Recall in the EMMS Markets Portal is available at
http://www.aemo.com.au/-/media/Files/Electricity/NEM/IT-Systems-and-Change/2018/Guide-to-Generator-Recall-Plans.pdf
AEMO Operations
https://aemo.com.au/Market-Notices/112200
12 Dec 2023
Open NEM reporting of all east coast generation (both by facility and type of fuel) stopped working on these websites:
https://opennem.org.au/facilities/au/?status=operating
https://opennem.org.au/energy/nem/?range=7d&interval=30m&view=discrete-time
So the public had no way of knowing what was going on. The bug was removed on 14 Dec in the morning but reappeared at 2:30 pm on that day. During the crucial afternoon hrs. there was a data black-out. Only the (estimated) exports to the grid from PV rooftop panels were shown.
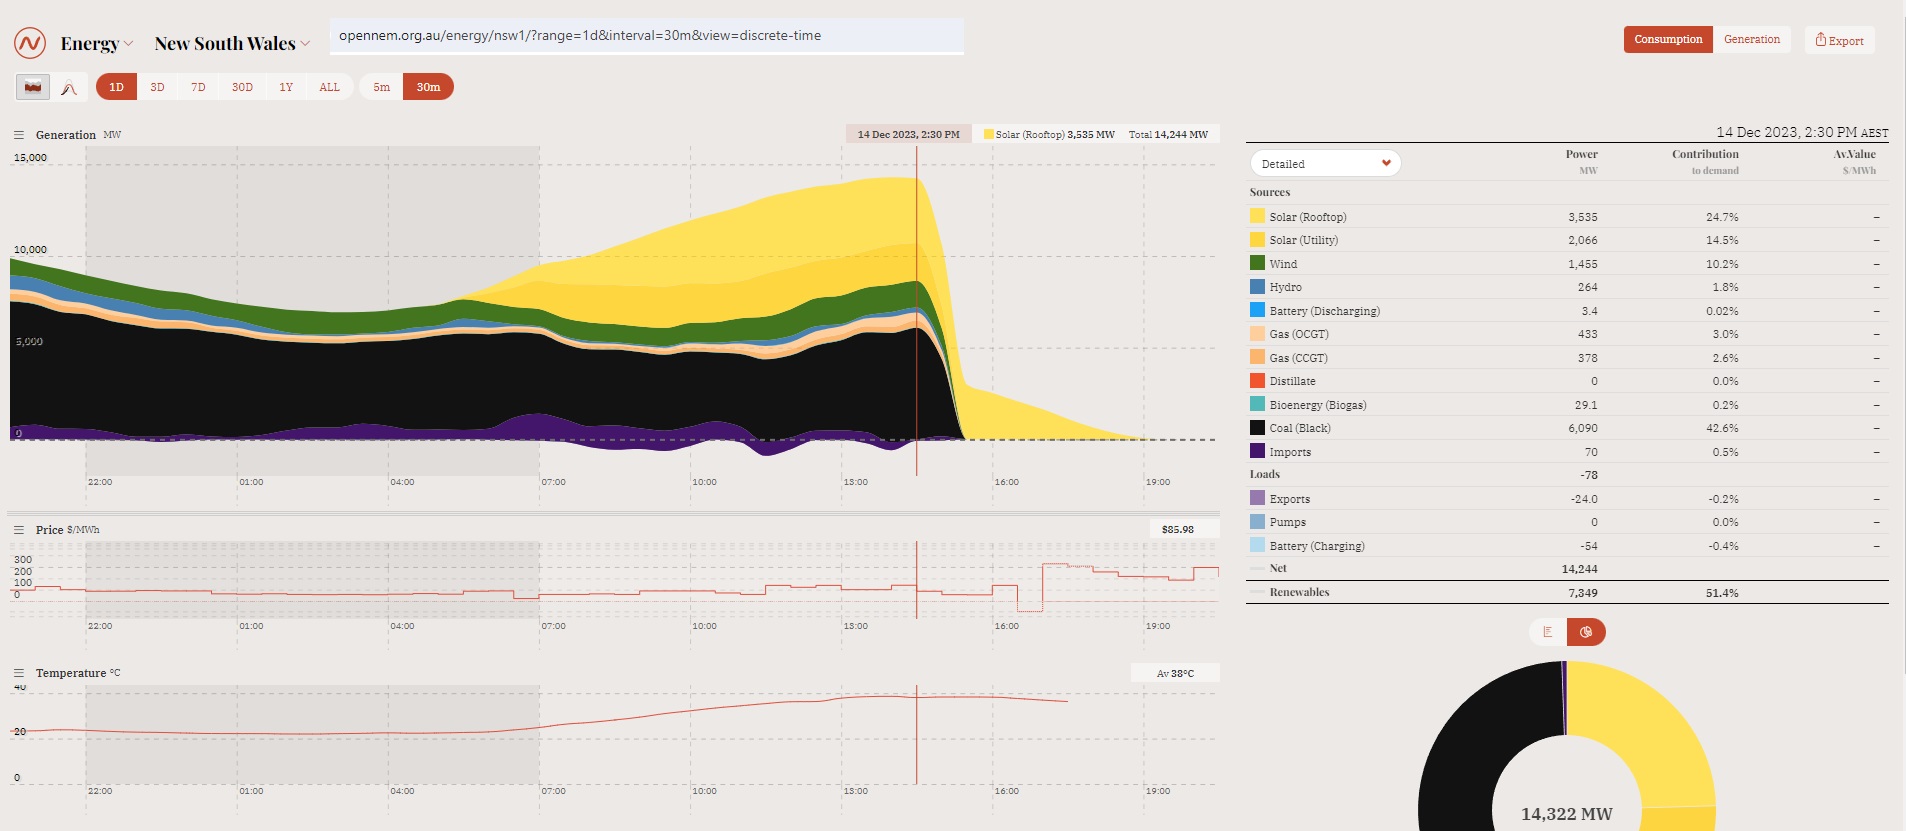 Fig 4: Regular reporting of NEM data stopped 12th Dec
Weather context
 Fig 5: Synoptic on Thursday, 14th December 2023
Along a trough line a lot of hot air is piling up along the east coast. A high pressure system offshore also pushes warm air from Queensland along the coast southwards so there is no cooling sea breeze.
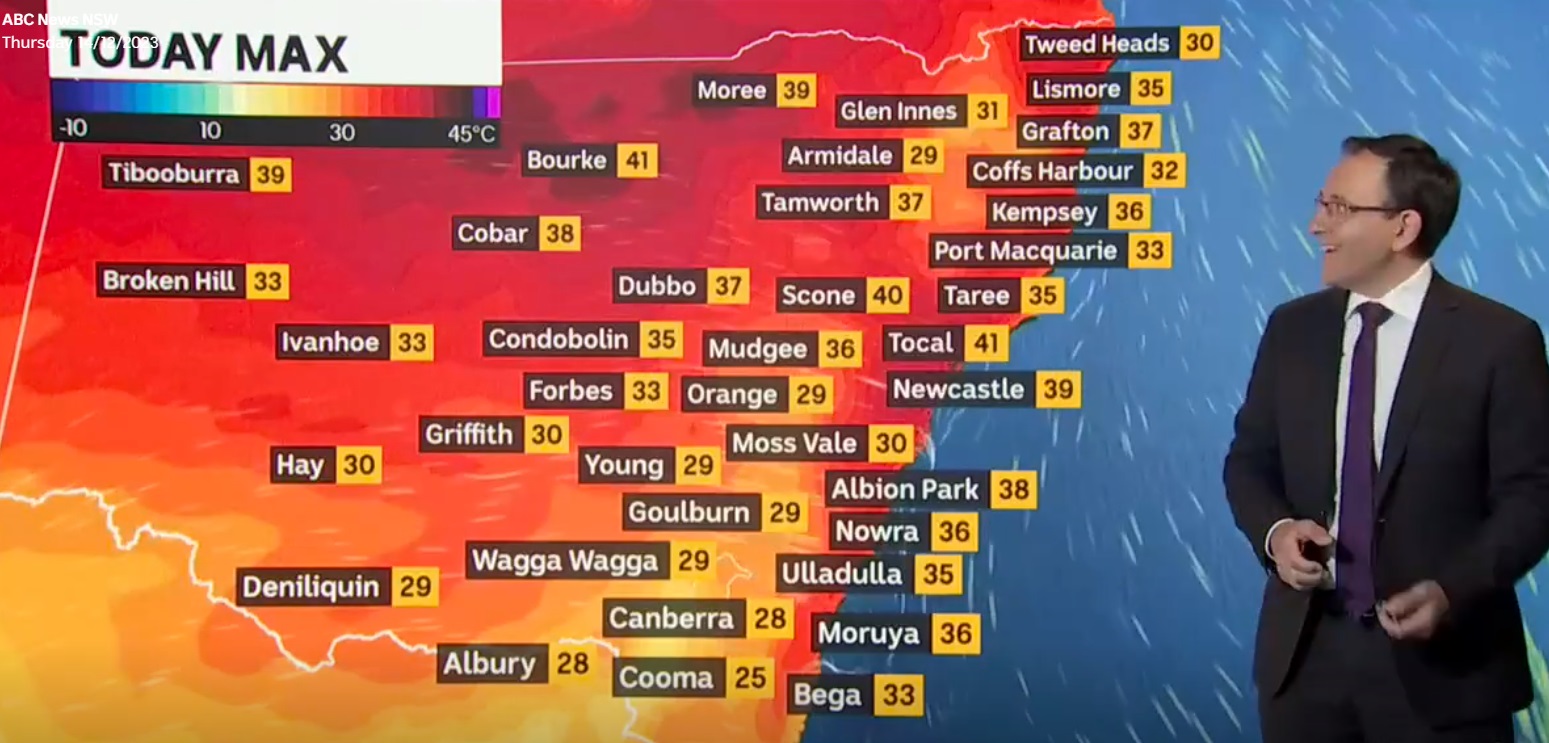 Fig 6: Temperatures in NSW on 14 Dec 2023
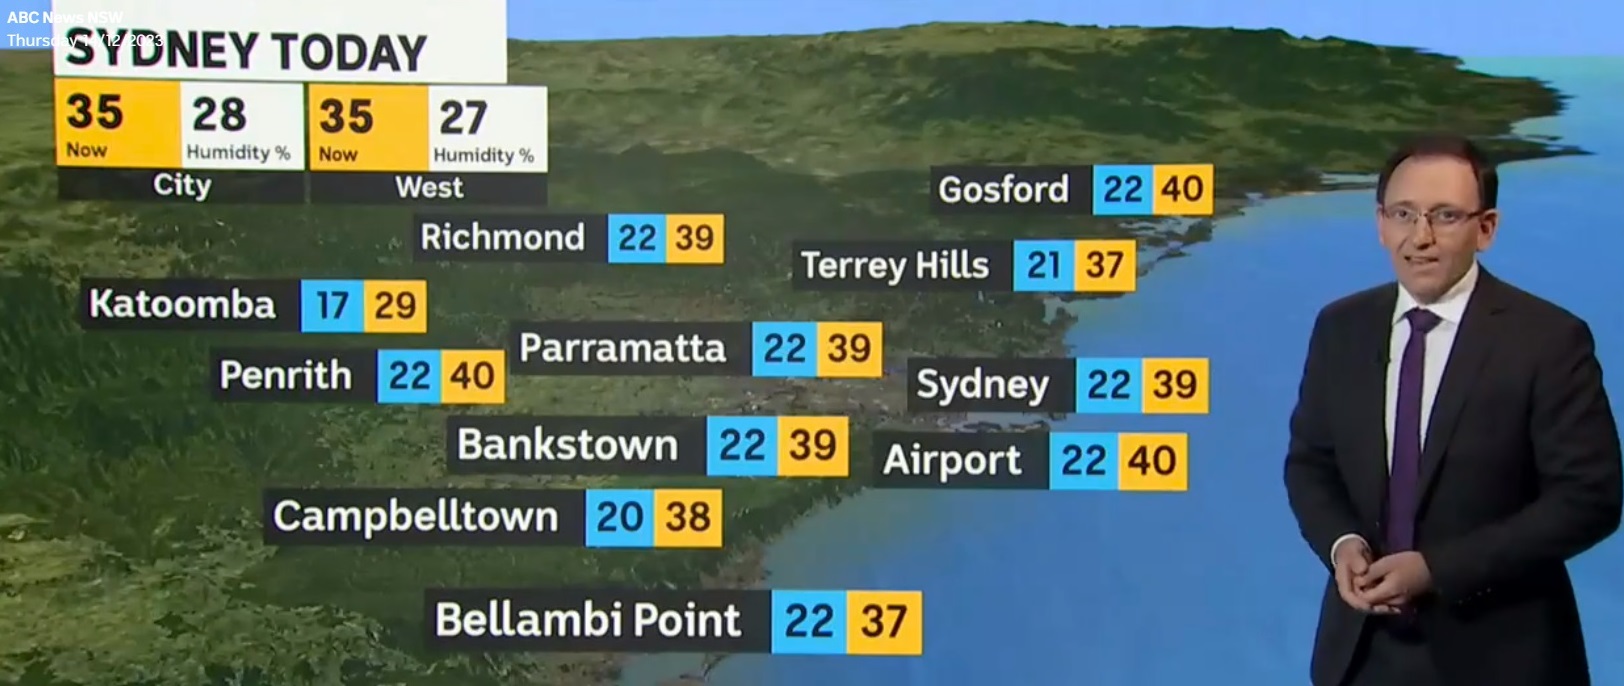 Fig 7: Temperatures in Sydney suburbs on 14 Dec 2023
Source: https://iview.abc.net.au Unfortunately, these videos expire after 1 week.
History of lack of reserve notices 14th December
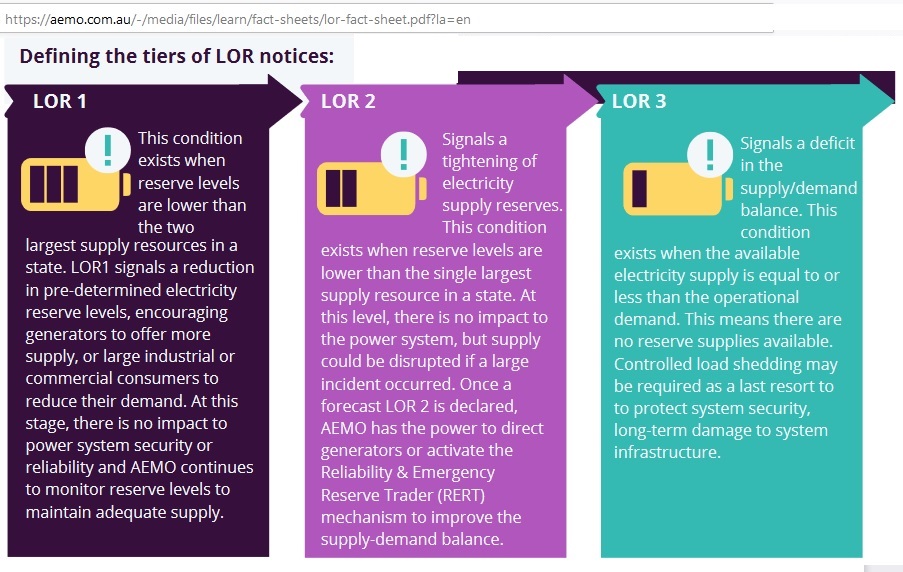 Fig 8: AEMO definitions of 3 tiers of lack of reserves
There were numerous lack of reserve warnings. The first LOR1 warning (#112042) came on 7th Dec., 1 week earlier. In the following graphs we only look at the 3 days 12-14 Dec.
 Fig 9: Forecast lack of reserve LOR1 notices over 3 days
These are forecast LOR1 notices issued at the dates/times on the horizontal axis for the 14th December between 3pm and 8 pm. We see that the difference between required reserves and available reserves did not improve. However, an actual LOR1 did not occur. The battle was rather with LOR2.
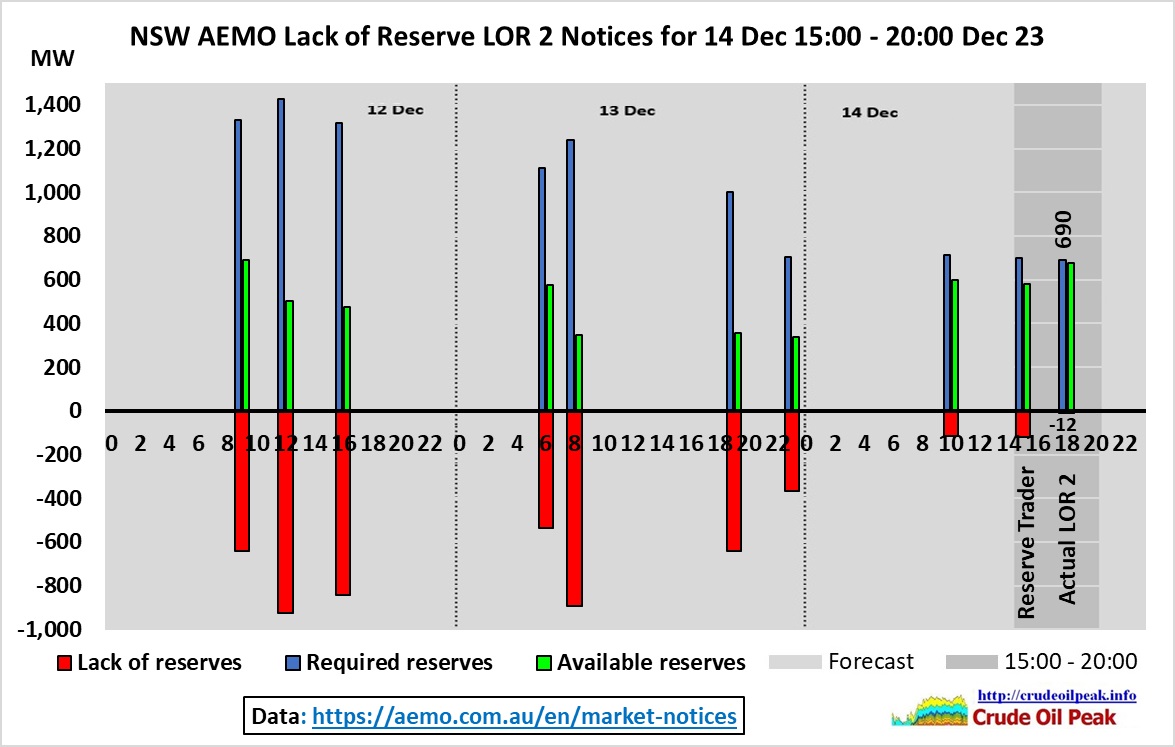 Fig 10: Forecast lack of reserve LOR2 notices over 3 days
These are 9 forecast LOR2 notices (including updates) issued at the dates/times (12th-14th Dec) on the horizontal axis for the critical period between 3pm and 8 pm on the 14th. The left most column on the 12th at 9 am was an update of the first notice (#112190) in this series which started on the 11th 17:34 hrs. So there were 2.5 days to prepare. Yet, the 14th started with a forecast lack of 366 MW. By 14:53 the problem had not been resolved with 121 MW still lacking (notice #112328).
At the last moment, at 15:29, AEMO intended to start negotiations on additional reserves:
112333 MARKET INTERVENTION 14/12/2023 03:29:11 PM
INTENTION TO COMMENCE RERT CONTRACT NEGOTIATIONS
AEMO ELECTRICITY MARKET NOTICE.
Reliability and Emergency Reserve Trader (RERT) Intention to negotiate for additional reserve – NSW1 Region- 14/12/2023
Refer to AEMO Electricity Market Notice no. 112328.
AEMO intends to commence negotiations with RERT Panel members for the provision of additional reserve by issuing requests for tender for the following period of time;
15:30 to 19:30 hrs 14/12/2023
If reserve is required, the period of activation or dispatch will be within this period but may not be for the entire period.
AEMO will issue a further advice if reserve is contracted.
https://aemo.com.au/Market-Notices/112333
An actual LOR2 happened at 17:30 for only half hour. If at that time a large unit of 690 MW (eg. 1 unit in Eraring) had failed there would have been a shortfall of 12 MW. Small, but nevertheless. The available reserve was 678 MW or 5.2% of the demand of 13,000 MW. Would you drive a 1980 VB Commodore with just 3.2 liters in a 63 liters tank to get to the next filling station?
Next day, alerted by this Wattclarity article https://wattclarity.com.au/articles/2023/12/14dec-rert-contracted/
we find that AEMO had indeed entered into a RERT contract but did not activate it.
112370 MARKET INTERVENTION 15/12/2023 07:42:53 AM
ENTERED INTO RERT CONTRACTS
AEMO ELECTRICITY MARKET NOTICE.
AEMO Intervention Event, Reliability and Emergency Reserve Trader (RERT) – NSW1 Region – 14/12/2023
Refer to AEMO Electricity Market Notice no. 112333.
AEMO has entered into a reserve contract to maintain the power system in a Reliable operating state during the following period of time;
15:30 to 19:30 hrs 14/12/2023
The latest time to activate or dispatch these reserves has now passed. No reserve contracts were activated or pre-activated.
https://aemo.com.au/Market-Notices/112370
This graph shows the timelines of LOR1 and LOR2 notices together:
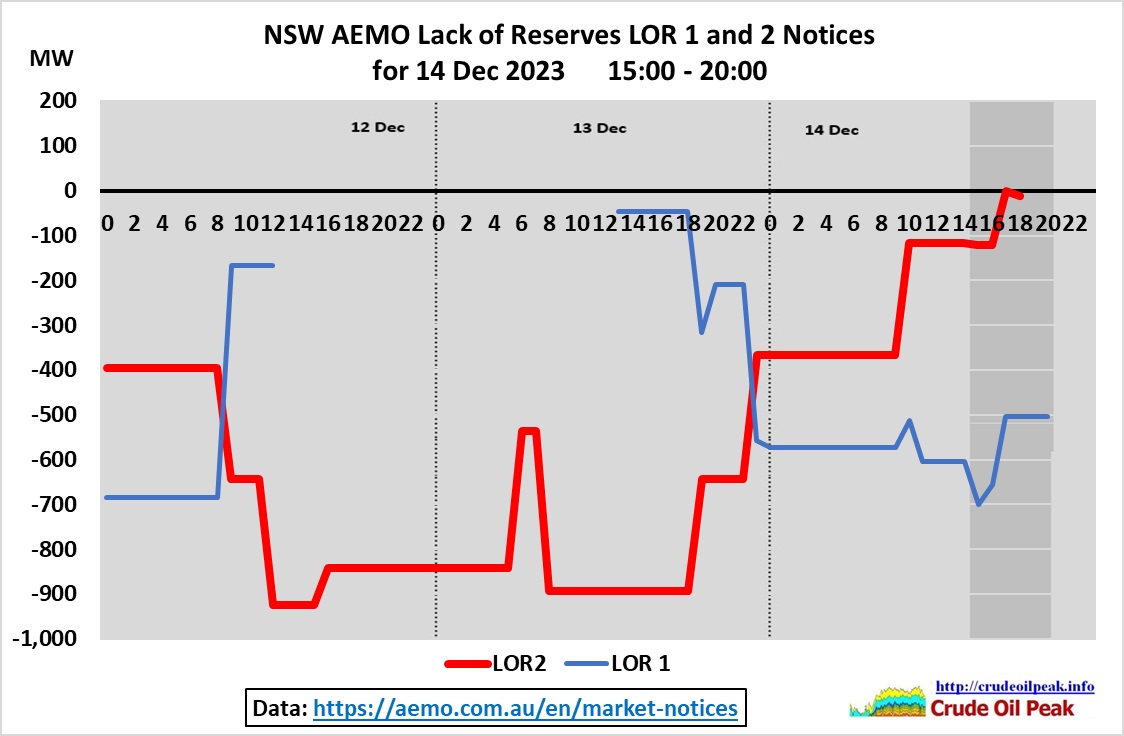 Fig 11: Forecast lack of reserve LOR1 and LOR2 notices over 3 days
This graph shows the simultaneous occurrence of both LOR1 and LOR2 notices and their timelines.
 Fig 12: Spot prices on 14th Dec
The average spot price before the peak was $75/MWh. This surged during the peak demand period (16:30 – 20:30) to $257/MWh, lifting the daily average to $115/MWh, a 53% increase. That is how expensive additional peak demand is.
Generation data
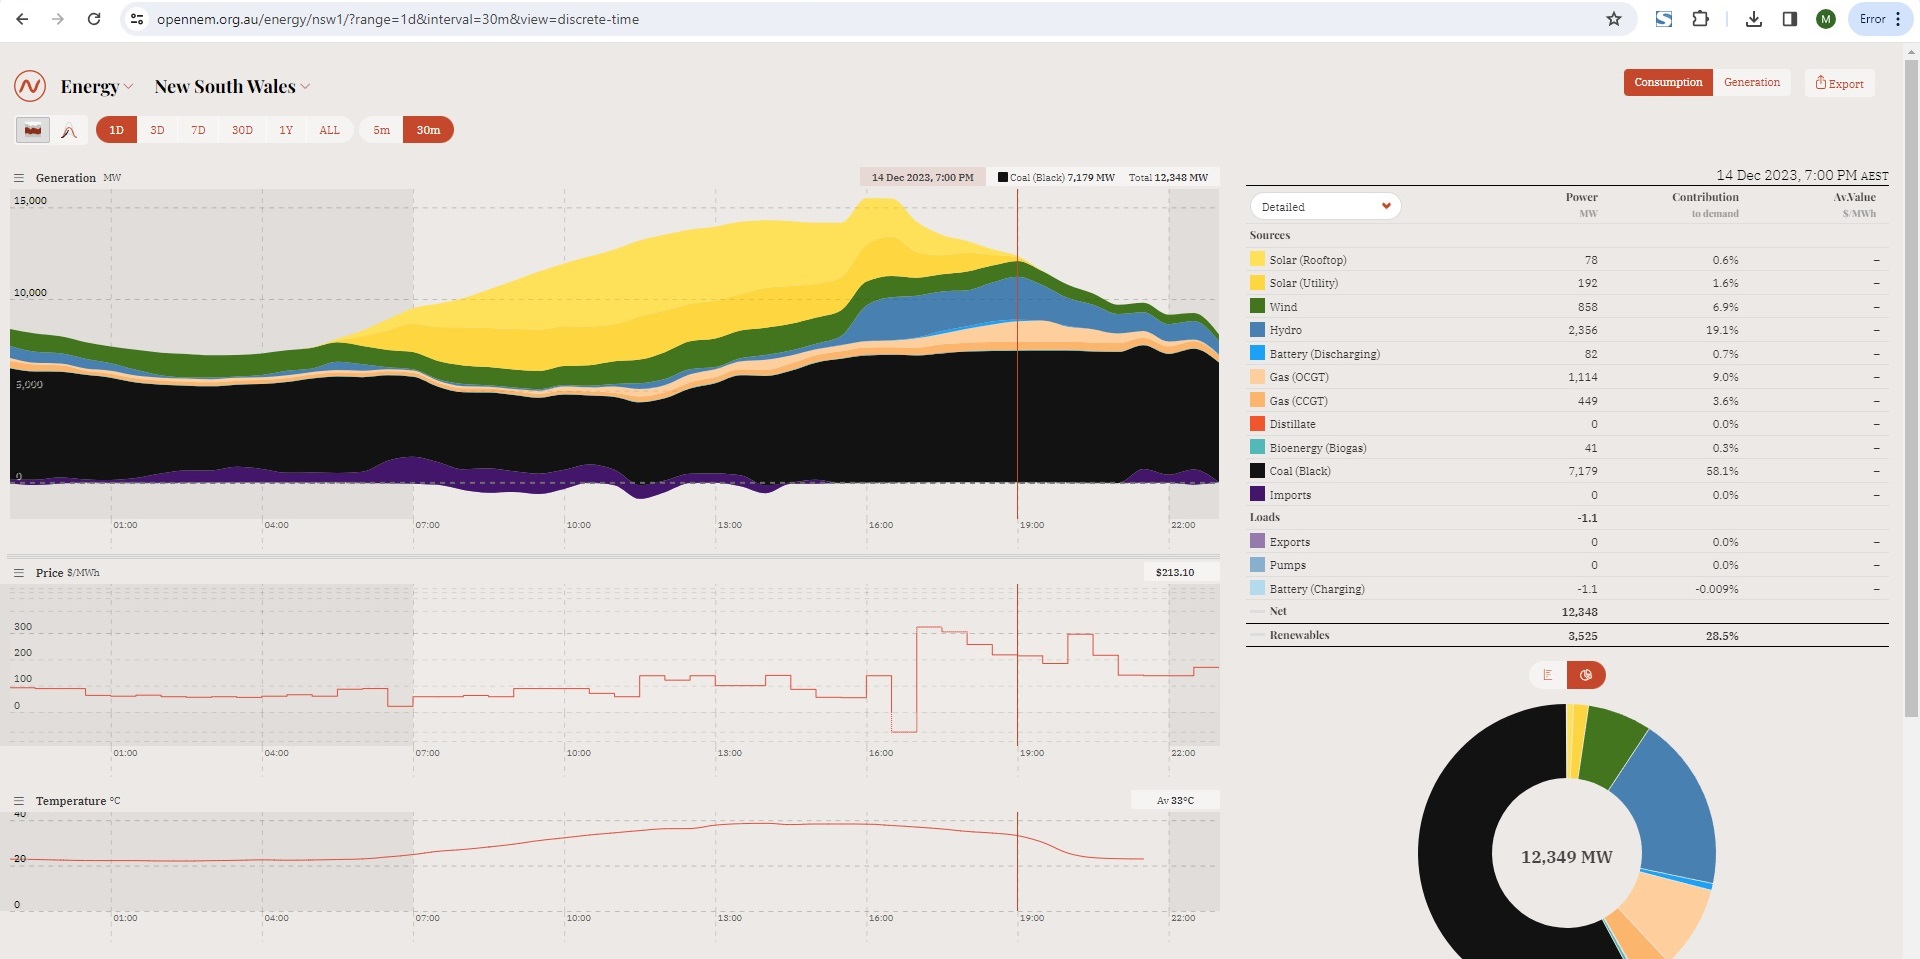 Fig 13: Screen shot of the NEM website 14th Dec 11 pm after reporting resumed
Note the absence of imports/exports after 2 pm (reporting error) and the hump around 4 pm which will be explained later..
Coal generation was steady and reached around 7,000 MW by 4 pm, slightly increasing to 7,200 MW by 8 pm. That was very close to the maximum achievable in this period of 7,248 MW
4 units Bayswater 2,650 MW
4 units Eraring 2,688 MW
2 units Vales Point 1,205 MW
1 unit Mt Piper 705 MW
Total 7,248 MW
Hydro
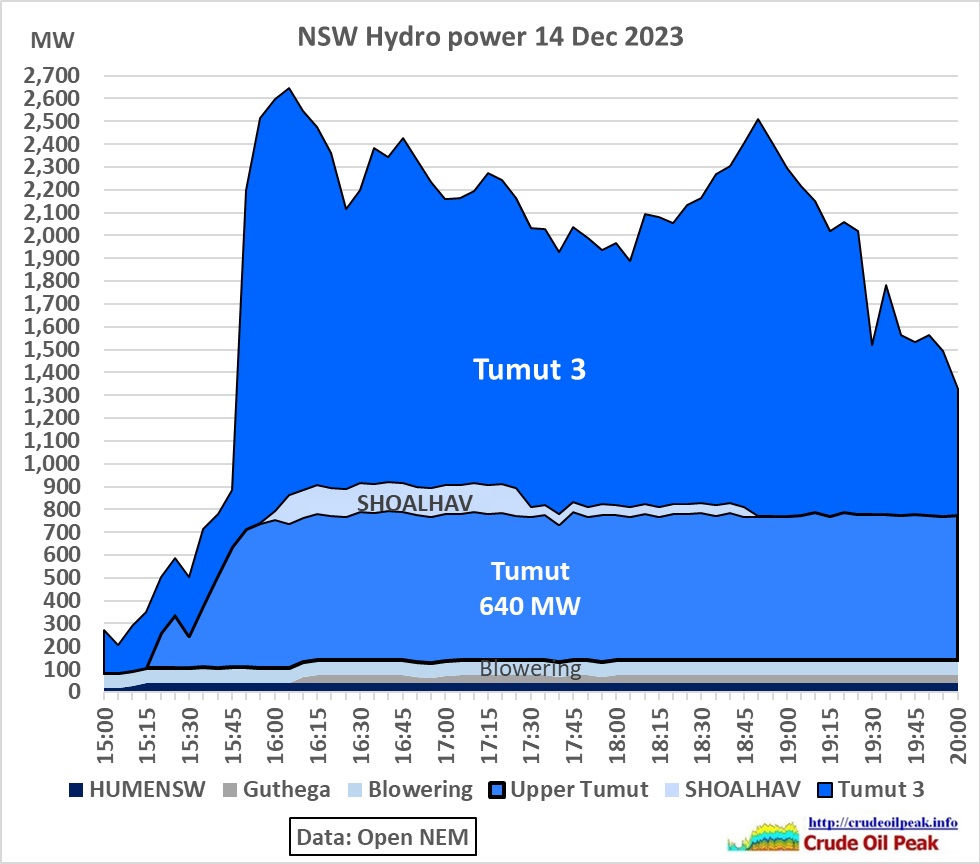 Fig 14: Hydro power with 2 peaks
NSW hydropower generation was 2,500 MW during the evening peak, practically at registered capacity of 2,545 MW. As for the afternoon peak at 4 pm, see the details on exports below.
Gas
 Fig 15: Gas fired power
NSW gas powered generation was 1,610 MW, 86% of capacity (Tallawarra 440 MW, Colongra 724 MW, Uranquinty 664 MW, Smithfield 39 MW – rarely used)
Wind
 Fig 16: Wind power
Generation from wind power dropped from around 1,300 MW to 700 MW
Solar Utility
 Fig 17: Output from NSW solar farms
There was a sharp drop of around 900 MW after 16:20 over 25 min. by following solar farms:
![]() Fig 18: Location of 5 solar farms in the West Murray Region
Fig 18: Location of 5 solar farms in the West Murray Region
https://www.transgrid.com.au/media/zfcmn02k/tapr_2023_v9_final.pdf
All these 5 farms lie in the same area west of Wagga Wagga connected to transmission lines going to Broken Hill.
| Solar Farm | Identifier | Location | Drop
(MW) |
Reg. Capacity
(MW) |
| Limondale | LIMOSF1 | Balranald | -196 | 275 |
| Sunraysia | SUNRSF1 | Balranald | -187 | 228 |
| Darlington Pt | DARLSF1 | Darlington Pt | -243 | 324 |
| Coleambally | COLEASF | Coleambally | -130 | 180 |
| Avonlie | AVLSF | Narrandera | -175 | 245 |
| 5 SFs | -931 | 1252 |
We don’t know whether the generation drop was due to cloud cover or some transmission/network problems as addressed in this project proposal of 2022, costing up to $285m:
https://www.transgrid.com.au/media/tinisujc/transgrid-pacr_improving-stability-in-sw-nsw.pdf
Role of batteries
 Fig 19: Batteries discharging compared to solar generation
5 batteries discharged up to 180 MW over 2 hrs (around 73% of registered storage capacity). It helped but did not replace falling solar generation which would require a growing, triangular discharging profile. Nevertheless, battery output was 17% of solar generation of 1,650 MWh after 5 pm. We are a long way from offsetting solar power in the afternoon/evening.
To be continued: power imports/exports