Liddell outages, load shedding at the Tomago alu smelter and reduced power imports from Queensland after the generator fire at Callide have caused price spikes in NSW which mean that NSW power consumption has reached unsustainable levels under certain circumstances..
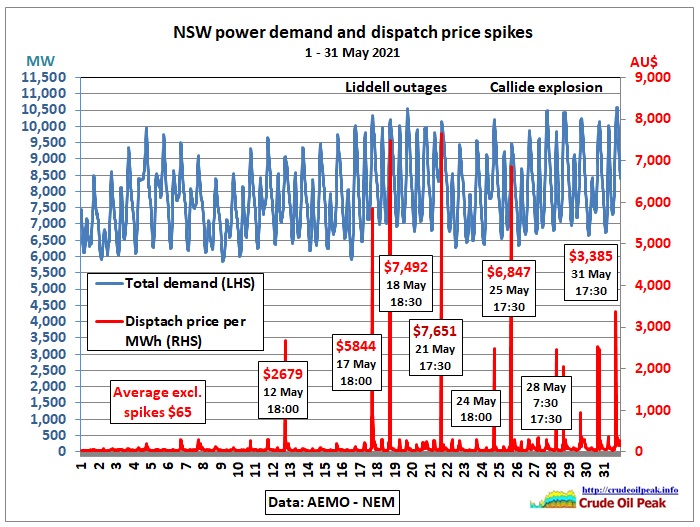 Fig 1: NSW price spikes in May 2021in 30 min intervals
(Average price calculated from all spot prices <$300/MWh (97.7% percentile), not volume weighted)
Data are from here: https://www.aemo.com.au/energy-systems/electricity/national-electricity-market-nem/data-nem/aggregated-data
Note that the Australian Energy Regulator publishes reports for prices above $5,000.
Let’s look for the causes of these price spikes
Liddell Outages
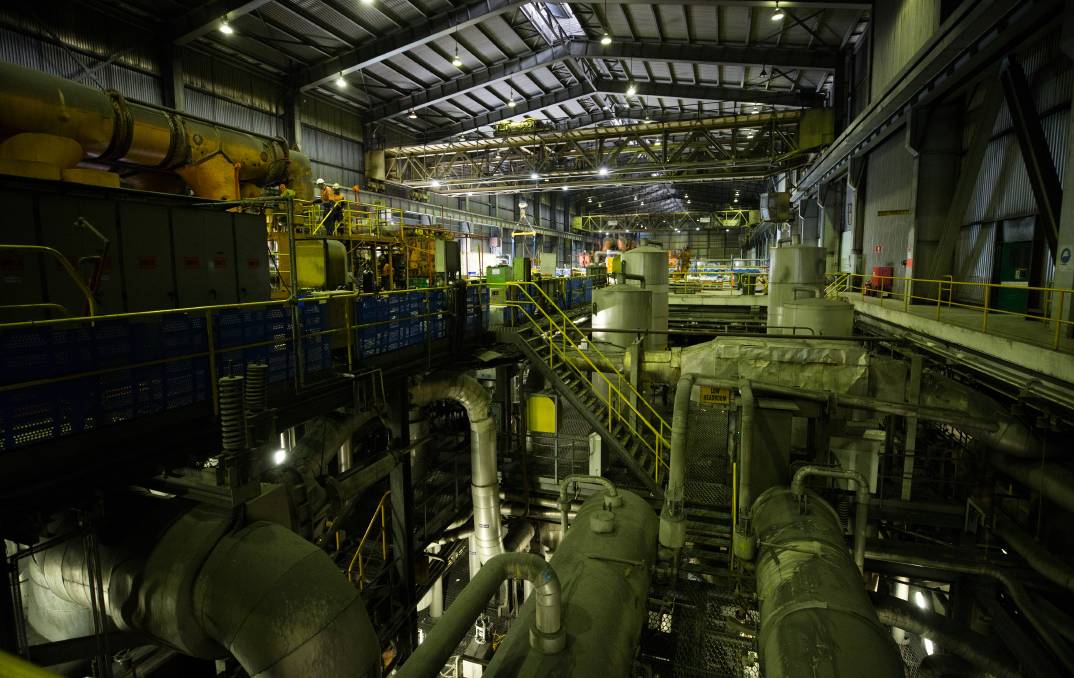 Fig 2: Liddell turbine hall
Liddell has 4 units with a reduced maximum capacity of 400 MW each, originally 500 MW in the commissioning years 1971 (1 unit), 1972 (2 units) and 1973 (1 unit). This power plant had problems already 10 years into its technical life of 50 years when in March and November 1981 stator winding faults caused shut downs in excess of 10 months (up to 27% of the Electricity Commission’s available capacity). Power rationing had to be introduced which lasted until 1982, mentioned on page 204 in the PhD thesis by K.D. Thornton, University of Newcastle
ECNSW and its place in the rise of electricity generation
2015
https://nova.newcastle.edu.au/vital/access/manager/Repository/uon:21089
A vivid description of the 1982 power crisis in NSW is on this blog:
https://wongm.com/2020/06/1982-new-south-wales-power-crisis-backup-gas-turbines/
This context has been largely forgotten. After this short historic excursion let’s turn to the current situation:
This was the performance of Liddell in 2020 (28 outages), from WattClarity:
https://wattclarity.com.au/articles/2021/02/gsd2020-nickbartels-agl-coal/
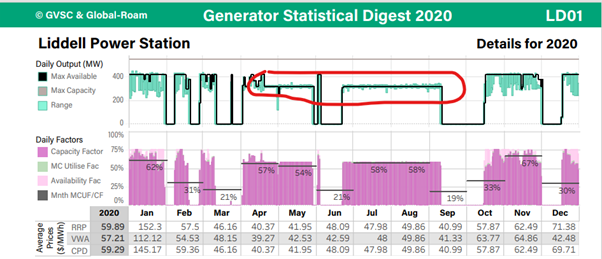
Fig 3: Liddell unit 1, average capacity factor 42% (down from 59% in 2019)
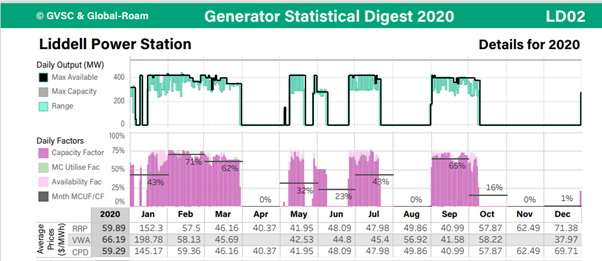
Fig 4: Liddell unit 2, average capacity factor 29% (down from 56% in 2019)
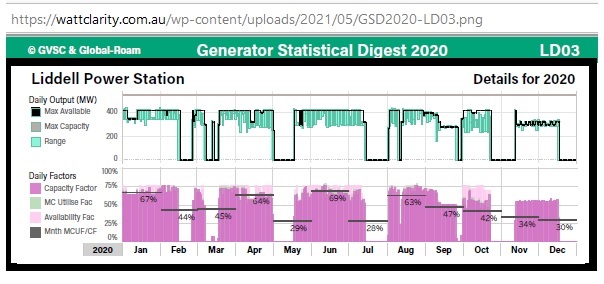
Fig 5: Liddell unit 3, average capacity 46% (down from 63% in 2019)
The December 2020 outage of unit 3 was caused by a transformer explosion during maintenance work in which 2 workers were injured, one of them flown by helicopter to the John Hunter Hospital. https://www.newcastleherald.com.au/story/3488601/two-injured-in-explosion-at-power-station/
AGL warned on 21 Dec 2020 the unit would be out until March 2021.
“AGL estimates the financial impact of this outage, including direct trading impacts on the day of the event, estimated portfolio trading impacts through to early March 2021 and the direct cost of replacing the transformer, to be $25 million (after tax)”
https://www.agl.com.au/about-agl/media-centre/asx-and-media-releases/2020/december/trading-update-and-revised-fy21-guidance
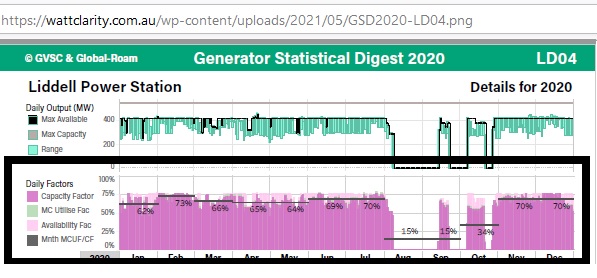 Fig 6: Liddell unit 4, 56% capacity
https://wattclarity.com.au/articles/2021/05/liddell-unit3-closing-11months/
By end March Liddell 3 was not back
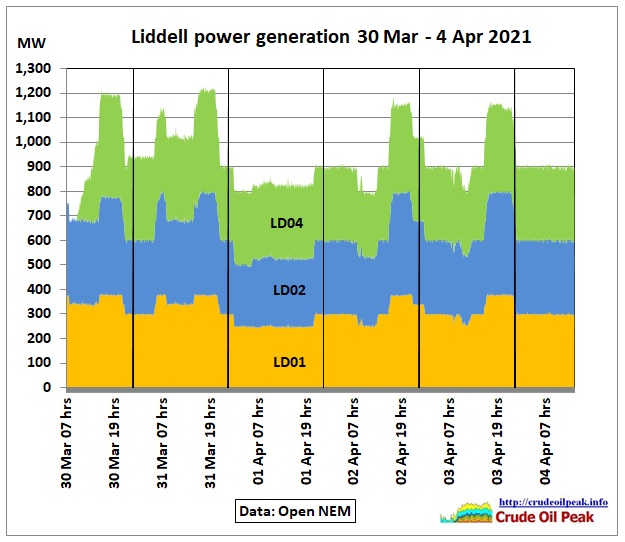 Fig 7: Liddell unit 4 comes back again after it failed in the 4th week of March
In that period, average generation in NSW was between 3,500 MW and 7,000 MW and prices averaged $39 with only a couple of instances with higher prices between $100 and $200/MWh.
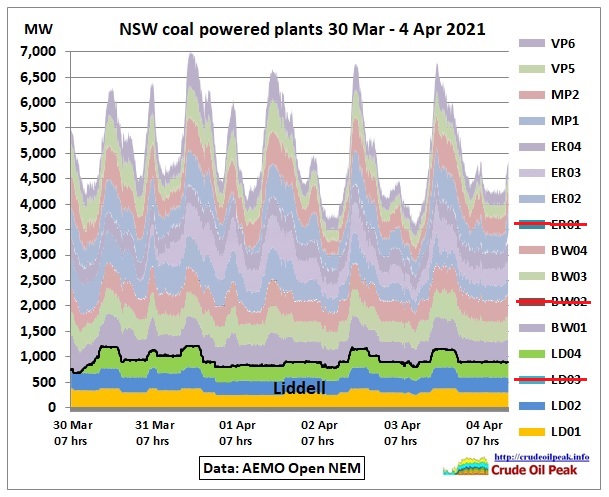 Fig 8: Liddell in comparison with all other coal plants in NSW (25% off-peak and 18% peak)
(Not in operation: BW02, ER01, LD03)
What you pay is what you get
When the NSW government got rid of its Bayswater and Liddell coal fired power plants AGL assigned a book value of zero to Liddell in this investor presentation (August 2014)
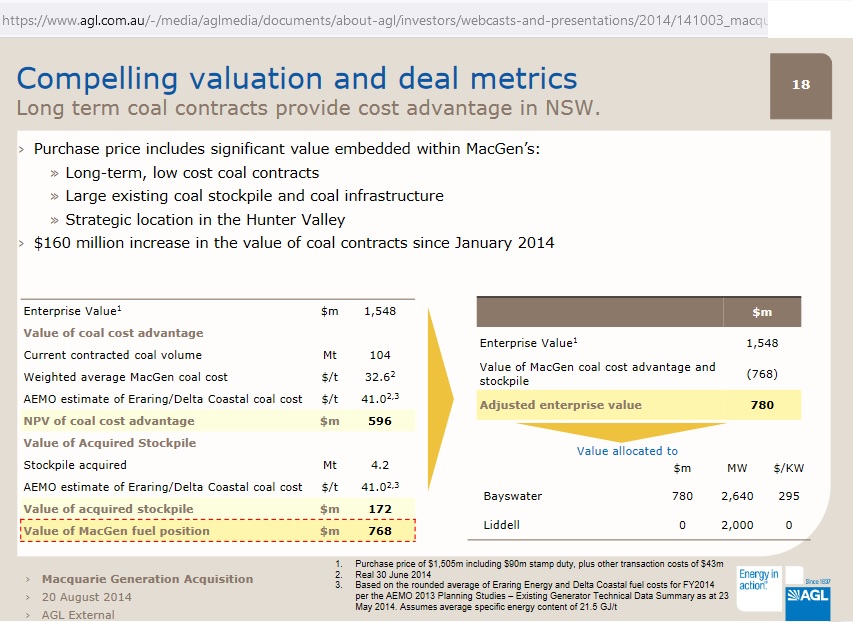 Fig 8: Macquarie Generation Acquisition page 18
https://www.agl.com.au/about-agl/investors/webcasts-presentations
Time line of Liddell’s closure dates
April 2015: AGL announces its GHG policy
– Not build, finance or acquire new conventional coal-fired power stations in Australia (i.e. without carbon capture and storage)
– Not extend the operating life of any of its existing coal-fired power stations
– Close, by 2050, all existing coal-fired power stations in its portfolio
https://www.agl.com.au/about-agl/media-centre/asx-and-media-releases/2015/april/agl-policy-to-provide-pathway-to-decarbonisation-of-electricity-generation
Liddell is not specifically mentioned in this document nor any specific closure dates. But a month later:
May 2015: Investor presentation “Driving operational results”
Liddell end of technical life 2022 (slide 15)
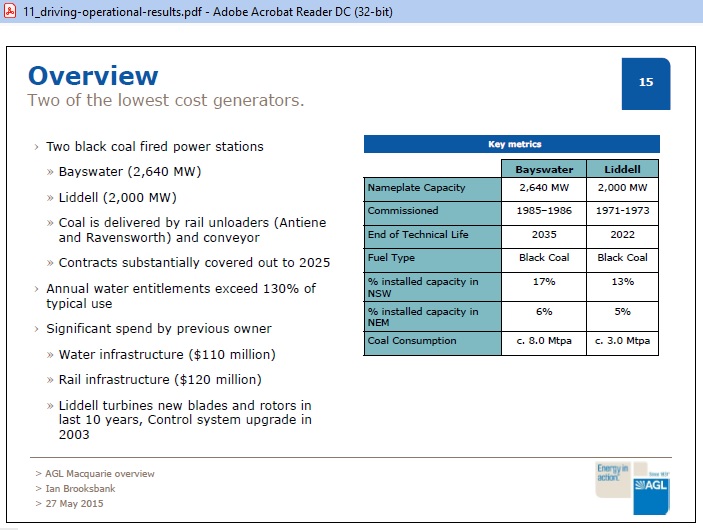 Fig 9: AGL defines End of Technical Life for Liddell is 2022 (50 years from 1972)
December 2015: Australian Energy Regulator “State of the Energy Market 2015”
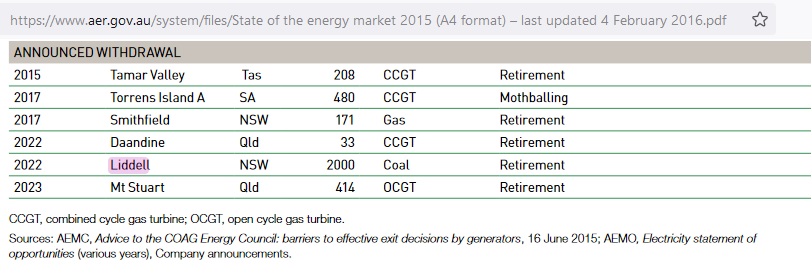 Fig 10: AER included closure date in its annual Energy Market Report
https://www.aer.gov.au/system/files/State%20of%20the%20energy%20market%202015%20%28A4%20format%29%20%E2%80%93%20last%20updated%204%20February%202016.pdf
Why is it so important to repeat this now? Because both the Federal Government and the NSW government have approved many energy hungry projects after 2015 (skyscrapers, apartment towers with associated metros, Western Sydney Airport with Aerotropolis and metro) without checking whether Liddell’s replacement is sufficient and on track. Not to mention all the other aging coal plants.
It is also generally taken for granted that there will be enough grid power to re-charge millions of electric vehicles. That requires detailed number crunching. After all, this website is mainly about oil decline.
These power demand questions will be a topic for another post.
Governments have also assumed that Liddell will be operating normally until the plug is pulled by AGL. Not a prudent approach.
August 2019 – reprieve for 12 months
Schedule for the closure of AGL plants in NSW and SA
2/8/2019
AGL has today informed AEMO that the first unit at Liddell will close in April 2022. However, following an independent engineering assessment, AGL has determined that the remaining three units will close in April 2023, supporting system reliability throughout the 2022-23 summer months.
https://www.agl.com.au/about-agl/media-centre/asx-and-media-releases/2019/august/schedule-for-the-closure-of-agl-plants-in-nsw-and-sa
Without delay, on 8/8/2019 AEMO updated its generation information file (XLS) for Liddell (accessible under Archives):
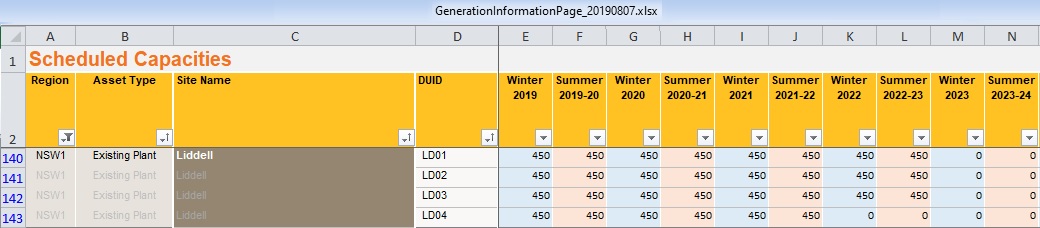 Fig 11: Unit LD04 scheduled to close after summer 2021/22, remaining units after 2022/23
https://www.aemo.com.au/energy-systems/electricity/national-electricity-market-nem/nem-forecasting-and-planning/forecasting-and-planning-data/generation-information
Reliability of remaining units? 2 weeks after applying on 30 April 2021 to the Australian Energy Regulator (AER) that Liddell unit 3 (instead of unit 4 now believed to be more reliable) will close April 2022
https://www.aer.gov.au/wholesale-markets/notice-of-closure-exemptions/76484-agl-macquarie-pty-ltd-liddell-unit-3-exemption
Liddell suffered yet another trip on 13 May 2021 in LD02, one of the remaining units
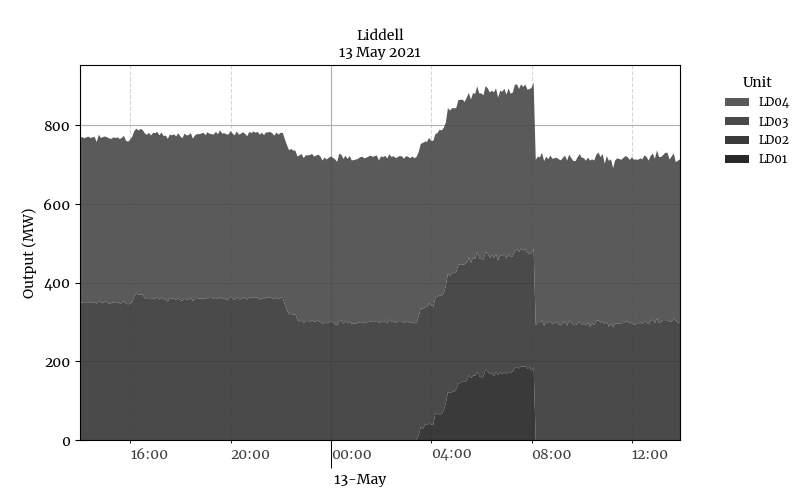 Fig 12: LD02 start-up didn’t work.185 MW lost. Note that LD01 was not on-line at all!
https://australiainstitute.org.au/post/unit-trip-liddell-nsw-2020-10-23-2/
A day earlier the whole east coast system had suffered its first price spike of the month ($2,769, Fig 1)
Prices skyrocket across all 4 mainland regions on Wednesday 12th May
https://wattclarity.com.au/articles/2021/05/wed12may-mainland-price-volatility/
Wattclarity (highly recommended to visit for the finer technical detail) found in the above article that there was little spare capacity in Victoria at 6 pm. That impacted on how much NSW could import from there.
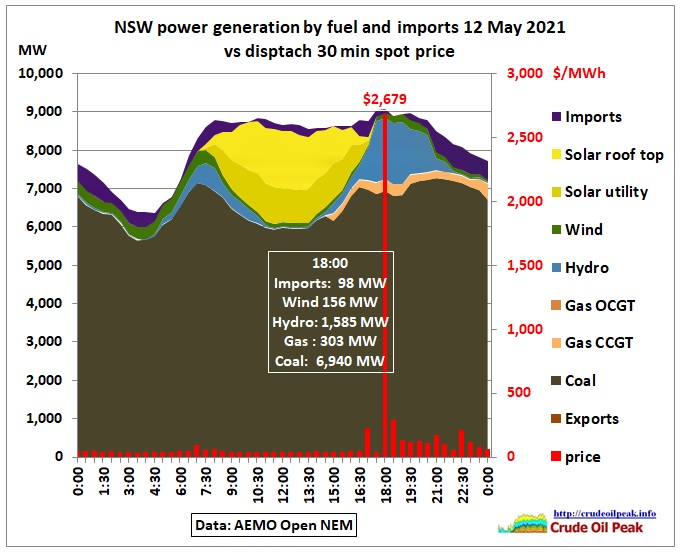 Fig 13: NSW generation by fuel type and imports 12 May 2021
For the critical period at 6 pm there was a lack of imports, hydro near maximum of Tumut3 (6×300=1,800 MW), low wind output and CCGT gas less than what was achieved just 24 hrs earlier (520 MW). Tallawarra CCGT has 440 MW (performance assessment and costs of running gas plants are here: https://wattclarity.com.au/articles/2021/02/gsd2020-allanoneil-transition-fooled/)
In this situation the Federal Minister for Energy announces:
Protecting families and businesses from higher energy prices
19 May 2021
The Morrison Government is stepping up and building a new gas power plant in the Hunter Valley, which will create jobs, keep energy prices low, keep the lights on and help reduce emissions.
This important project delivers on the Government’s 1,000 MW target set last September, which was created to avoid unacceptable price increases following the closure of the Liddell power station in 2023.
In the 2021-22 Budget, the Government committed up to $600 million for Snowy Hydro Limited to construct a 660 MW open cycle gas turbine at Kurri Kurri in the Hunter Valley.
The Hunter Power Project will deliver an important economic boost to the region, creating up to 600 new jobs during peak construction and 1,200 indirect jobs across NSW.
This project, together with EnergyAustralia’s 316 MW Tallawarra B open cycle gas plant, will help shore up the security, reliability and affordability of electricity for consumers in NSW, with a commitment to be generating in time for summer 2023-24 when Liddell closes.
In April 2020, The Liddell Taskforce had come up with this plan:
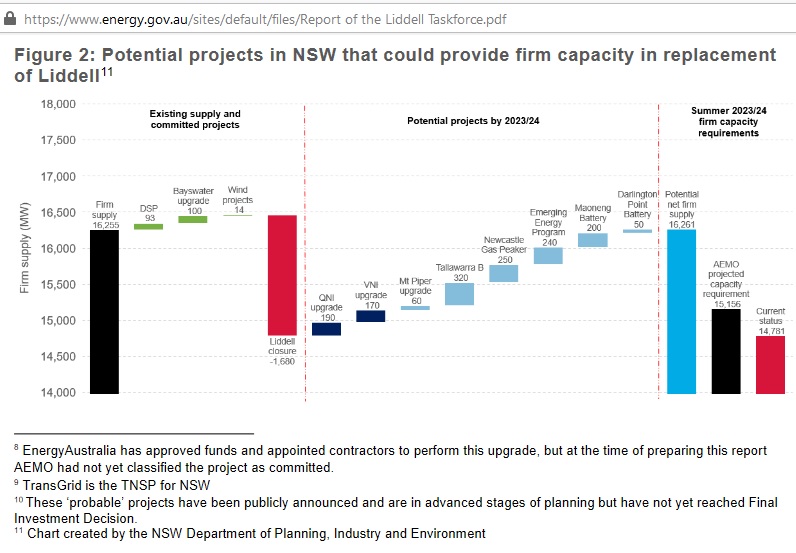 Fig 14: Liddell replacement plan
https://www.energy.gov.au/publications/liddell-taskforce-terms-reference-report-statement-and-response
All this came quite late, 5 years after AGL’s first announcement in 2015 to close Liddell in 2022.
Price spike 21 May 2021
By Friday 21st May 2021 dispatch spot prices had climbed to $7,652 per MWh. What happened?
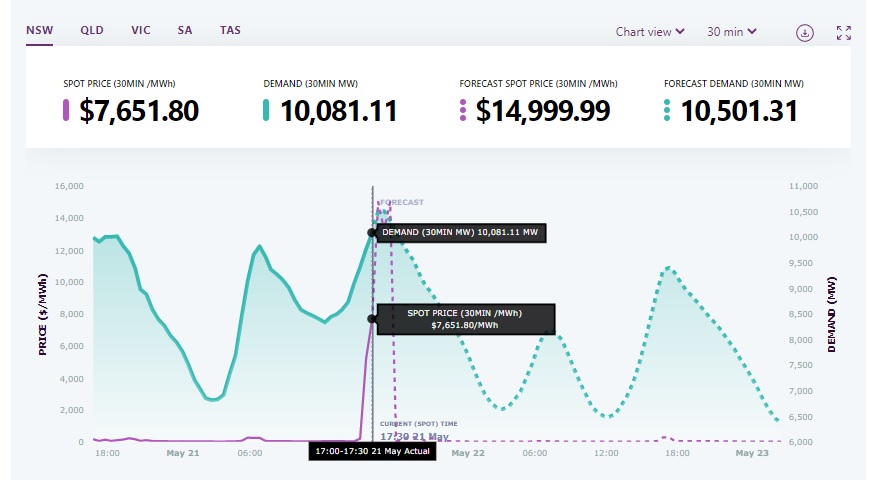 Fig 15: Price spike $7,651 on Friday 21/5/2021
https://www.aemo.com.au/energy-systems/electricity/national-electricity-market-nem/data-nem/data-dashboard-nem
ABC TV’s Friday Briefing on that day by Patricia Karvelas gave the answer:
16:20
Clare Armstrong: “I was talking to the CEO of the Tomago aluminium smelter which is near Newcastle and they had to switch off. Liddell had several unplanned outages this week. An old coal fired power station. That sort of thing happens. And the alu smelter had to shut down 3 times this week because the price of whole sale energy in NSW peaked at $15,000 per MWh which is the equivalent of petrol suddenly going up to $400. So it was a massive peak. Under their contract they actually have to power down temporarily so there is enough power in the grid to turn the lights on in Sydney. So there is definitely a shortfall in energy. And even if you talk about batteries the issue is the biggest battery in Australia can power the Tomago alu smelter for only 12 min”
https://iview.abc.net.au/show/friday-briefing/series/0/video/NU2169H016S00
Just an hour later:
85768 RESERVE NOTICE 21/05/2021 05:11:33 PM
Actual Lack Of Reserve Level 1 (LOR1) in the NSW region – 21/05/2021
AEMO ELECTRICITY MARKET NOTICE
An Actual LOR1 condition has been declared under clause 4.8.4(b) of the National Electricity Rules for the NSW region from 1700 hrs.
The Actual LOR1 condition is forecast to exist until 1830 hrs.
The capacity reserve requirement is 1400 MW
The minimum capacity reserve available is 817 MW
https://aemo.com.au/market-notices
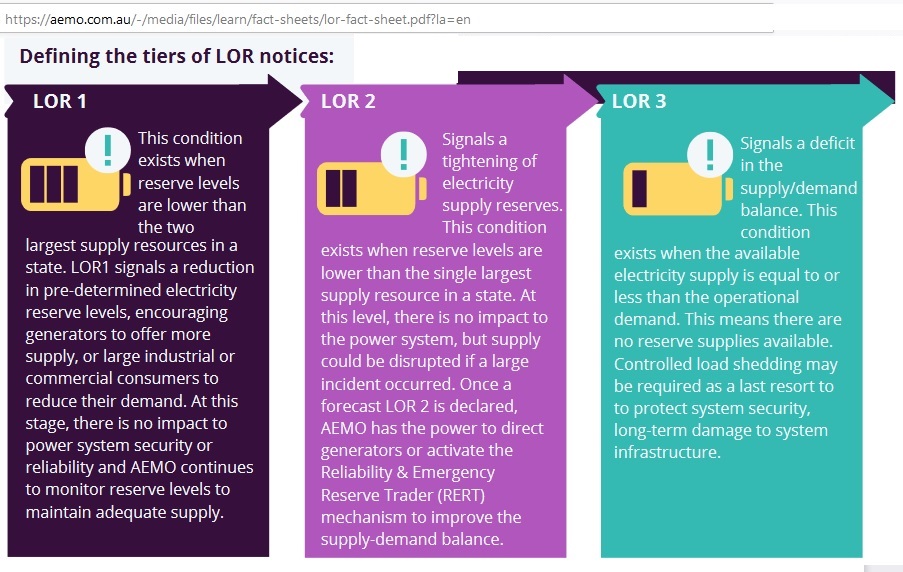
Fig 16: Lack-of-reserve definitions
https://aemo.com.au/-/media/files/learn/fact-sheets/lor-fact-sheet.pdf?la=en
Tomago alu smelter load shedding
(Voluntary) load shedding in winter? We had it in summer:
14 Feb 2017
NSW’s privatized giveaway coal plant causes load shedding in extreme weather
http://crudeoilpeak.info/nsws-privatized-giveaway-coal-plant-causes-load-shedding-in-extreme-weather
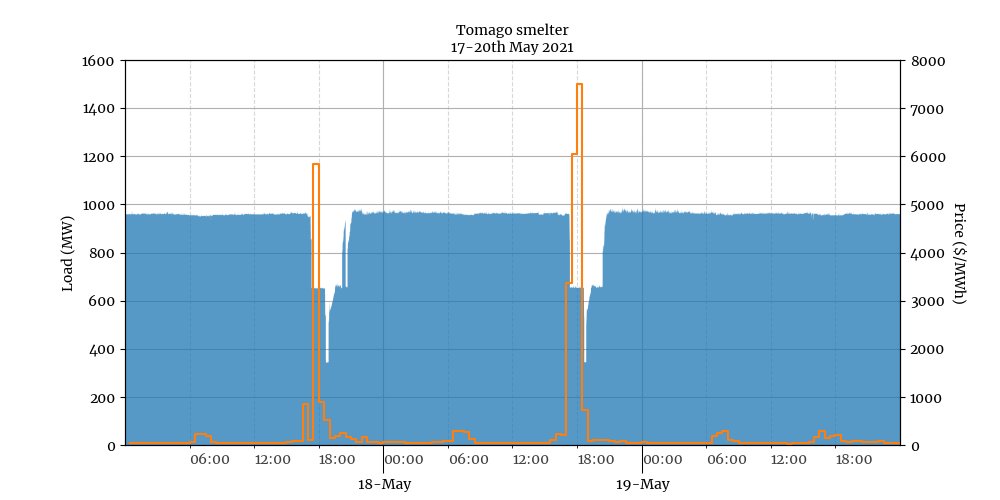 Fig 17: Tomago load shedding on 17th and 18th May 2021
https://twitter.com/dylanjmcconnell/status/1396409961530355712/photo/1
950 MW x 12 min = 190 MWh (Hornsdale battery 194 MWh)
2 ½ hrs load shedding of 300 MW = 750 MWh. For comparison: the proposed battery at Wallerwang has 500 MW/1,000 MWh = 300 MW x 3.33 hrs
https://www.planningportal.nsw.gov.au/major-projects/project/41221
For a short while, a 2nd potline was turned off (total therefore 600 MW). Another battery would have been needed. The next event was already a day later. Batteries would have had to be recharged in this short time. From renewables, of course, during a period in which power was available and prices were low, from midnight. Wind was 450 MW at that time, slowly going down to 360 MW by 6 am next day. That would have delivered around 2,500 MWh. An empty Wallerawang battery would have used 40% of that.
The Australian Energy Market Commission (AEMC) listed in its report “Demand response in the National Electricity Market” (by Energy Synapse, Dec 2020) following facts about Tomago:
- 3 pot lines with 840 pots are producing 590 kt pa (35 % of Australian primary aluminium)
- Current flows through one pot into the next and causes alumina to separate into aluminium and oxygen
- Each pot line consumes 300 MW. 2 pot lines can be taken offline completely or ramped down by 50 MW each.
- Shutdown is automated but requires 1 hr notice, one pot line at a time. Only in an emergency 2 potlines can be taken off simultaneously (600 MW) in less than a minute
- Frequency of interruptions are a limiting factor. There is a problem if interruptions happened 2 weeks before another shut-down.
- There is an exposure to high spot prices if load was not reduced when asked by supplier
- Pot lines will freeze in 2 hrs 50 minutes. A 1 hr interruption is preferred. Re-energizing is more complex than shut-down. 2hrs significantly reduces margin of error when restarting and extends recovery time.
- Stabilization takes 8 weeks after an unplanned interruption.
- A black event in NSW would take 5 hrs for power to be restored. That would freeze all pot lines at very high cost. It is in Tomago’s own interest to contribute to the stability of the NSW grid by powering down if needed.
- The contract with the supplier is based on payments if and when demand response events occur. That makes business planning very uncertain
- Tomago will be asked more often to shut down as aging coal plants are closing. That would require additional electrical infrastructure to make the site more reliable. But it is difficult to make this a bankable business case
This is of course a deplorable state of affairs. Are we asking Sydney Trains to run fewer electric trains in peak hour? Imagine the uproar among passengers.
If power supply has no more redundancy then this means that every new power consumer increases the probability of the Tomago smelter being forced to load shed.
In part 2 of this post there’ll be more on price spikes and we’ll look at the impact of the Callide generator hall explosion in Queensland which impacted NSW because this State is utterly dependent on power imports from neighbouring States.
Conclusion:
Load shedding by an alu smelter is a no-no. In polished reports this is disguised in these beautifully embellishing terms: “demand response” and “industrial load flexibility”.
The fact that this is being acquiesced by governments, the media and the public shows to which low levels standards have slipped.
That Liddell was running sometimes with only 2 units gives us a foretaste of what is going to happen when Liddell closes stage wise. NSW was lucky the 2020/21 La Nina summer was comparatively mild. Since 2015, the government had 6 years time to implement a policy of reducing power demand vis-à-vis limited availability, especially at peak times. It went in the opposite direction by promoting perpetual growth of everything. Whether the proposed Kurri Kurri gas peaking plant can be built in time to rescue Tomago in the next summer or during a break down of another aging coal plant is an open question.
Next post:
14/6/2021
NSW power spot price spikes May 2021 become regular (part 2)
https://crudeoilpeak.info/nsw-power-spot-price-spikes-may-2021-become-regular-part-2