In this 2nd part we analyze the impact of the generator hall explosion on 25 May 2021 in the Callide power plant in Queensland located 85 kms south west of Gladstone.
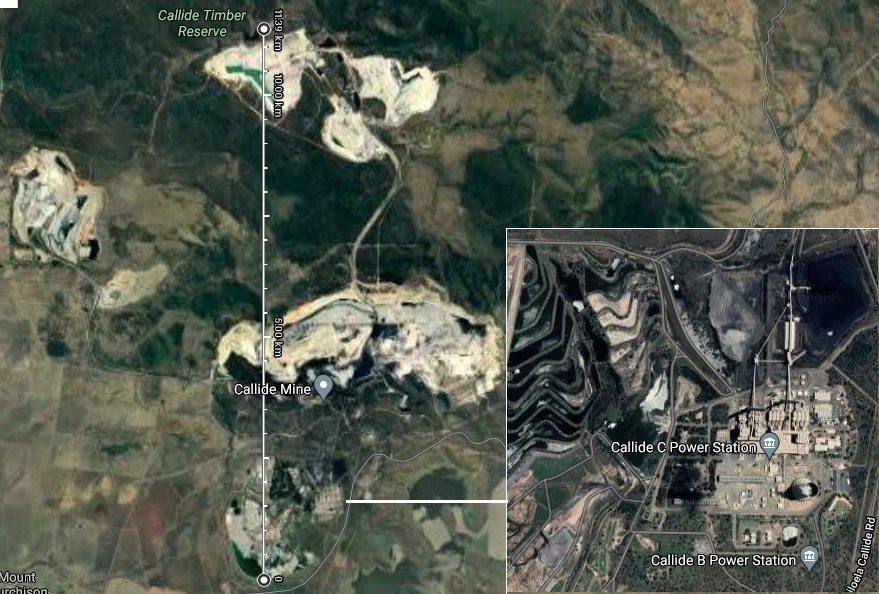 Fig 18: Callide B and C power station adjacent to the Callide coal mine
See the appendix for more details on the coal supply for Callide.
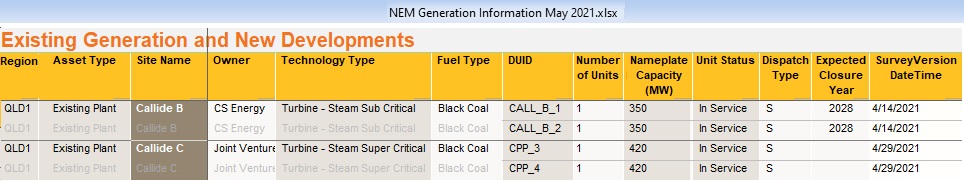 Fig 19: The 4 generators at Callide.
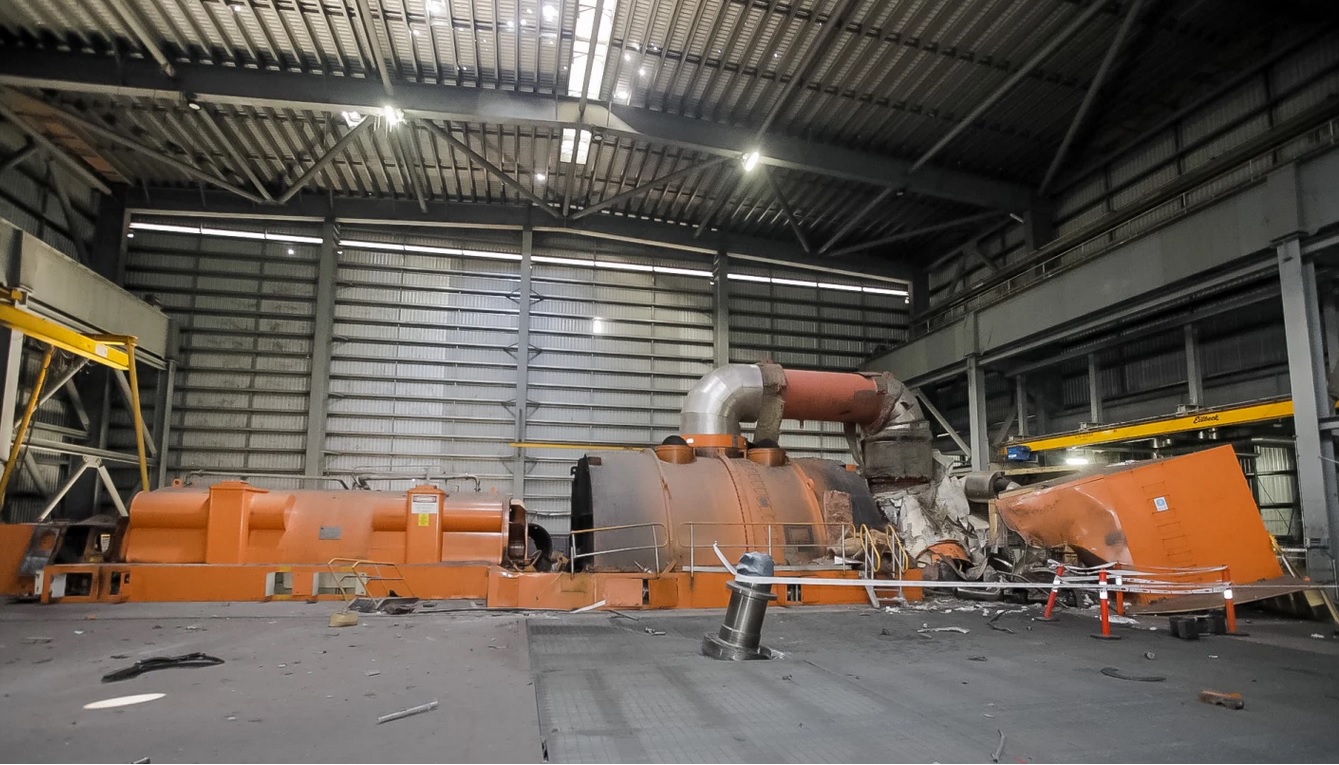 Fig 20: CPP_4 has been destroyed (photo supplied by CS Energy on 2 June 2021)
https://www.csenergy.com.au/news/cs-energy-releases-photo-of-unit-c4
AEMO issued following notices:
16:44 Notice 85992 Lack of reserve level 2
17:39 Notice 86007 Intervention event (Reliability and Emergency Reserve Trader RERT) until 21:30
19:26 Notice 86037 End of intervention 19:30
https://aemo.com.au/Market-Notices?marketNoticeQuery=86007
C4 had an overhaul just 3 ½ years ago
Overhaul keeps Callide Power Station in top condition
13 Oct 2017
https://www.csenergy.com.au/news/overhaul-keeps-callidec-power-station-in-top-condition
UPDATE FROM CALLIDE POWER STATION
1 June 2021
This afternoon CS Energy informed AEMO that Unit B1 will be returned to service on 11 June and B2 on 21 June. CS Energy owns 100 per cent of Callide B.
CS Energy owns Callide C in a 50/50 joint venture (JV) with InterGen. Callide Power Trading, which trades the output of Callide C on behalf of the JV, has informed AEMO that Unit C3 will return to service on 22 June.
There was no change made to the forecast return date for C4 of 12 months’ time.
https://www.csenergy.com.au/news/update-from-callide-power-station
Here is an interesting video showing how Unit C3 got a new turbine
Callide Power Station Unit C3 major overhaul – 2019
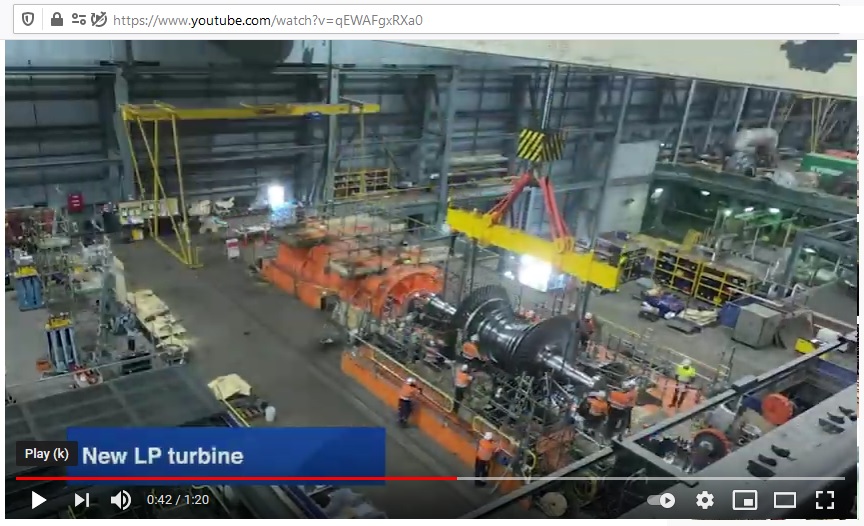 Fig 21: A new turbine is lifted into Callide C3 unit
https://www.youtube.com/watch?v=qEWAFgxRXa0
AEMO preliminary report
2/6/2021
Callide Power Station (Callide) is a thermal power plant in central Queensland consisting of two 350 MW generating units at Callide B (B1 and B2) and 466 MW and420 MW generating units at Callide C (C3 and C4 respectively).
Immediately prior to the event, Callide C4 was operating at 278 MW. Initial investigations show that at
13:34 hrs on 25 May 2021, Callide C4 ceased exporting active power and was observed to absorb approximately 50 MW and 300 megavolt-amperes reactive (MVAr) from the power system, with voltages at Calvale 275 kV substation remaining healthy at approximately 1.0 per unit.
13:40 hrs CS Energy informed AEMO of a turbine hall fire at Callide C.
13:44 hrs Callide C3 tripped from around 417 MW.
14:06 hrs multiple events occurred in quick succession, negatively impacting the power system
Separation of Queensland region
The Queensland to New South Wales Interconnector (QNI) is the main interconnection between New South Wales and Queensland, with an import capacity to Queensland of approximately 600 MW. Immediately prior to the event at 13:30 hrs QNI was exporting approximately 396 MW to New South Wales.
14:06 hrs approximately 3,000 MW of generation capacity tripped offline in Queensland causing QNI active power flow to rapidly increase, peaking at around 1,064 MW import to Queensland until the interconnector tripped.
After QNI tripped, the Queensland frequency dropped to approximately 48.50 Hz. In response, AEMO observed a net reduction in load of approximately 2,300 MW in Queensland and 40 MW in Northern New South Wales.
The cause of most of this load reduction is likely to be associated with the expected operation of automatic Under Frequency Load Shedding (UFLS) relays following the observed drop in frequency, but this will need to be confirmed through analysis of relay operation.
https://aemo.com.au/-/media/files/electricity/nem/market_notices_and_events/power_system_incident_reports/2021/preliminary-report–trip-of-multiple-generators-and-lines-in-queensland-and-associated-underfrequenc.pdf?la=en
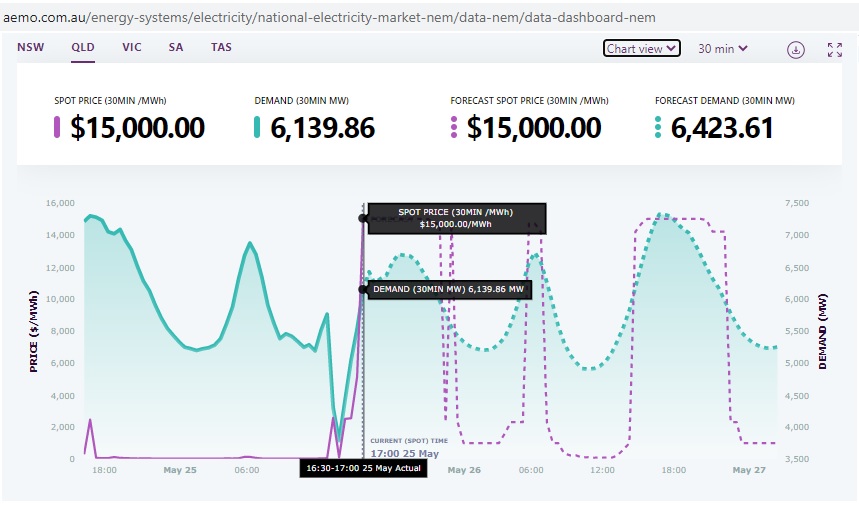 Fig 22: Queensland price spike of $15,000/MWh after the Callide generator hall explosion
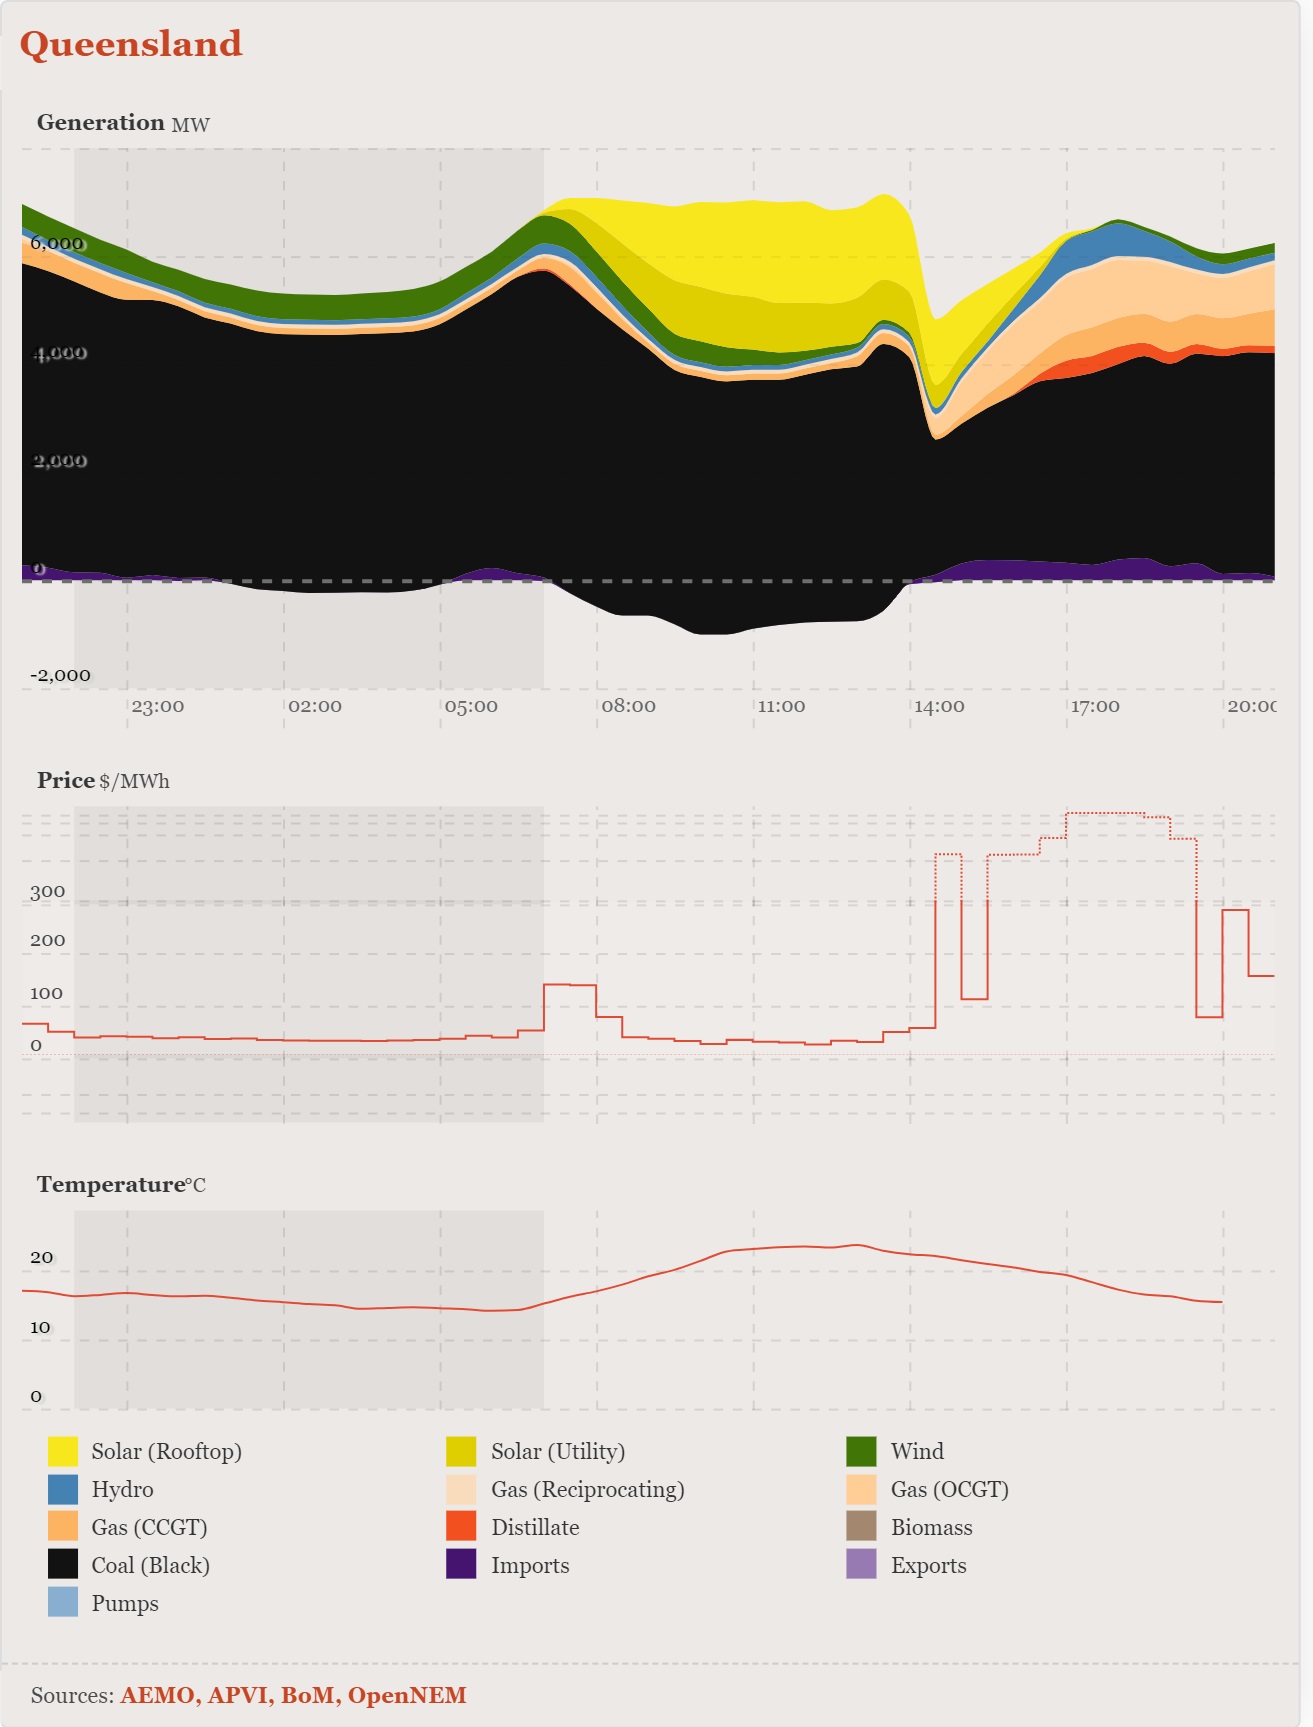 Fig 23: Queensland power generation by fuel on the 25th of May
We see the impacts:
(A) In a complete reversal of interstate power flows, Queensland had to import power from NSW. In the period 8:00 to 13:00 before the accident Queensland exported an average of 650 MW to NSW. But that changed to average imports of 340 MW after the accident, i.e. a change of around 1,000 MW.
(B) Gas fired power plants had to come in to replace lost capacity and provide for the evening peak
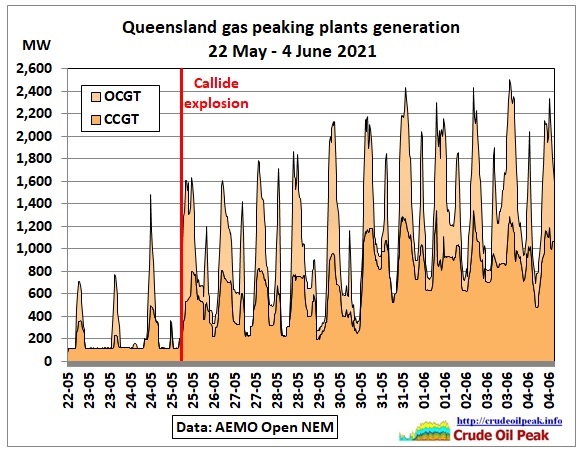 Fig 24: Gas fired power generation ramp up
The gas peaking plants have created a quasi base load type of generation at around 500 MW in the 1st week of June. These peaking plants were not designed for base load. There is also a question about the prices of gas. AEMO’s generator table refers to coal seam gas as fuel source which means these gas plants have to compete with international prices as a result of LNG exports from Gladstone. Not to mention that CSG permanently damages agricultural land.
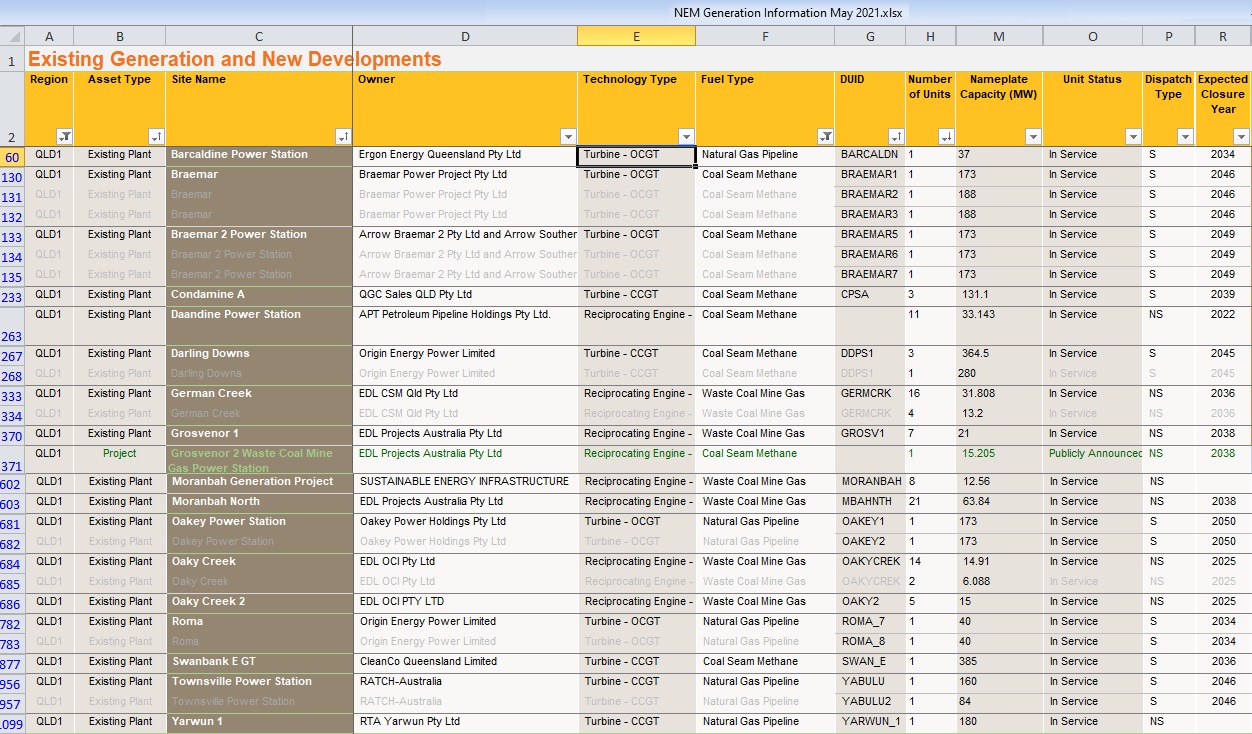 Fig 25: Queensland’s gas fired power plants. AEMO generation information May 2021
https://aemo.com.au/en/energy-systems/electricity/national-electricity-market-nem/nem-forecasting-and-planning/forecasting-and-planning-data/generation-information
Let’s check how the largest gas plant, Swanbank E is operating as this article is written:
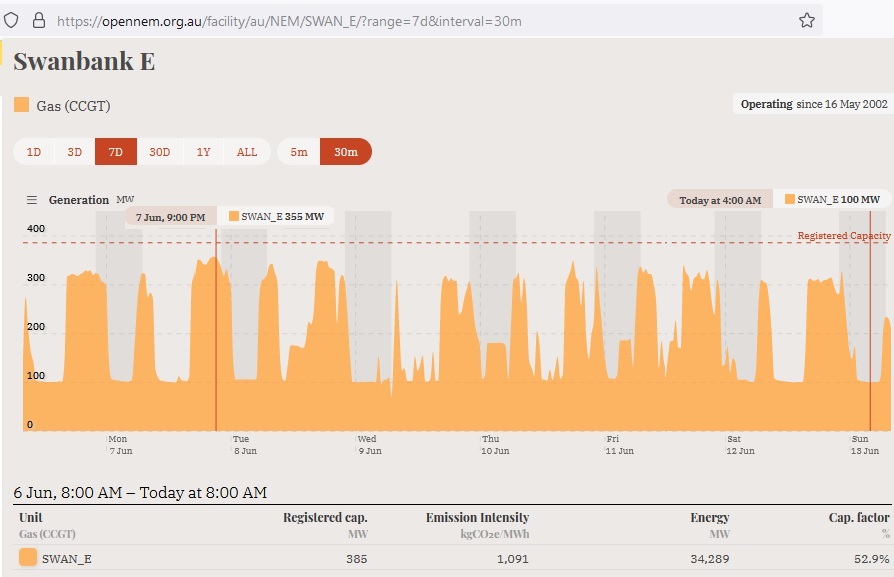 Fig 26: Swanbank running 100 MW 24/7, peak up to 355 MW 4 pm – 11pm
Now let’s put that gas power on top of coal and add wind and hydro power:
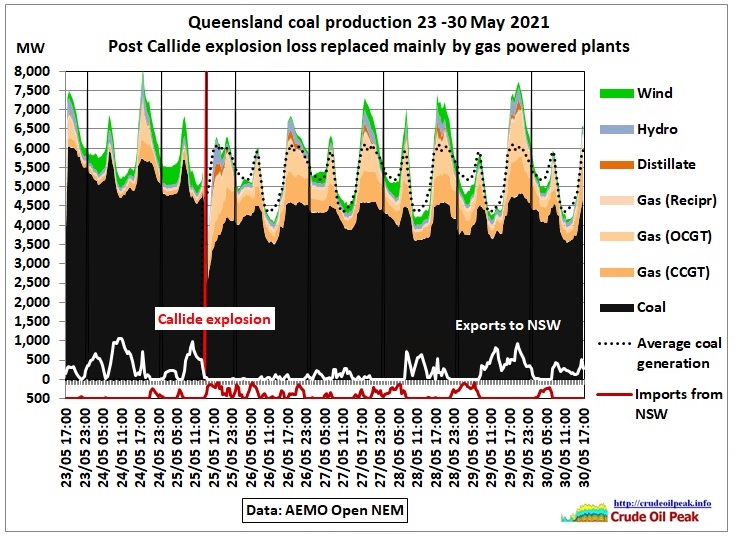 Fig 27: Queensland coal production after Callide outage
In the first days after the Callide incident, Queensland imported power from NSW. The dotted line shows the average coal generation pattern calculated from the previous 6 days.
(C) Even distillate (kerosene) fueled generators had to be used.
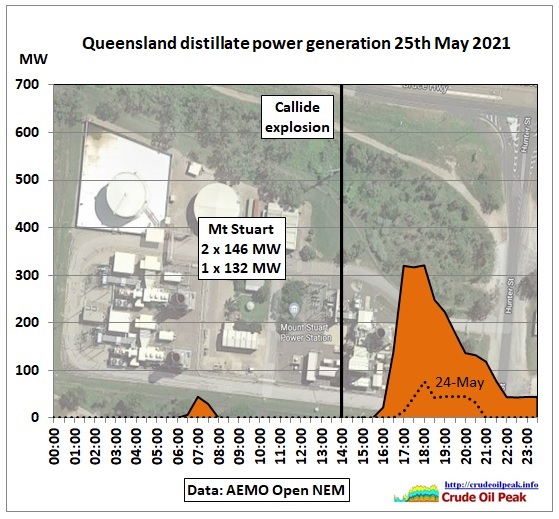 Fig 28: Mt Stuart power plant running on kerosene
The dotted line shows the “normal” generation 1 day earlier
Mt Stuart Power Station, QLD
Generation capacity: 423 MW
Operational since 1999, Mt Stuart is North Queensland’s largest power station, designed to generate electricity at peak times. Mt Stuart uses an open-cycle gas turbine system in which the three turbines are fuelled by Kerosene – the same fuel that powers jet engines. The power generated goes into the NEM which covers Australia’s eastern and southern states.
https://www.originenergy.com.au/about/who-we-are/what-we-do/generation.html
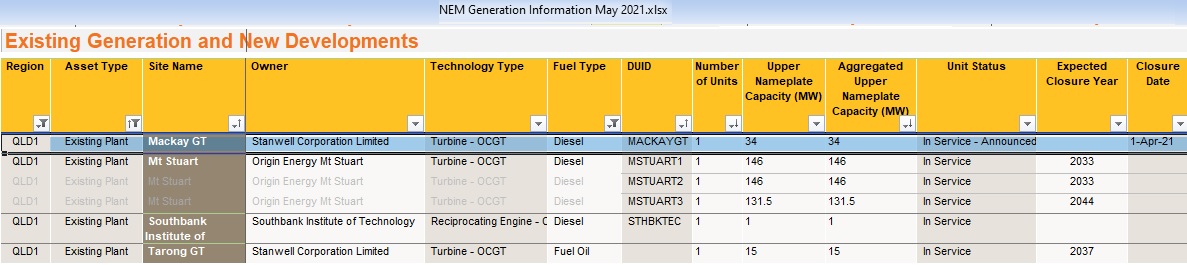 Fig 29: Diesel/fuel power plants in Queensland
(D) Modest hydropower output
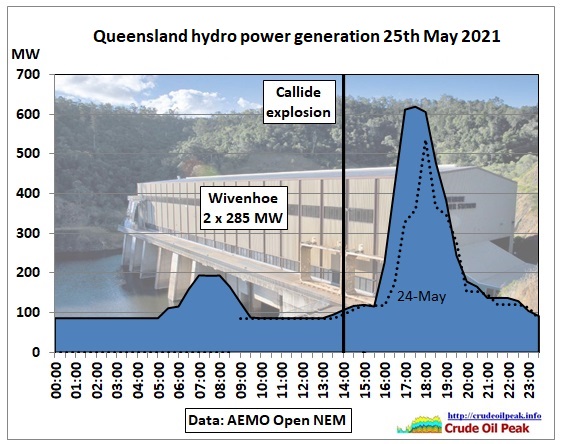 Fig 30: Hydropower generation was higher than a day earlier
The peak demand energy generated above 160 MW between 4 pm and 8 pm was around 1,200 MWh with a max rating of 460 MW. That could be provided by a grid scale battery
The total output for 24 hrs was around 4,000 MWh or 70% of a total of 2×2,850= 5,700 MWh in Wivenhoe. Not much room to maneuver.
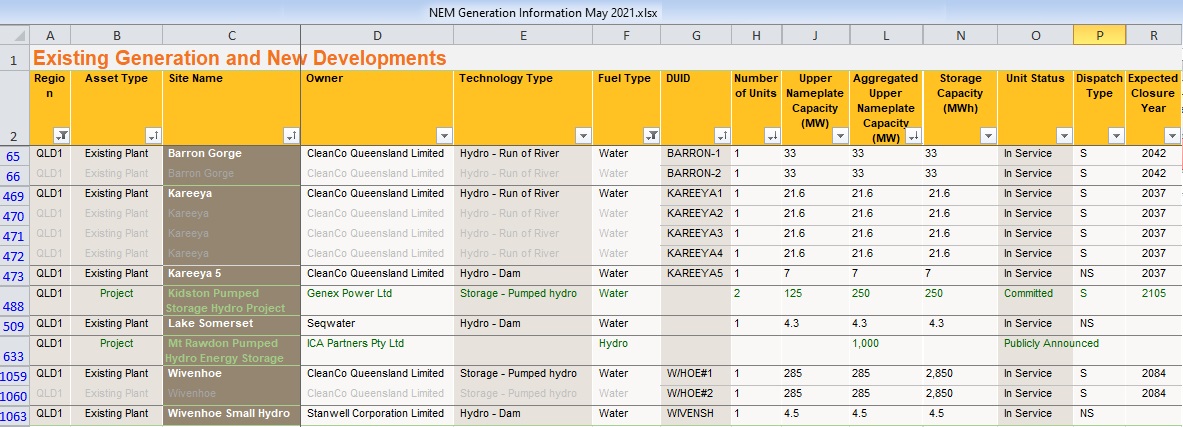 Fig 31: AEMO’s hydro generation information for Queensland
So more pumped hydro is needed. How about the Mt Rawdon project? Oh dear. Only at feasibility stage:
CASE STUDY: Pumped hydro renewable energy at Mt Rawdon
We are progressing with the feasibility project to integrate renewable energy infrastructure at the Mt Rawdon Operation. The pumped hydro scheme would entail the use of the open pit void [gold mine] as the lower reservoir and the construction of an upper reservoir. There is potential for long-term benefits to the region and economy should the project become a reality.
More on price spikes
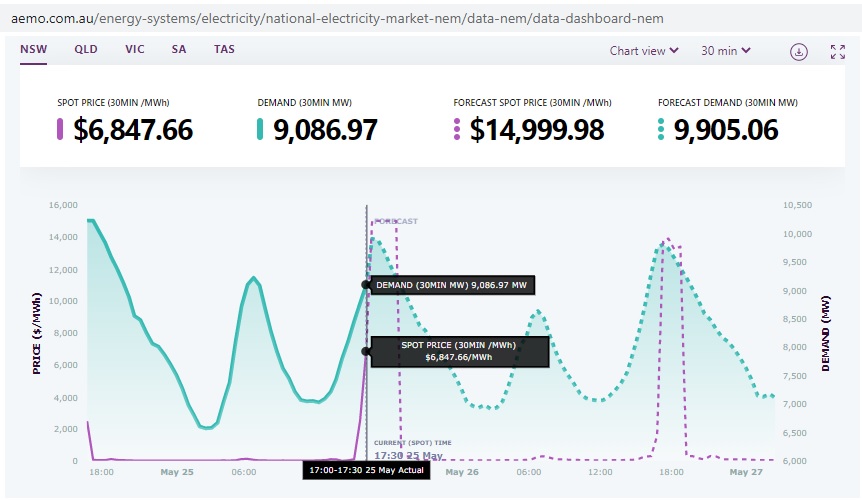 Fig 32: The Callide explosion triggered a price spike in NSW, too
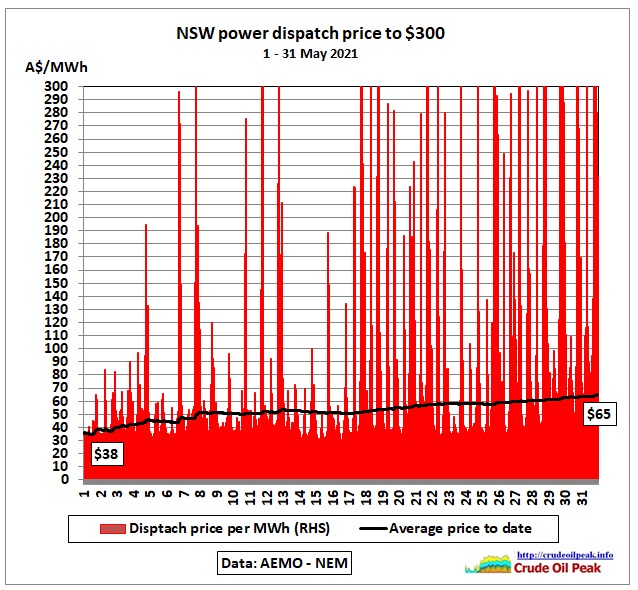 Fig 33: Graph showing prices <$300/MWh, (in 97.7% of 30 min intervals)
In 55% of 30 min intervals prices were lower than $50/MWh. The black line shows the running average price since the start of the month, beginning with $38/MWh on the 1st day. As the number of higher priced days is increasing, the average price goes up to $65 at the end of the month (as shown in Fig 1). These average prices are not weighted by volume.
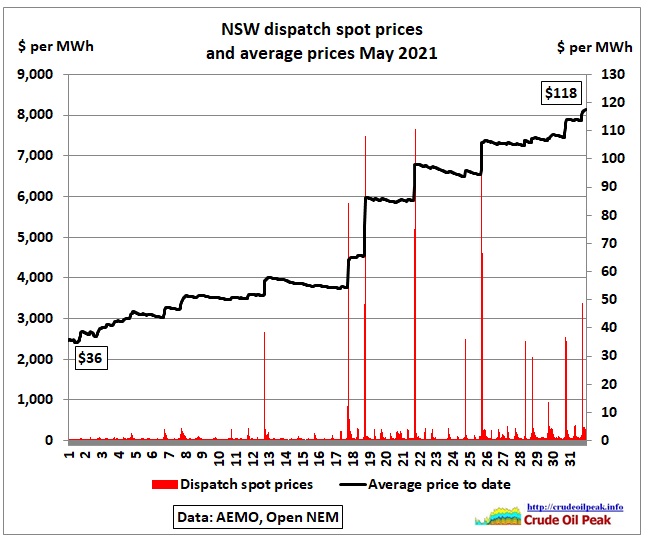 Fig 34: Average dispatch prices including all price spikes
Adding all price spikes >=$300/MWh increases the average to $107 at the end of the month. This will find its way into electricity bills.
But the Queensland Energy Minister Mick de Brenni said the Callide incident is just a blip
Explosion at Callide ‘won’t hit Qld bills’
https://newstral.com/en/article/en/1193640048/explosion-at-callide-won-t-hit-qld-bills-
There are too many blips in the system!
Types of price spikes
We have following causes of price spikes:
• Demand peaks (behaviour and urban structure)
• Questionable bidding (electropoly)
• Outages of aging coal plants, lack of maintenance/previous repairs not durable
• Extreme weather events and their permanent damage to facilities/equipment
• Lack of energy storage facilities to accommodate variable renewable generation
As another example, while writing this article, the Yallourn W power plant was down to 200 MW due to the danger of brown coal fields flooding after heavy rainfall in Victoria
The above list is not necessarily complete and needs further research
Conclusion
It is an untested assumption that aging coal plants will operate at rated capacities until their announced closure dates. We can therefore expect more “surprising” outages. It should be crystal clear that every new electricity hungry project (e.g. skyscrapers, apartment towers and their associated metros, the 2nd Sydney airport and surrounding aerotropolis etc.) increases the probability of price spikes, making things only worse. We need to power down, not grow urban areas – whether in high rises or new subdivisions.
Appendix
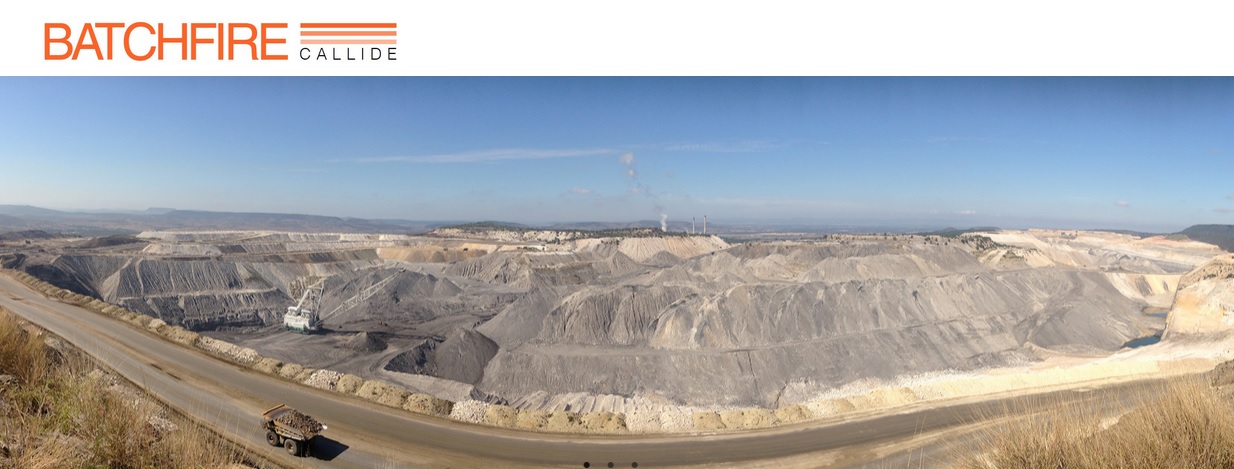 Fig 35: 9.6 mtpa in 2020 (6.5 mtpa for the power plant) sub-bituminous raw coal in 4 pits on 180 km2
https://www.batchfire.com.au/ https://statements.qld.gov.au/statements/83435
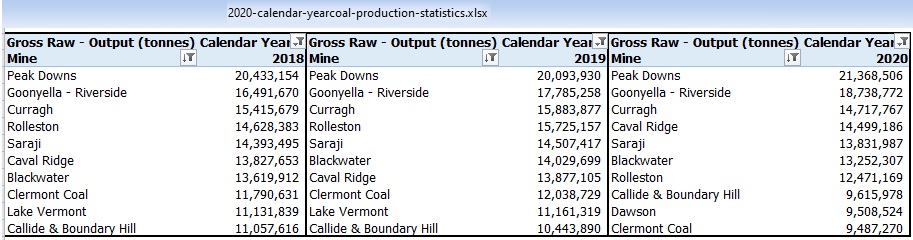 Fig 36: Queensland coal statistics
https://www.data.qld.gov.au/dataset/annual-coal-statistics
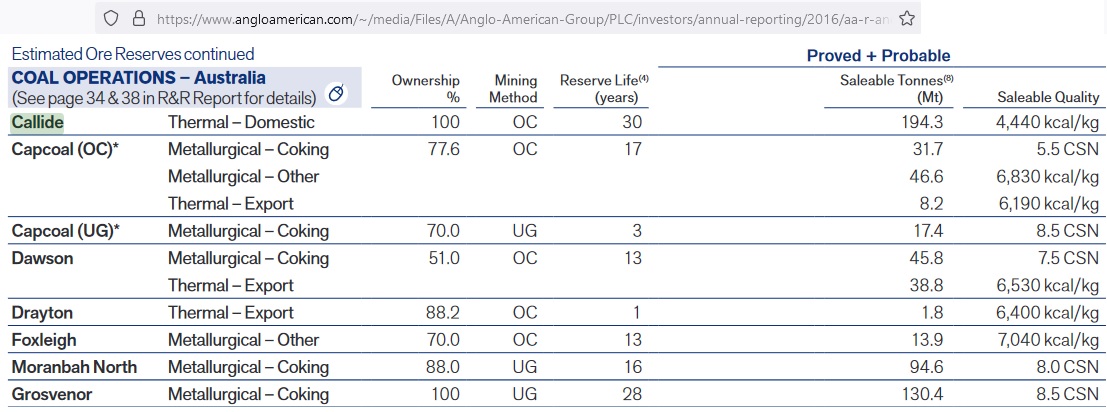 Fig 37: Callide 2P coal reserves 2015
Update Feb 13, 2024
The final technical report for the Callide C4 explosion:
https://www.csenergy.com.au/news/cs-energy-releases-technical-report-into-2021-unit-c4-incident
“In the 18 months leading up to the Unit C4 incident, an upgrade program had been initiated to replace the battery chargers on Unit C3, Station, and Unit C4.
The Unit C3 and Station battery chargers were replaced and successfully brought back into service.
By May 2021, the Unit C4 battery and battery charger had been disconnected from the system and the battery charger had been replaced.
During this time, the Unit C4 DC system was configured to receive power from Station, via a switch, called a Station Interconnector.
The Unit C4 incident occurred during the re-connection of the new Unit C4 220V battery charger.”
“25 May 2021
13:28 Switching commenced to return C4 battery charger to service into its typical configuration.
13:32 C4 offline battery charger circuit was opened and C4 220V battery charger was connected to Unit C4 220V DC Main Switchboard.
13:33 Unit C4 to Station Interconnector opened (initiating event), Unit C4 220V DC voltage decayed to zero volts.
13:33 –13:34 The decaying DC voltage on C4 triggered several events” (as shown in this fault tree)
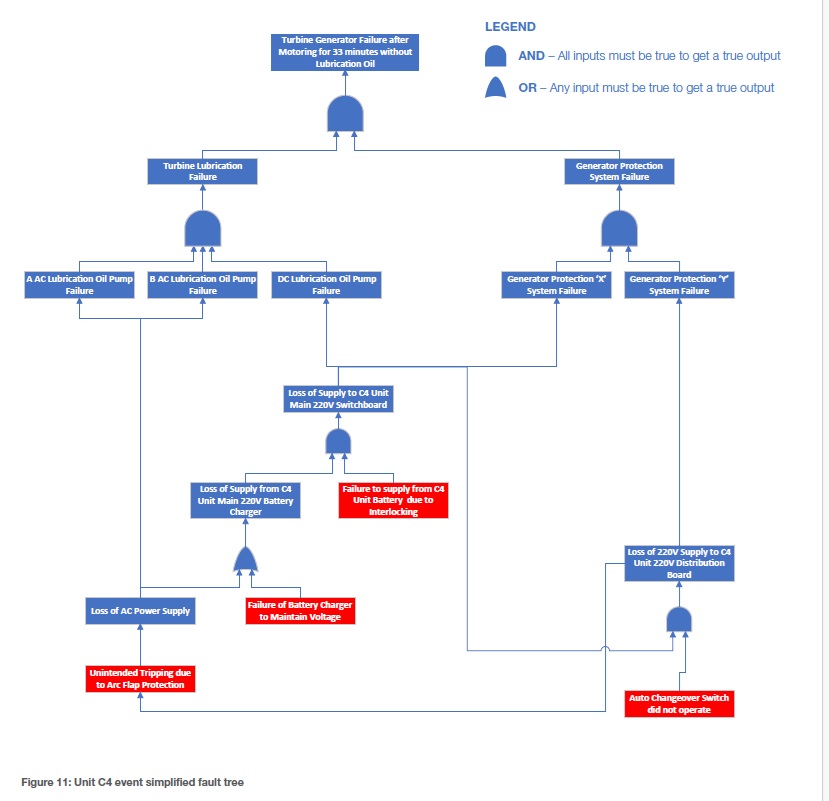 Fault tree (cascading events)
https://www.csenergy.com.au/ArticleDocuments/276/CSE%20C4%20TURBINE%20REPORT%20FINAL.pdf.aspx
Previous post on price spikes:
7/6/2021
NSW power spot price spikes May 2021 become regular (part 1)
https://crudeoilpeak.info/nsw-power-spot-price-spikes-may-2021-become-regular-part-1