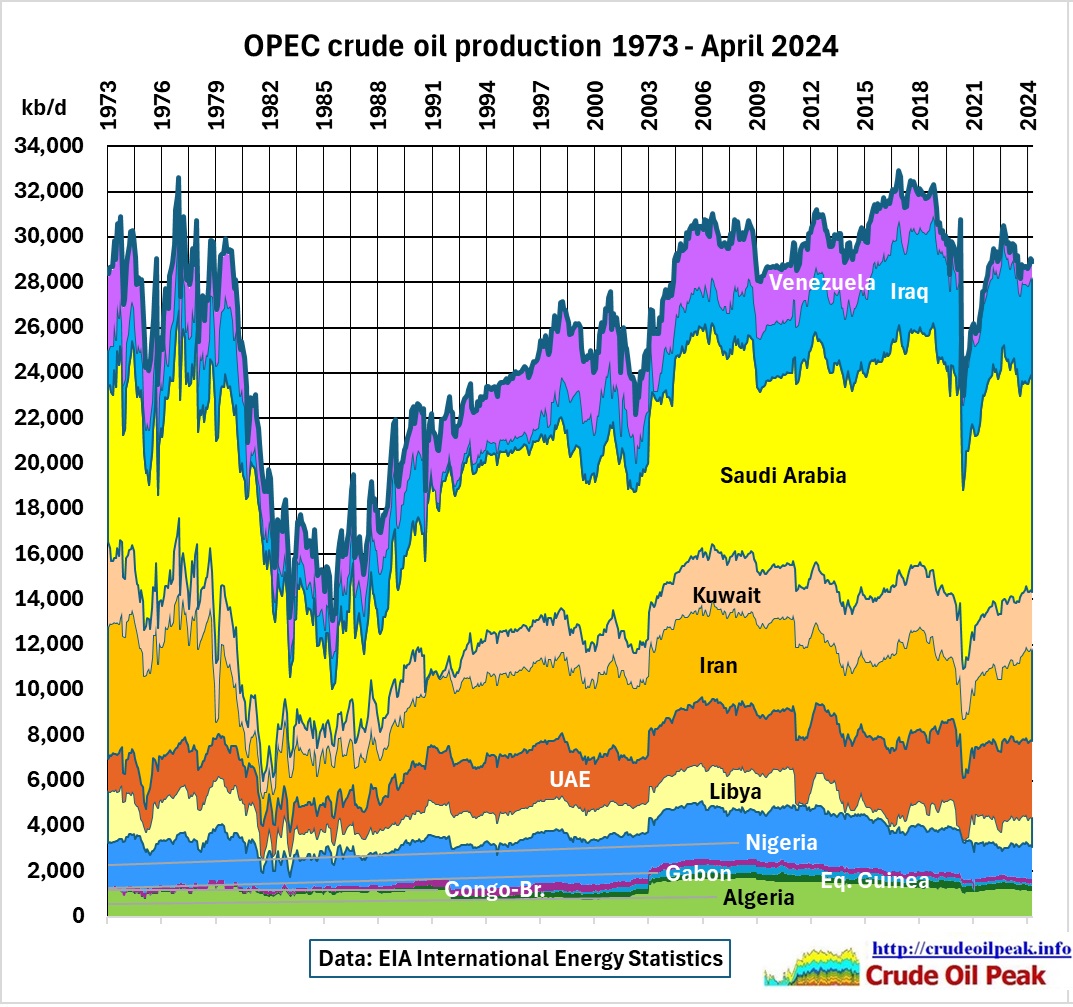
 Fig 1: OPEC12 crude production peaked 2015-2018
Crude oil in the EIA statistics includes condensate (C&C). The data are around 2.2 mb/d higher than the crude only published in OPEC’s Monthly Oil Market Report (Fig 5-7)
In order to get more detail we look at the incremental production for the period 2015 – April 2024. Incremental production is calculated as that part of the production which exceeds the minimum production (base production) in each country during that period. The sum of all base production is shown at the bottom of the graph (grey area).
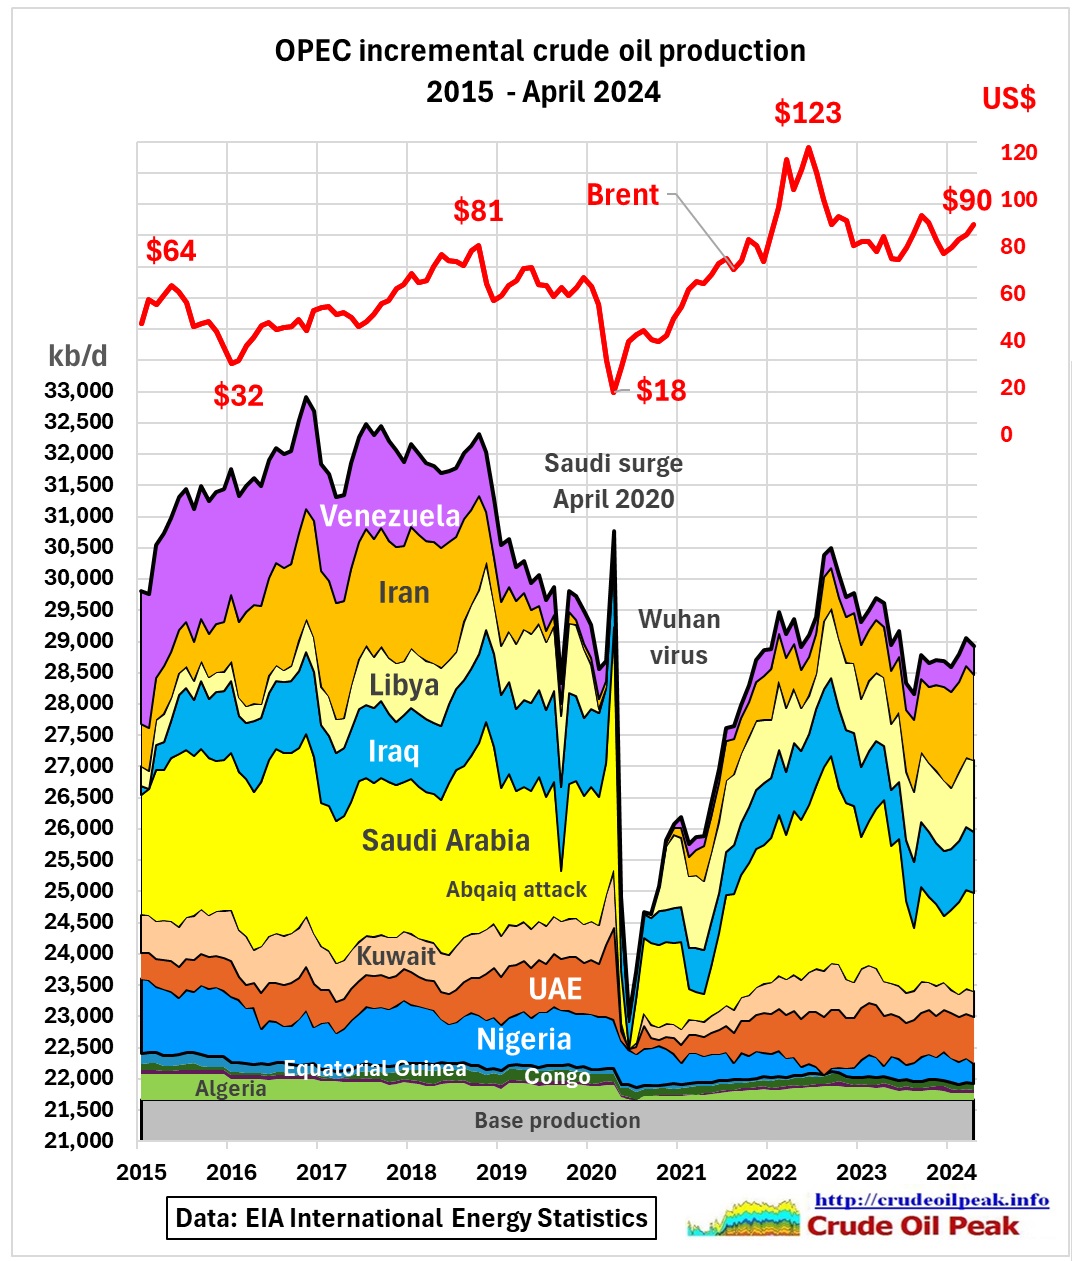 Fig 2: Incremental OPEC12 crude production 2015-Apr 2024
The OPEC12 peak 2016-2018 at 32 mb/d started to build up already in 2015 and was created by a combination of:
• In Iran on the upside a 1.1 mb/d production boost (500 kb/d above previous levels) between Dec 2015 and November 2018 due to the lifting of sanction after the Joint Comprehensive Plan of Action (JCPOA) deal was agreed in July 2015
• In Iran on the downside an equal fall in production after the reimposition of sanctions in May 2018 when the US withdrew from the JCPOA deal because of Iran’s non-compliance
• In Iraq on the upside an increasing production by 1 mb/d as part of a long recovery after the Iraq war in 2003
• In Venezuela on the downside a decline of 1.2 mb/d due to many factors Including the continuing decline in conventional oil fields and the problems to develop extra heavy fields in the Orinoco, where reserves are not oil but tar, exacerbated by political turmoil
• In Saudi Arabia in the 2nd half of 2018 a temporary production increase (including supply from storage) of 800 kb/d
• In Libya, despite several interruptions, a steady recovery of production by 500 kb/d after the 2nd civil war
The resulting decline after the peak of 32 mb/d continued into all of 2019 and reached 29.5 mb/d in December 2019.
After 2020, we can see that another production peak has shaped up, accompanied with increasing oil prices up to US $123/barrel, a level which usually damages the world economy if around for too long (in this case March – August 2022). This happened despite Saudi Arabia increasing oil production from 8.3 mb/d a year earlier to 10.5 mb/d by February 2022.
Comparing April 2024 production with end 2019, we get (w/o seasonal adjustments):
Iran: + 1.3 mb/d
All other countries: – 1.8 mb/d
Total OPEC 12 – 0.5 mb/d
Iran is bypassing sanctions by exporting oil in the dark fleet to China with transshipments east of Johor Bahru in the South China Sea.
Let’s have a look at crude production country by country and which events shaped the production profile:
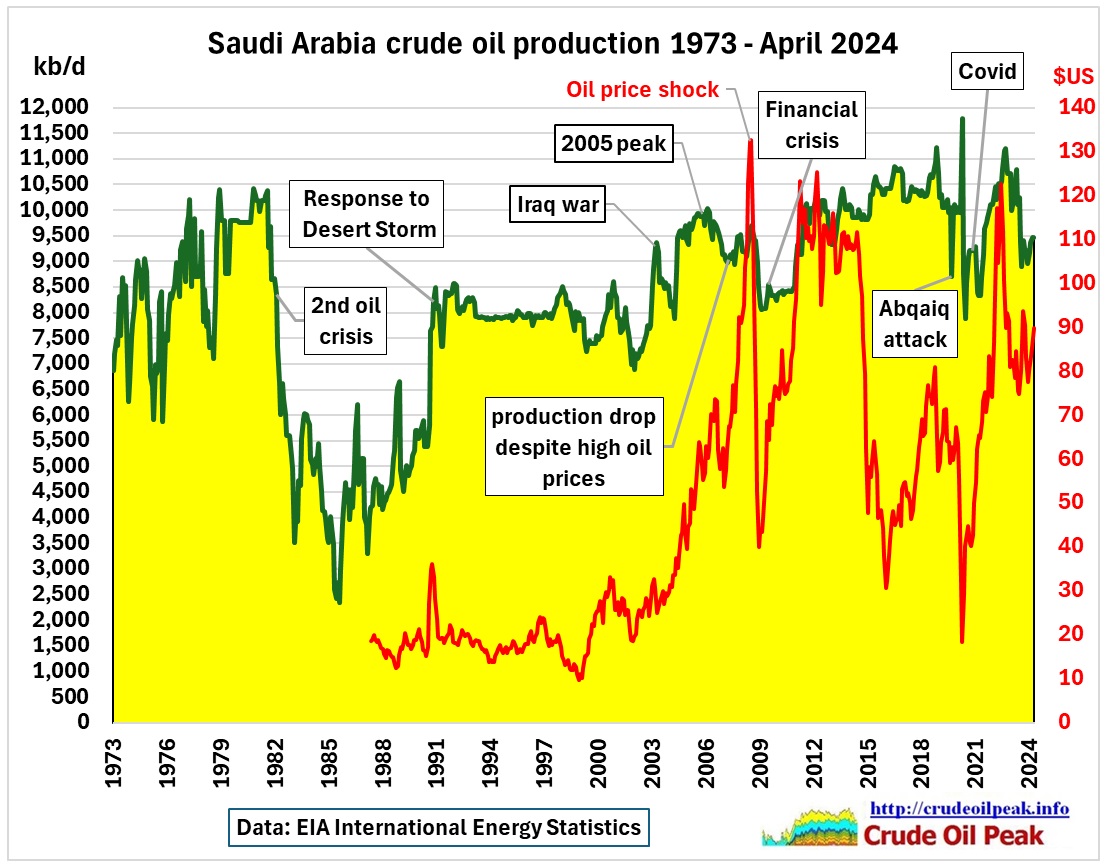 Fig 3: Saudi crude production and Brent oil price
Saudi Arabia dropped from Feb 2006 to Aug 2007. High oil prices caused the US recession in Dec 2007. The oil price shock was the result of the 2005 conventional peak and high Chinese demand for the Olympic Games in August 2008.
2/3/2011
WikiLeaks cable from Riyadh implied Saudis could pump only 9.8 mb/d in 2011
http://crudeoilpeak.info/wikileaks-cable-from-riyadh-implied-saudis-could-pump-only-9-8-mbd-in-2011
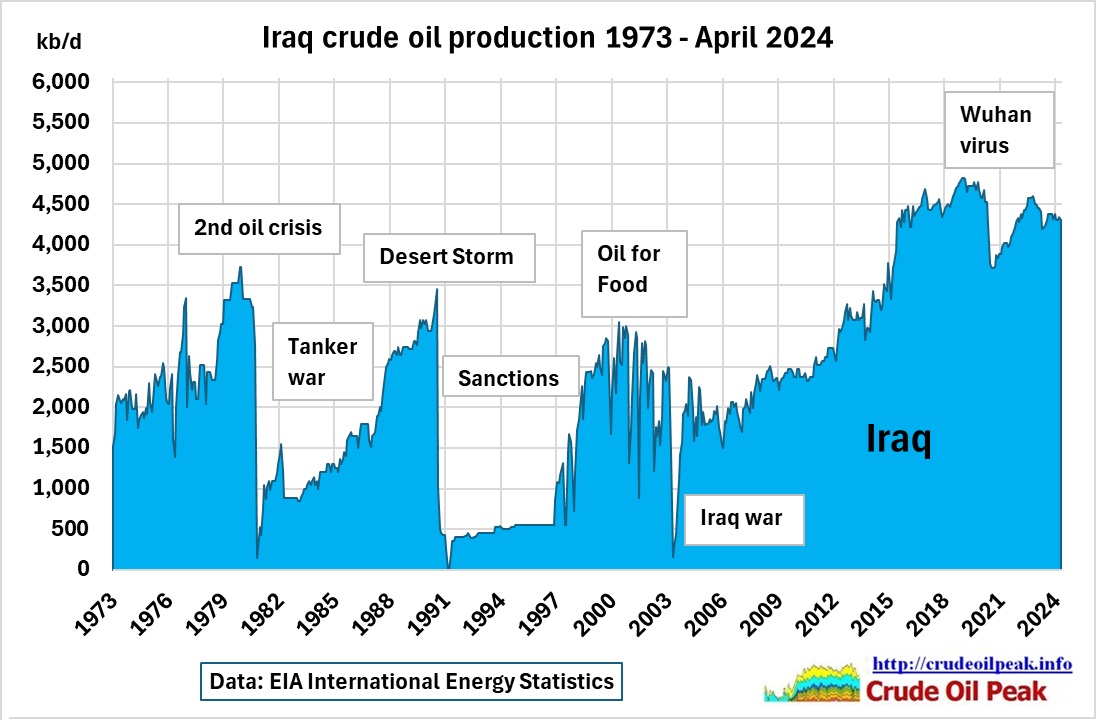 Fig 4: Iraqi crude production 1973 – April 2024
16/3/2013
Iraq war and its aftermath failed to stop the beginning of peak oil in 2005
https://crudeoilpeak.info/iraq-war-and-its-aftermath-failed-to-stop-the-beginning-of-peak-oil-in-2005
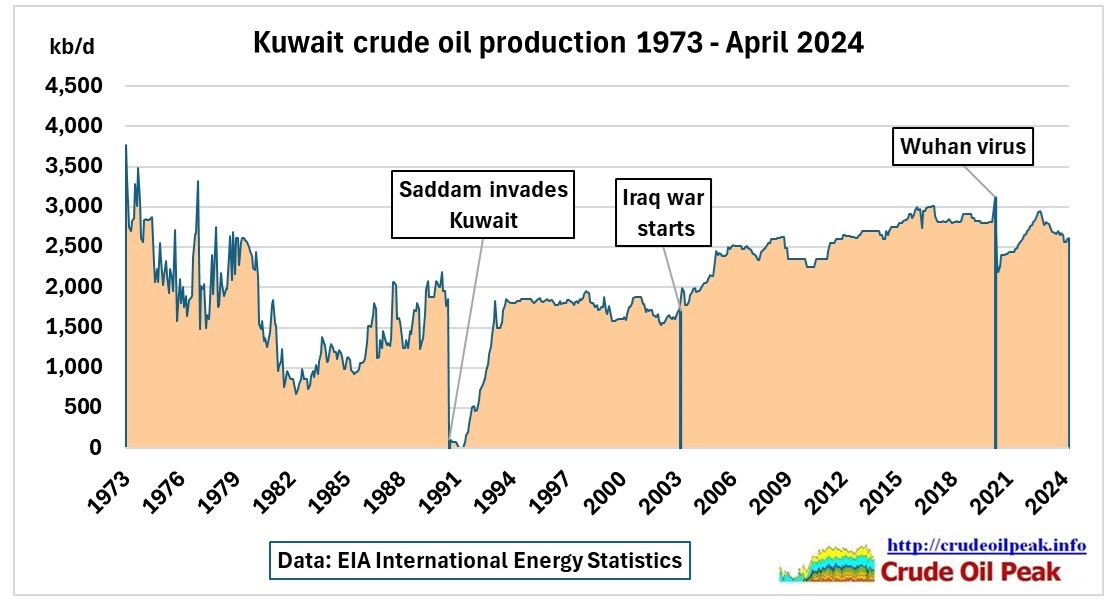 Fig 5: Kuwait crude production 1973 – April 2024
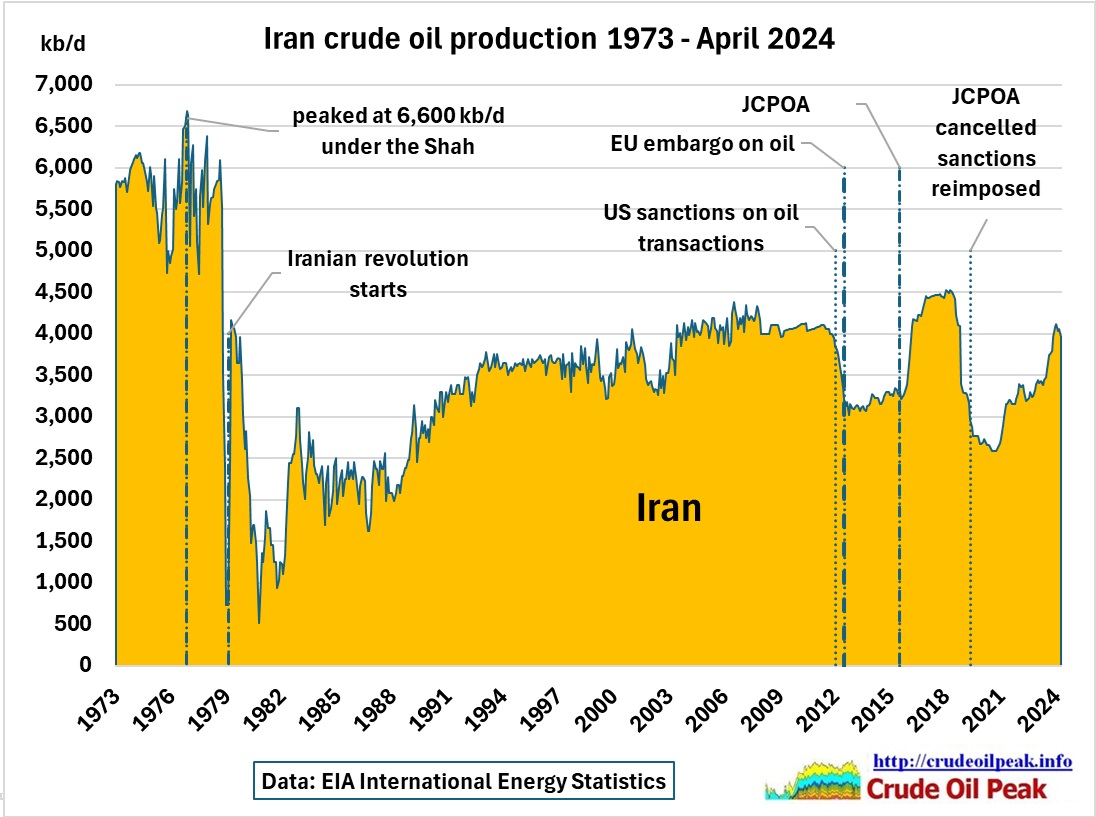 Fig 6: Iran crude production 1973 – April 2024
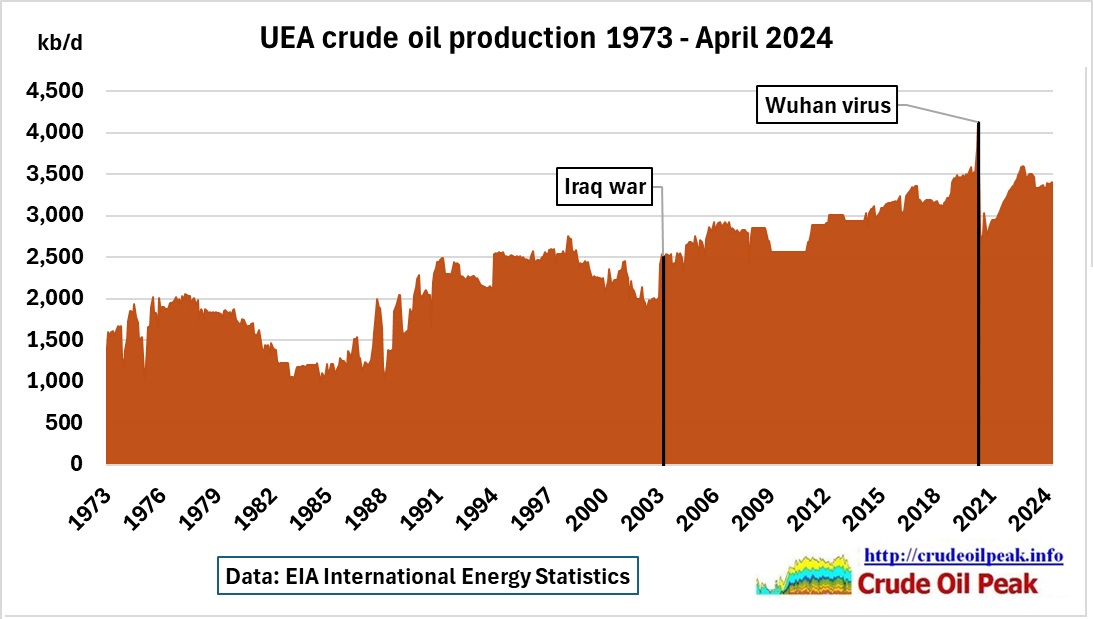 Fig 7: UAE crude production 1973 – April 2024
UAE is the only ME country which had a long-term increasing trend.
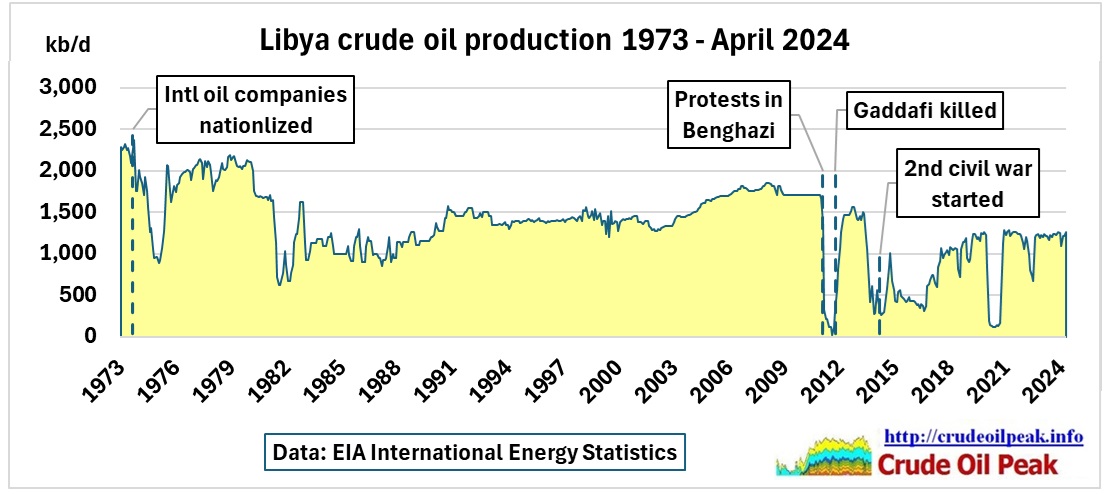 Fig 8: Libya crude production 1973 – April 2024
1973: The nationalization impacted Esso Standard Oil, Mobil Oil, Texaco Overseas, Asian Standard Oil Company of California, Libyan‐American Petroleum Company and British‐Dutch Shell Company for Exploitation and Production.
24/6/2011 War overshadows peak oil in Libya
https://crudeoilpeak.info/war-overshadows-peak-oil-in-libya
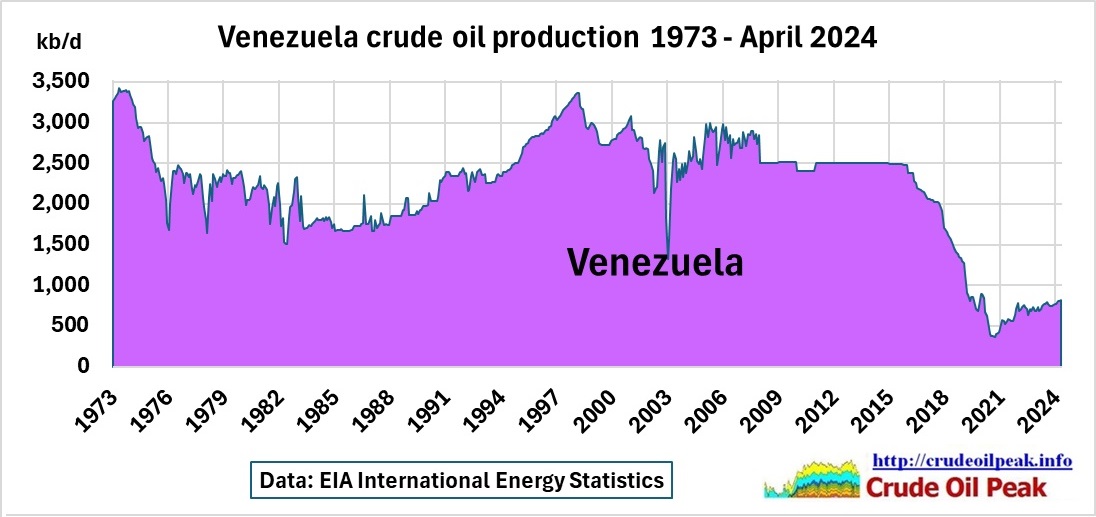 Fig 9: Venezuelan crude production 1973 – April 2024
2002/03 PDVSA worker’s strike
2006/07 nationalisation of oil industry
There is a similar graph to Fig 7 from the EIA on Venezuela:
https://www.eia.gov/todayinenergy/detail.php?id=60762
The unlikely horizontal part of the production curve results from unreliable data.
PDVSA stopped publishing data (PODE Petróleo y Otros Datos Estadísticos) in 2014. http://www.minpet.gob.ve/index.php/pode/
The combined production of the conventional oil fields Carito, Santa Barbara and Furrial peaked at 1,256 kb/d in 2007 and declined by a high 7% pa to 575 kb/d in 2018, for oil geological reasons (depletion). Details are here:
26/5/2018 Peak oil in Venezuela: El Furrial field with data up to 2016
http://crudeoilpeak.info/peak-oil-in-venezuela-el-furrial-oil-field
After the death of Hugo Chavez in March 2013, Nicolas Maduro came to power in a special presidential election (50.62% of vote). Shortages and decreasing living standards led to widespread unrest. At the same time, financial sanctions (access to credit for PDVSA and other companies in the oil industry) were imposed on the Maduro regime for human rights violations, corruption and undermining democracy. A downward spiral with negative feedback loops.
May 10, 2016
Halliburton will join other oilfield service providers trimming down operations in Venezuela amid depressed oil prices and rising costs, along with the difficulty of getting payment on receivables.
https://oilprice.com/Latest-Energy-News/World-News/Low-Oil-Prices-Prompt-Halliburton-to-Trim-Operations-in-Venezuela.html
The underlying oil-geological problem is that most of Venezuela’s remaining reserves are tar, not oil. The media don’t tell the public this vital fact. The life of proven reserves at a production rate of 1 mb/d is just 14 years, according to Rystad:
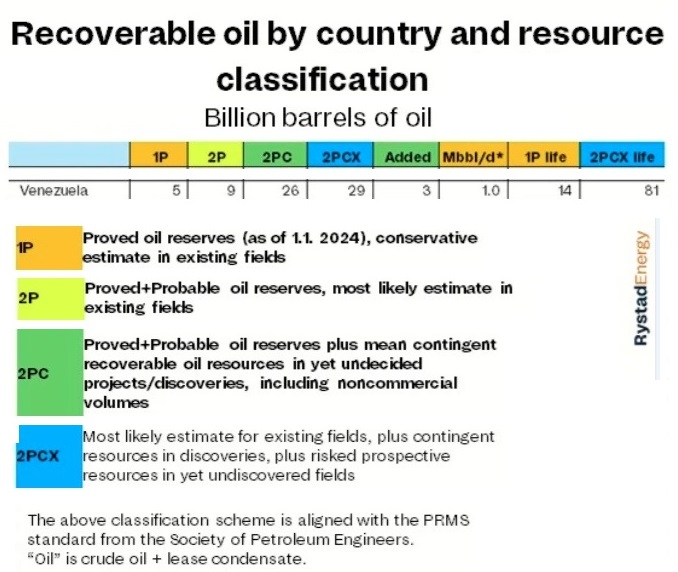 Fig 10: Venezuela’s oil reserves and resources as at 1 Jan 2024
https://www.rystadenergy.com/news/global-recoverable-oil-barrels-demand-electrification
31 July 2024
• Orinoco Belt crude production rises to 595,000 b/d
• Venezuelan crude exports tumble
• Post-election unrest offers murky outlook
Venezuela’s oil production by state-owned PDVSA and its foreign partners rose to 993,000 b/d in July, 85,000 b/d over June, according to the estimated data included in the PDVSA production report reviewed by S&P Global Commodity Insights.
https://www.spglobal.com/commodityinsights/en/market-insights/latest-news/oil/073124-venezuela-data-july-crude-production-nears-1-million-bd
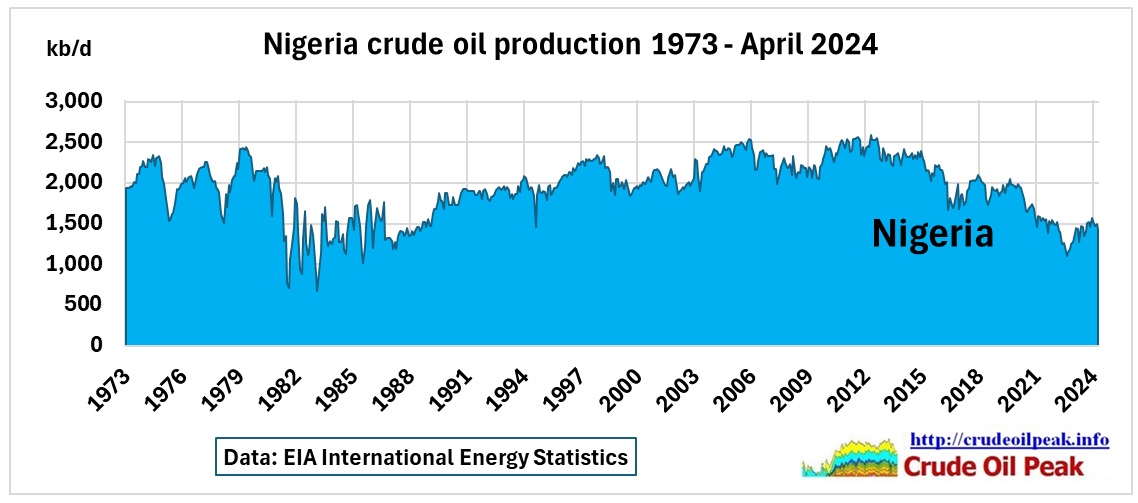 Fig 11: Nigeria Crude production 1973 – April 2024
Nigeria’s production is down now from the 2006 and 2012 peaks by around 1 mb/d, 500 kb/d down from 2018.
Conclusion:
When Saudi production was maxed out at the 2nd, lower 2022 peak, production was 2 mb/d lower than in 2018. It will be difficult for the UAE, Kuwait and Iraq to lift production by that amount if that were required.