We pick up the question from part 1:
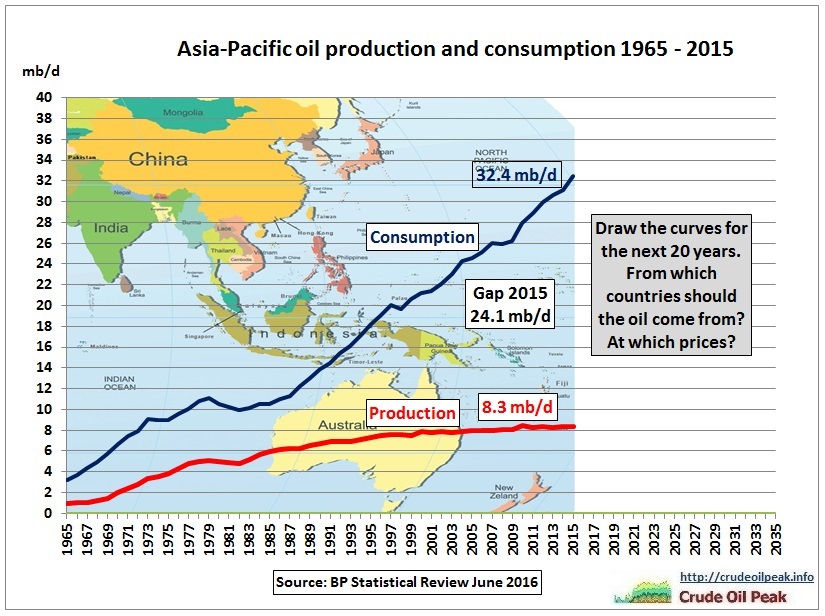
Fig 11: Homework for governments
Let’s have a look where all the net imports into Asia have come from in the past:
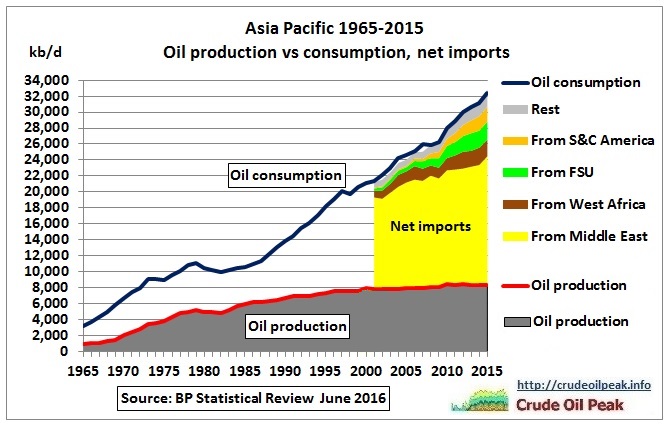
Fig 12: Asia net imports – overview
BP’s data on inter area oil movements start in 2001. Oil imports from the Middle East increased from 11.5 mb/d in 2001 to 15.5 mb/d in 2015 or 4 mb/d. This is an amazing “performance “ because Middle East exports to all countries increased only by 0.8 mb/d (crude) and 0.7 mb/d (products) in 15 years!
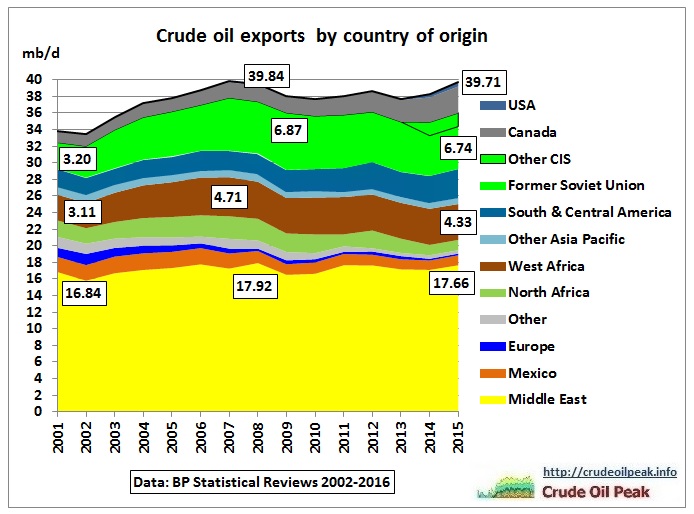
Fig 13: World’s crude oil exports
Global crude oil exports in 2015 were not higher than in 2007. Canadian exports (dirty tar sands mainly to the US) increased by 1.9 mb/d since 2001.
Middle East exports to Asia
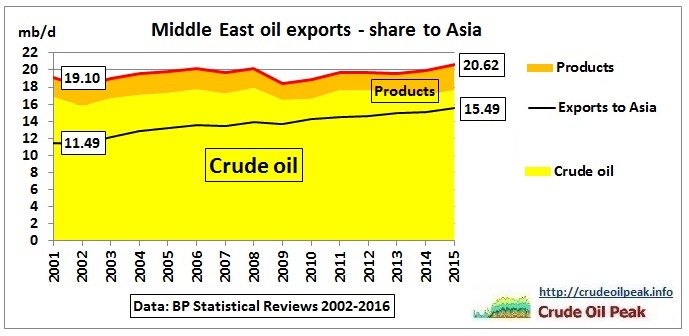
Fig 14: Middle East oil exports share to Asia
Asia’s share of Middle East exports has increased from 60% in 2001 to 75% in 2015. Let’s have a look to which countries/regions these Middle East exports go:
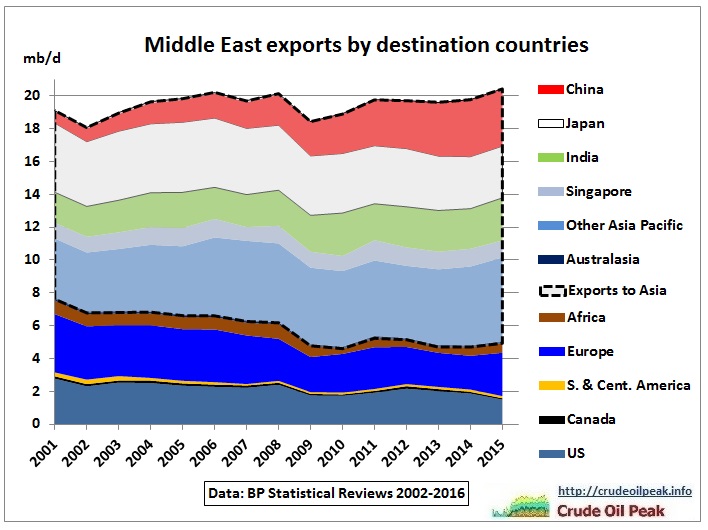
Fig 15 Middle East oil exports by destination
In the above graph we stack Asian countries on top of other countries which shows that Asia took away Middle East exports from the US and Europe which are in decline.
So how would that continue into the future? Let’s do a very simplified trend analysis without regard to oil prices, the type of oil, oil reserves and geo-political events and assuming no declining oil production in Asia.
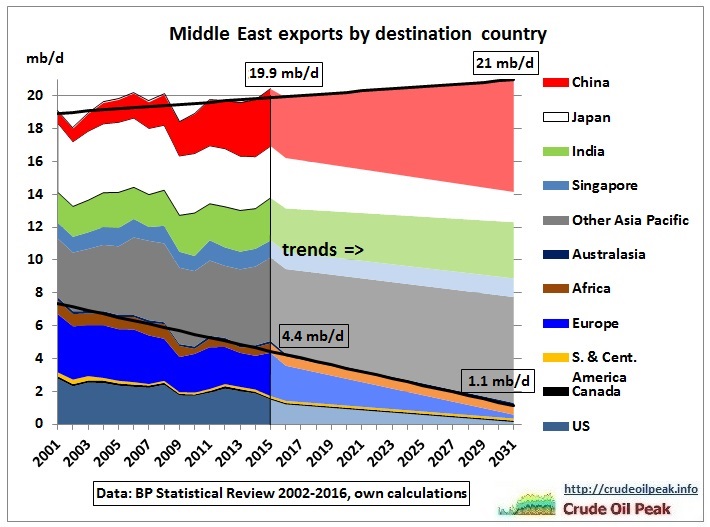
Fig 16: Trend projection for Middle East exports
The graph shows actual Middle East oil exports to all countries between 2001 and 2015 (as in Fig 15) and then linear trend projections until 2031, separated by a vertical line (ignore optical illusion). Since ME exports are limited there will be 2 types of fights for market share
- Within Asia – mainly between Japan and the rest of Asia
- Against the rest of the world – mainly the US and Europe
Middle East oil exports to Asia have been growing at 270 kb/d pa in the period 2001-2015, 74% or 200 kb/d pa out of which have been diverted away from Europe and the US. Only 70 kb/d (26%) have come from an increase in total Middle East exports.
On current trends, by 2031, Middle East exports to Asia would have to increase by 4.4 mb/d. Just 1.1 mb/d are to come from an all-over increase of ME exports while Non-Asian countries would have to surrender 3.3 mb/d to Asia. This implies a dramatic 75% drop from 4.4 mb/d in 2015 to just 1.1 mb/d in 2031. Assuming ME exports to Africa continue at current levels (light brown area), exports to Europe and the US would practically have to peter out to negligible volumes.
If ME exports were to stay flat all of these exports would have to go to Asia in order to satisfy the growing trend as shown in the following graph.
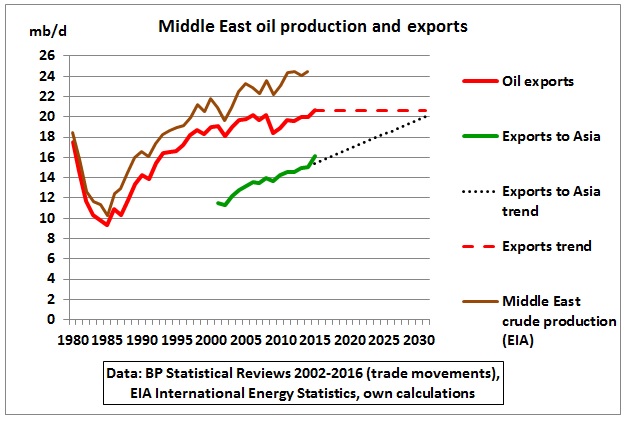
Fig 17: Asia’s share of ME exports trending towards 100%
West Africa exports to Asia
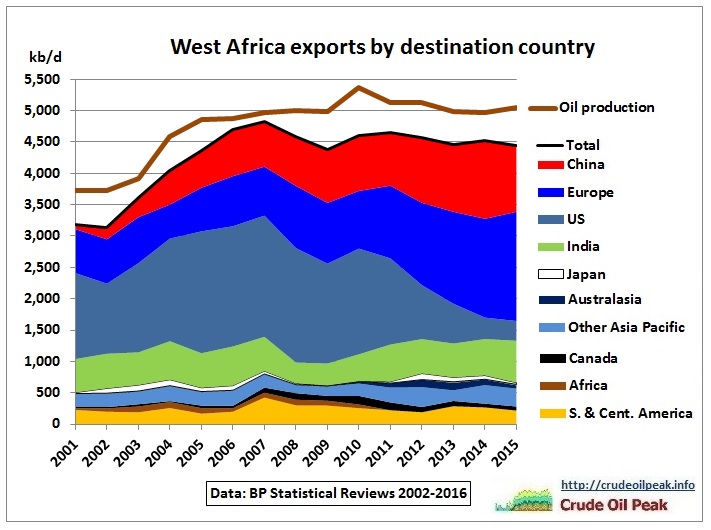
Fig 18: West African oil exports
The graph is stacked in such a way that the main players are on top.
West African oil production is practically at peak for 10 years (brown curve). Exports peaked in 2008 and are in modest decline since 2011. Almost all exports (97%) are crude exports, the rest product exports.
Exports to the US peaked in 2006-08 as a result of lower demand (US recession in 2007). After 2010 US shale oil replaced West African light oil imports. The biggest winner from this US import substitution was Europe. But Asia also benefitted from this change as can be seen in this graph:
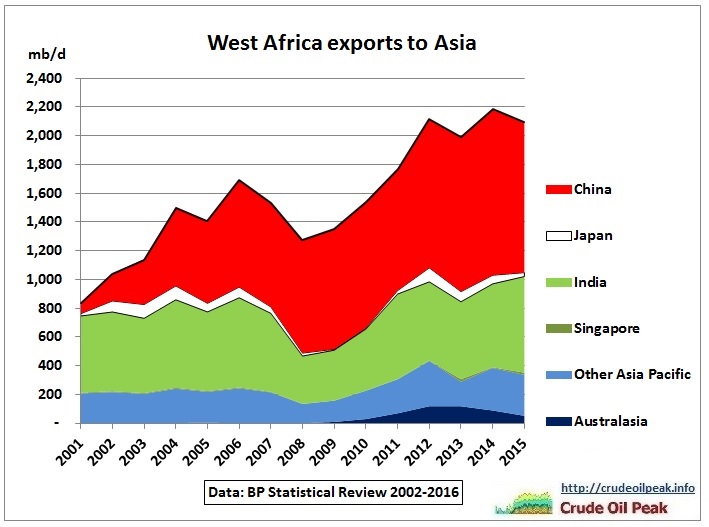
Fig 19: West Africa exports to Asia
There are 2 growth phases: growth from Angola, US decline due to high oil prices and then replacement by US shale oil. Exports are now on a bumpy plateau for 4 years.
Given that Angola is peaking and Nigeria is fighting a continuing war with rebels sabotaging oil facilities
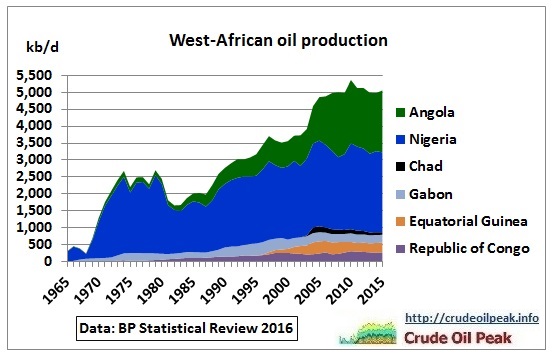
Fig 20: West African oil production
there is little scope for an increase in West African exports.
From Fig 18 we can see that the US substitution of West African light oil by shale oil has basically come to an end so the competition for West African exports will be between China and Europe. Indian imports from West Africa have not increased.
So what would happen if current trends continued:
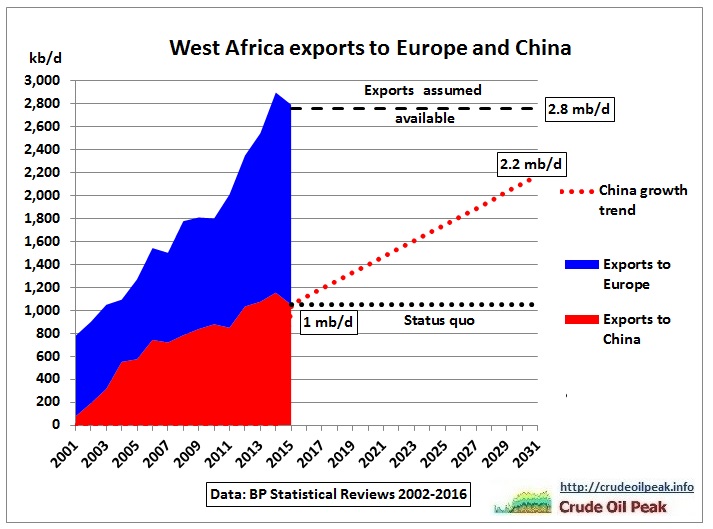
Fig 21: Trend projection for West African exports
Both Europe and China increased their imports from West-Africa by around 70 kb/d pa in the last 15 years. This cannot continue. As one example of the many potential scenarios, the red dotted line shows the Chinese trend. The status quo means that China would not be able to get more oil from West Africa.
Exports from Former Soviet Union
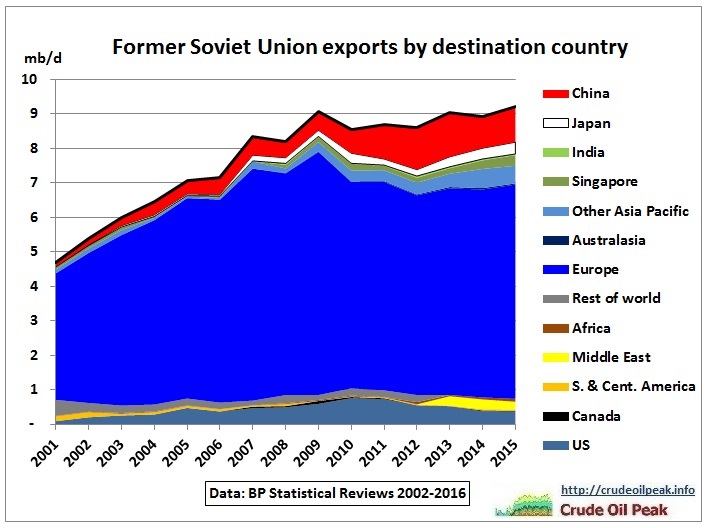
Fig 22: FSU exports by destination country
2/3 of FSU exports go to Europe. Separate Statistics for Russia and other CIS (Commonwealth of Independent States) are only available in the latest BP Review. Exports to Asia are 86% from Russia and 14% from other CIS. Exports to Europe are 80% from Russia and 20% from other CIS.
Let’s have a look at oil production which underpins exports:
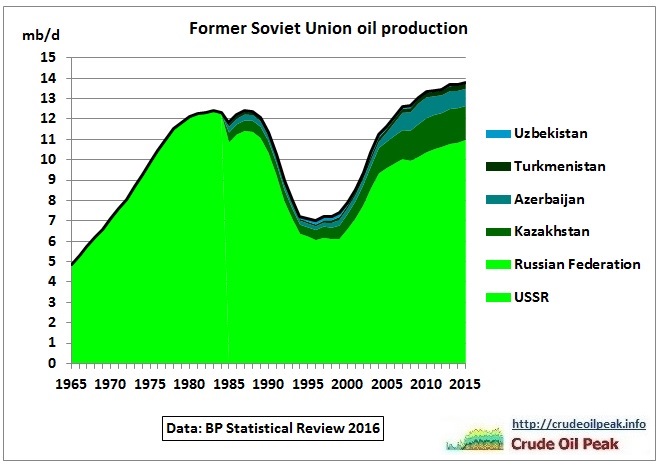
Fig 23: FSU oil production
Russian oil production has been inching up slowly on its way to the 2nd and last peak – beyond the 10.5 mb/d limit many analysts thought would be the upper boundary. The increase was around 1 mb/d over a long period of 8 years. However, other CIS countries peaked in 2010 and are in modest decline, especially Azerbaijan:
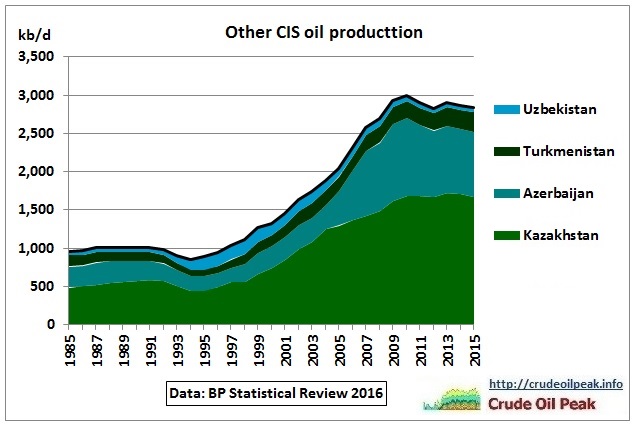
Fig 24: Other CIS oil production
So we cannot expect any substantial increase in FSU exports
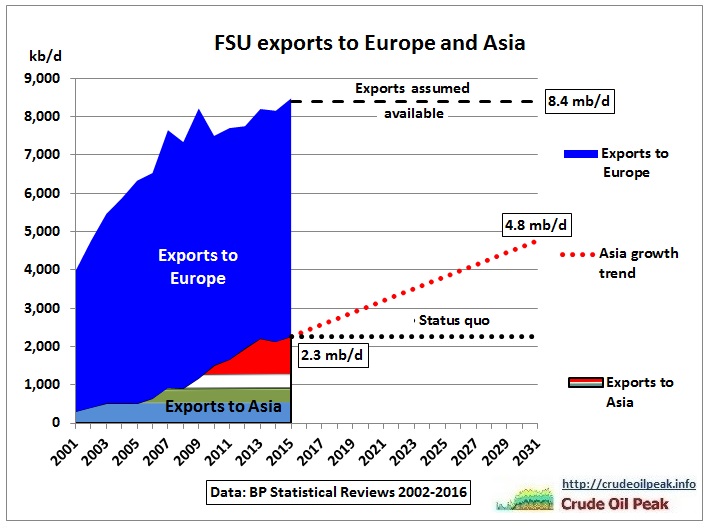
Fig 25: Trend projection for FSU exports
If Asian import trends were to continue this would eat up around 40% of FSU exports to Europe within the next 15 years.
Exports from South and Central America
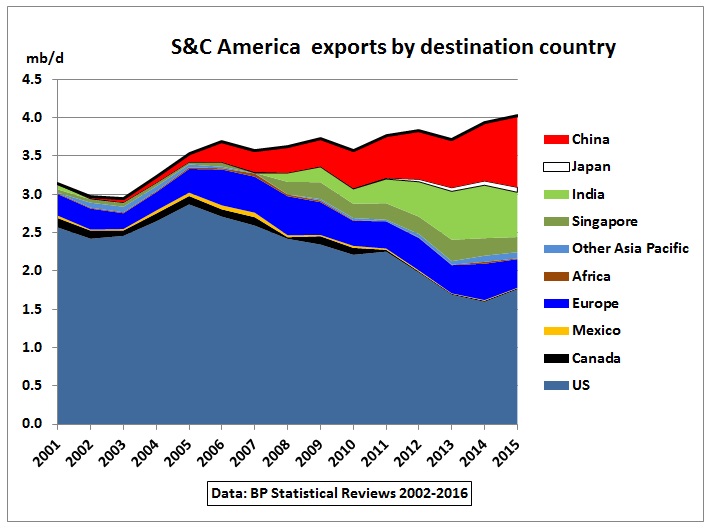
Fig 26: South and Central America oil exports
We assume that Brazil continues to grow as in EIA’s International Energy Outlook (May 2016) p 224 http://www.eia.gov/forecasts/ieo/pdf/0484(2016).pdf which would allow the export trend visible in Fig 26
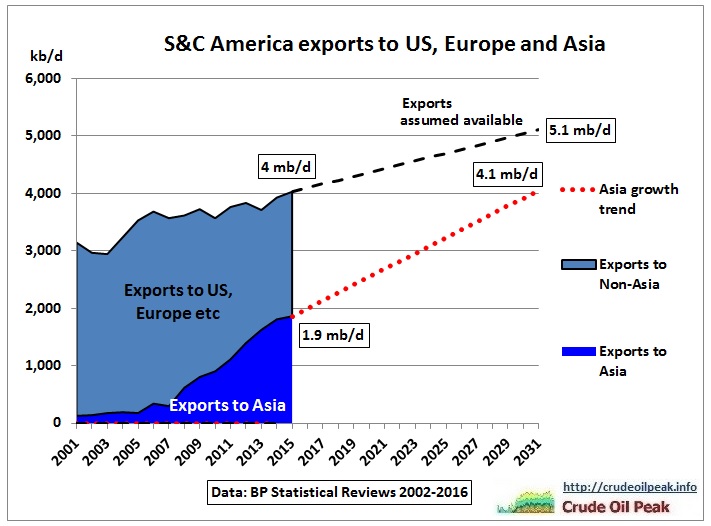
Fig 27: Trend projection for C&S America exports
Incidentally, the 3 trends match. Note that the US and Europe could only import 1 mb/d by 2031
Rest of World
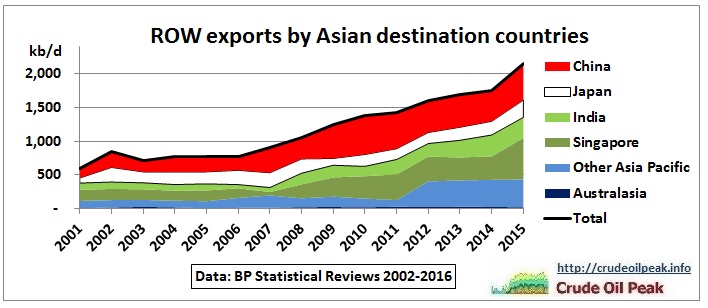
Fig 28 ROW exports to Asia
In 2015, Asia imported around 2.2 mb/d (of about 14 mb/d) from countries/regions not yet covered above (ROW)
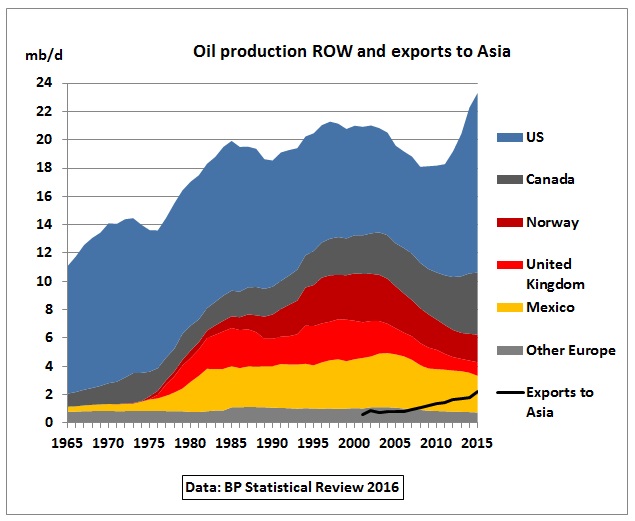
Fig 29: ROW oil production and exports to Asia
Oil production in Europe and Mexico have peaked. So not much crude oil can be exported from there. But Europe exports 700 kb/d of products to Asia meaning it is importing surplus crude and refining it into fuels for export.
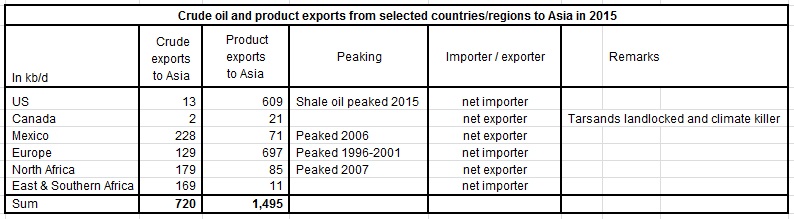
Fig 30: Crude and product exports from ROW countries to Asia
The US ban on crude exports was lifted in December 2015 so this did not have an impact on US crude exports in 2015.
The past trend in Fig 28 suggests that Asia requires another 1.5 mb/d by 2031. It is neither easy nor meaningful to make a trend-analysis with so many other countries involved. We assume that half of this requirement can be obtained.
Risks
There are many risks to the scenarios above. Here are some:
- Confrontation in the South China Sea over oil and gas fields
- Continuing low oil prices leading to bankruptcies of oil companies
- Pre-salt oil production in Brazil no longer viable
- Venezuela collapses
- Disintegration of the Middle East
Summary
In a business as usual demand case (linear trends), Asia needs an additional 11 mb/d of oil imports (crude and products) by 2031. That oil would have to come from following sources
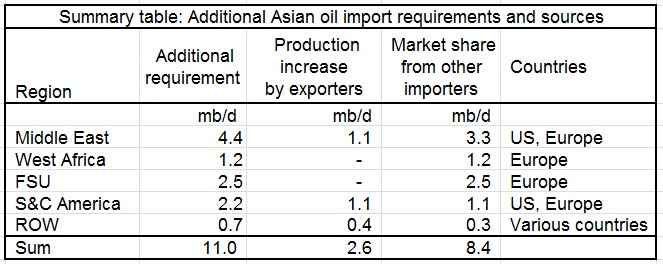
Fig 31: Summary table
8.4 mb/d or 76% would have to come from taking away market share of other importing countries. That’s what the Asian Century will be all about.