The Energy Institute published its first Statistical Review on 25 June 2023, thereby replacing the BP Statistical Review
https://www.energyinst.org/statistical-review
Let’s have a look at oil production and consumption in South East Asia and India. After all, this is one of the key regions in the world where perpetual growth is expected.
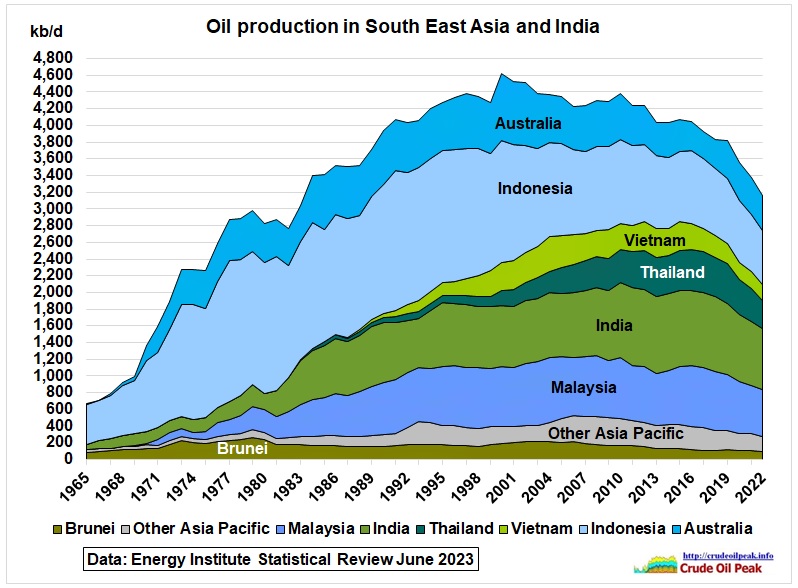
Fig 1: Oil production peaked in 2000
This peak year came about by a production spike in Australia which peaked in that year. Without Australia we observe a bumpy production plateau between 1995 and 2016 (20 years). Annual decline rates in the last 3 years have accelerated to 5% – 7% pa. We do not know how much of that is due to Covid.
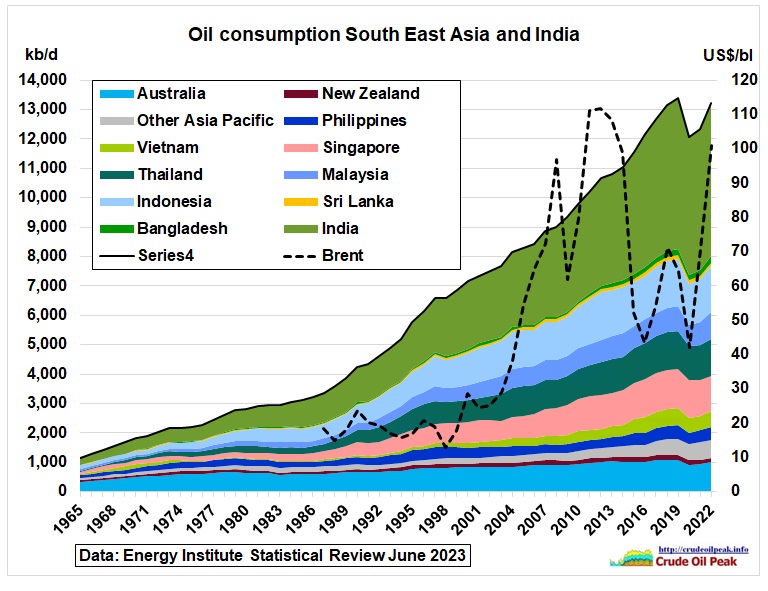 Fig 2: Oil consumption in South East Asia and India
The Wuhan virus stopped unsustainable oil consumption growth much more than any other crisis before. That tells us that dramatic events must happen to reign in oil demand.
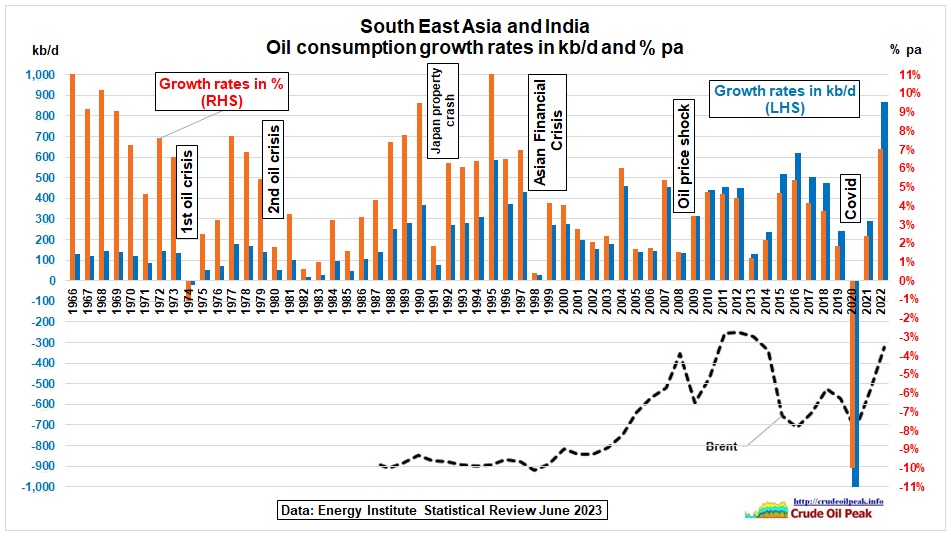 Fig 3: Oil consumption growth rates in kb/d and percent
Oil consumption took off in the mid 1980s when growth rates were 6.5% pa on average. The 1997 Asian financial crisis (originated in Thailand) reduced the growth rates by half. After the 2008 oil price shock, growth varied between 1 % and 7%. Covid was a roller-coaster. Note that consumption is now so high, that a 3% increase in 2022 is 400 kb/d. If that continued for another 10 years the cumulative growth would be more than the total current annual production.
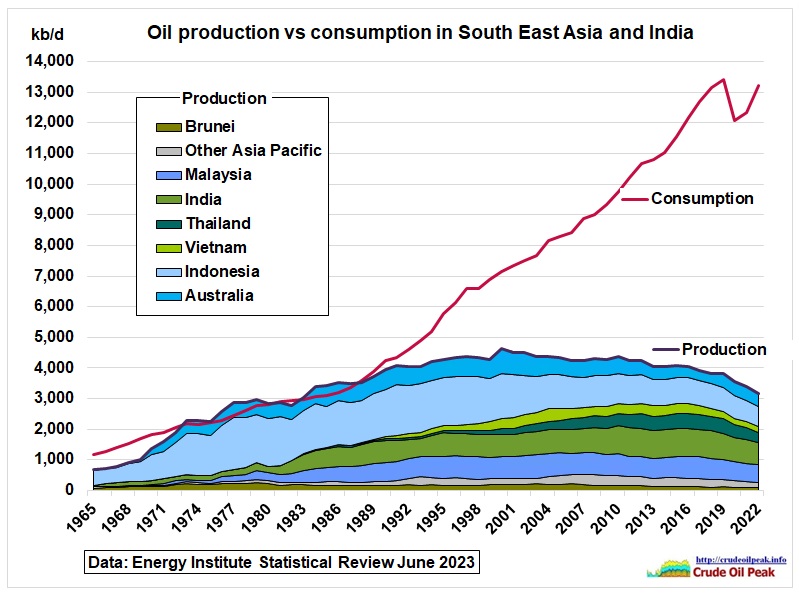 Fig 4: Consumption vs production
Up, up and away: consumption in 2022 was more than 4 times production equal to a 76% import ratio which was just 35% in the peak production year 2000. Compared to that year, the oil production decline was 1.5 mb/d while the oil consumption increase was 8.6 mb/d. This means the peak oil problem is around 6 times more an oil import problem than a production problem.
Let’s have a look at individual countries:
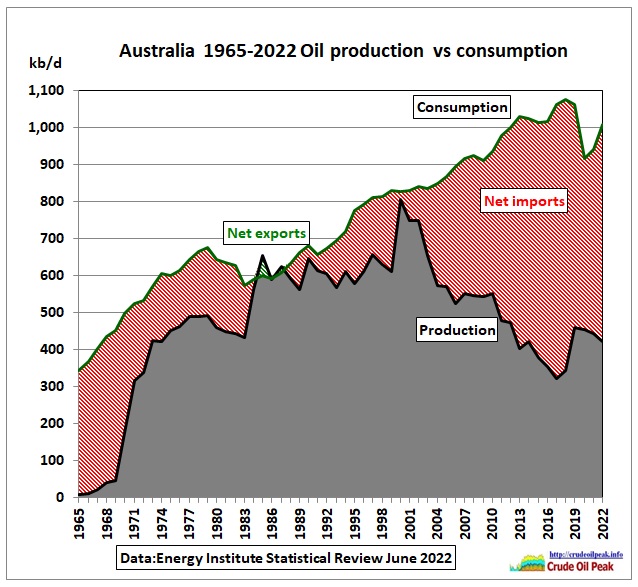 Fig 5: Australia import ratio 58% (-2% pa last 5 years)
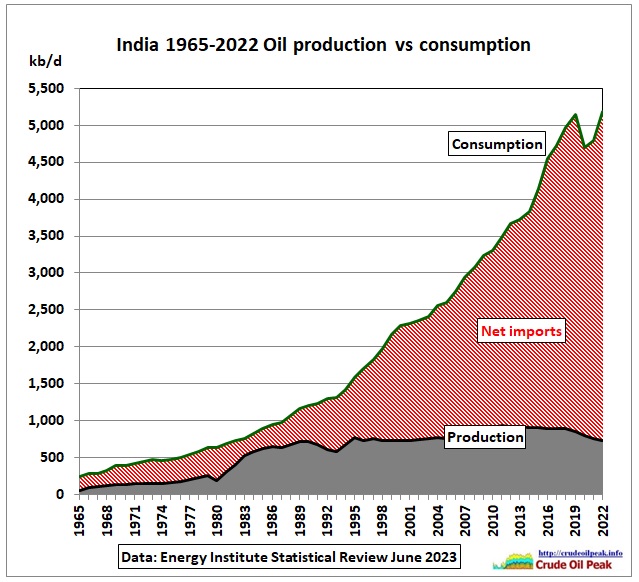 Fig 6: India import ratio 86% (+0.7% pa last 5 years)
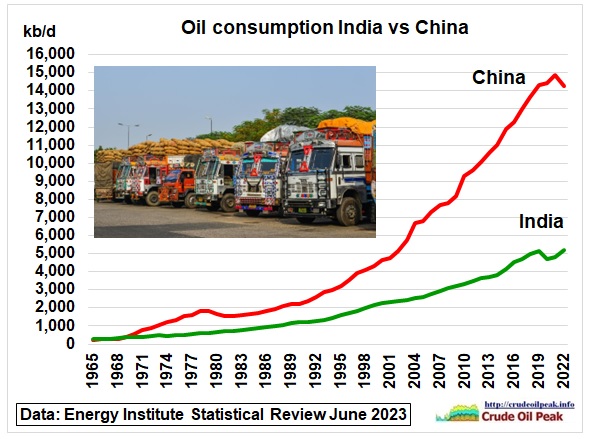 Fig 7: Oil consumption India vs China
All those who think India will become a 2nd China, should think hard where the oil will come from.
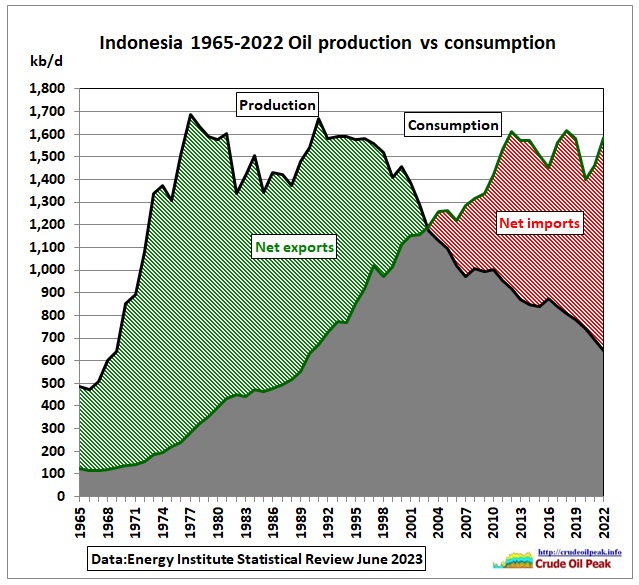 Fig 8: Indonesia import ratio 59% (+1.9% pa last 5 years)
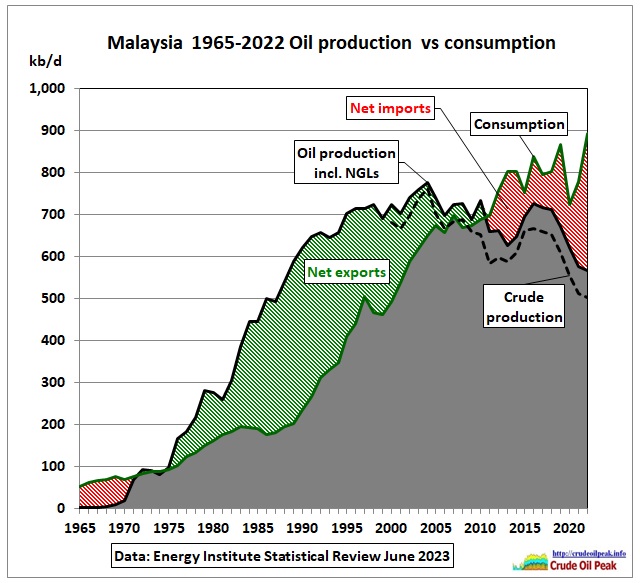 Fig 9: Malaysia import ratio 37% (+5.1 % pa last 5 years)
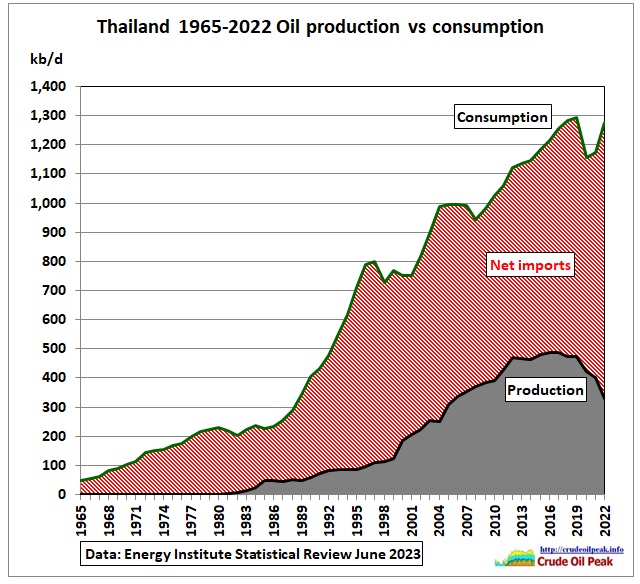 Fig 10: Thailand import ratio 74% (+2.2 % pa last 5 years)
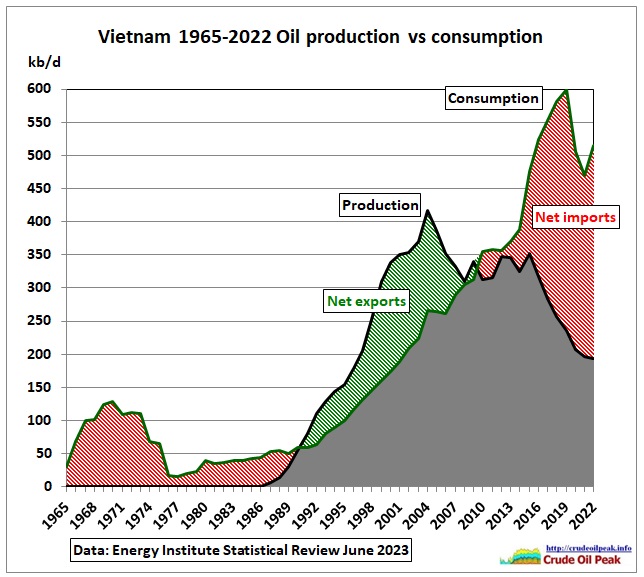 Fig 11: Vietnam import ratio 62% (+1.3% pa last 5 years)
Preview part 2: Asian oil imports
EI statistics do not have import data on South East Asia separately but on 6 regions/countries as shown along the x-axis in the following graph:
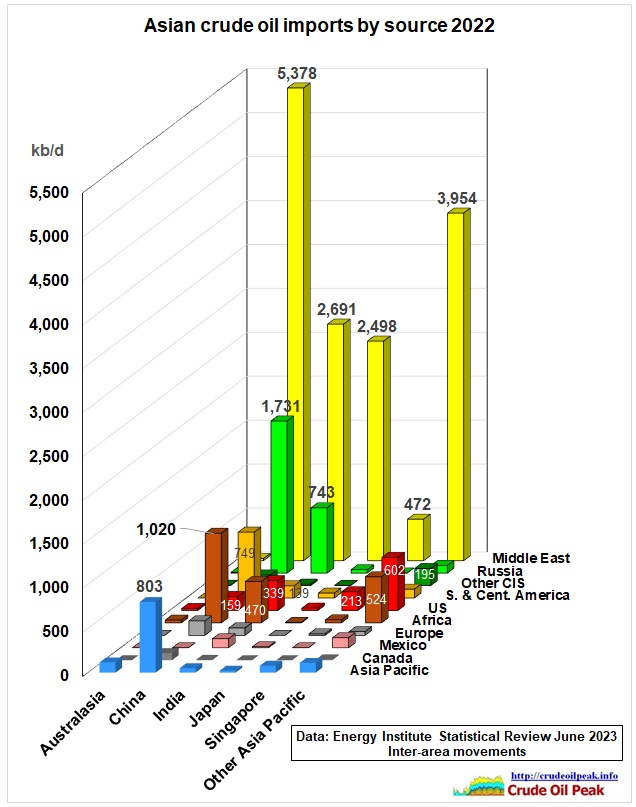 Fig 12: Asian crude imports by source
The crude trade in the above graph is 24.3 mb/d (57% of the global total). The import dependence on the Middle East is 62%, on Russia 11%.