We continue to look at the oil supply balances country by country. All oil producers in Asia are now in post-peak oil mode i.e. they are net oil importers.
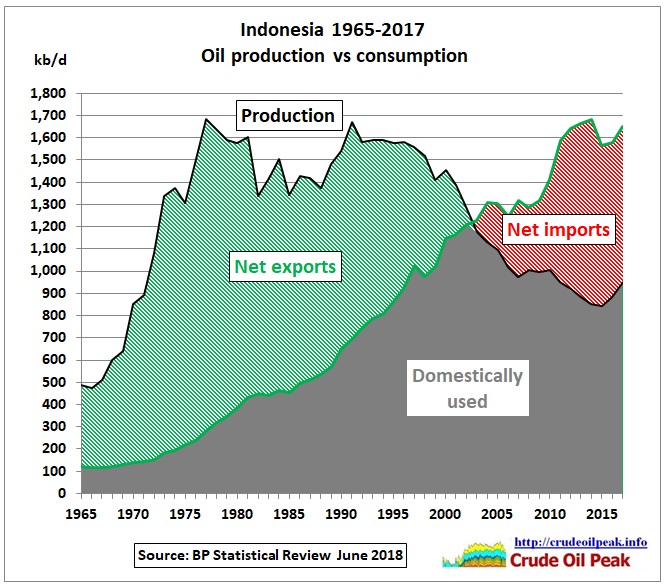 Fig 1: Indonesia
Indonesia became a net oil importer in 2003. Until that year, Indonesia’s oil consumption grew at an average of 6.5 % pa but since then went through a roller coaster change from -0.4% in the crisis year 2005 to +12.6% in the commodity boom year 2011 and down to -6.9% in the commodity bust year 2015.
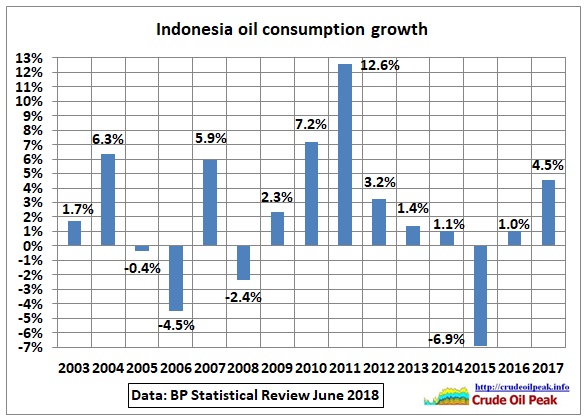 Fig 2: Highly variable consumption growth
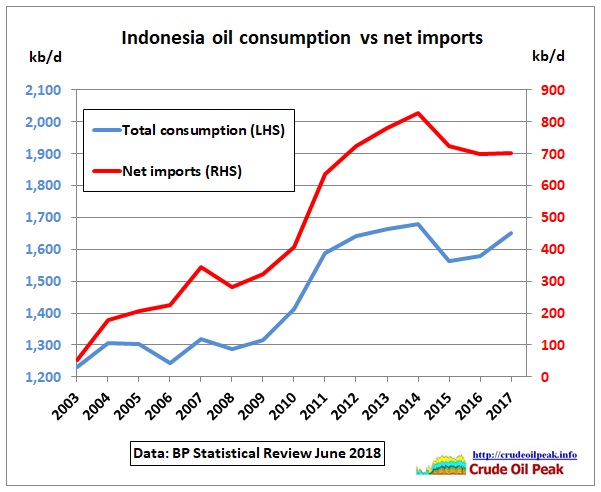 Fig 3: Indonesia as net oil importer
In the period 2003-2014, Indonesia’s annual net oil imports increased from zero to a maximum of 800 kb/d , but have moderated to 700 kb/d in the last 3 years. Net imports grew faster than consumption, very typical for oil producing countries which have become net importers.
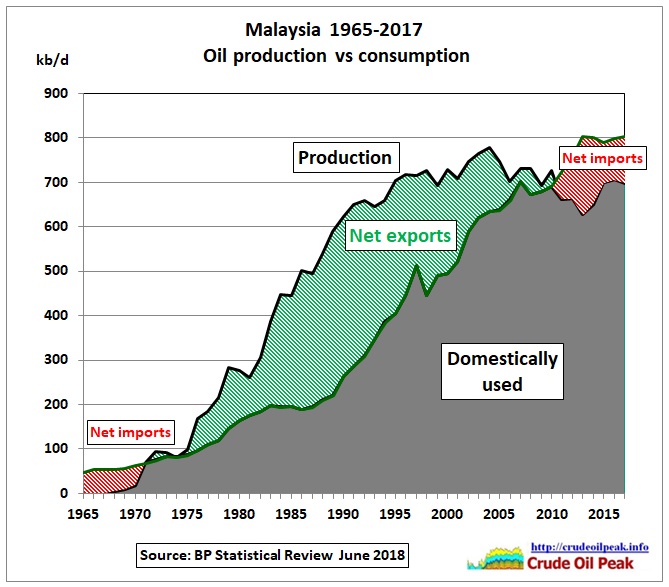
Fig 4: Malaysia net oil imports
Malaysian oil production peaked 2004 but did not decline much. Net oil imports started in 2011 but consumption growth came to an end in 2014 so net oil imports remained limited at around 100 Kb/d.
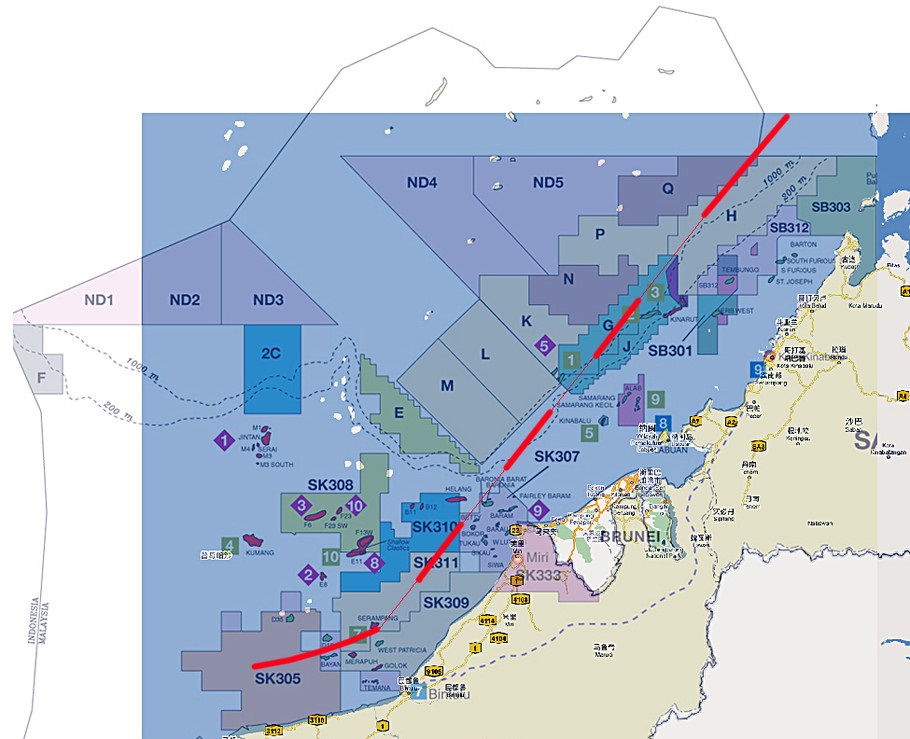 Fig 5: China’s 9 dash line offshore East Malaysia
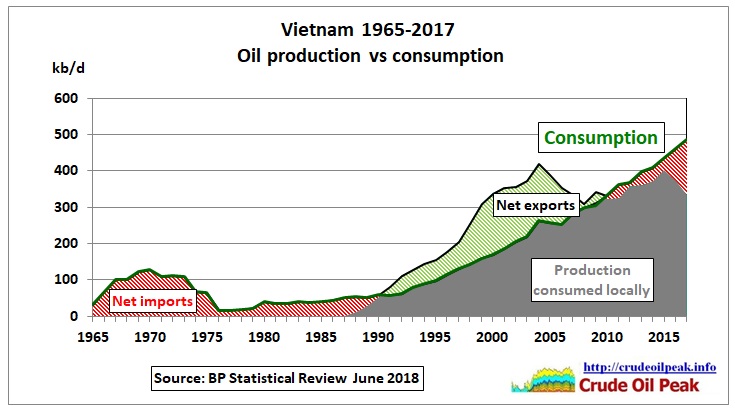 Fig 6: Vietnam oil consumption
Vietnam’s oil consumption has been steadily increasing, in the last 10 years at 6% pa. Vietnam became a net oil importer in 2010 with imports running at around 6% of consumption until oil production reached a 2nd peak in 2015. In 2017, Vietnam’s net imports were 31% of consumption.
28/12/2016
Exxon plans to produce gas close to China’s 9-dash line
http://crudeoilpeak.info/exxon-plans-to-produce-gas-close-to-chinas-9-dash-line-claim
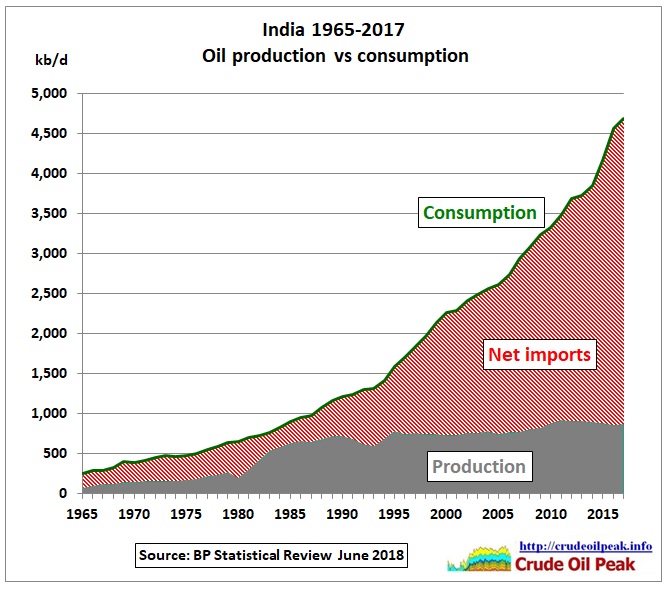 Fig 7: India oil production vs consumption
India’s consumption has been growing exponentially until 2009
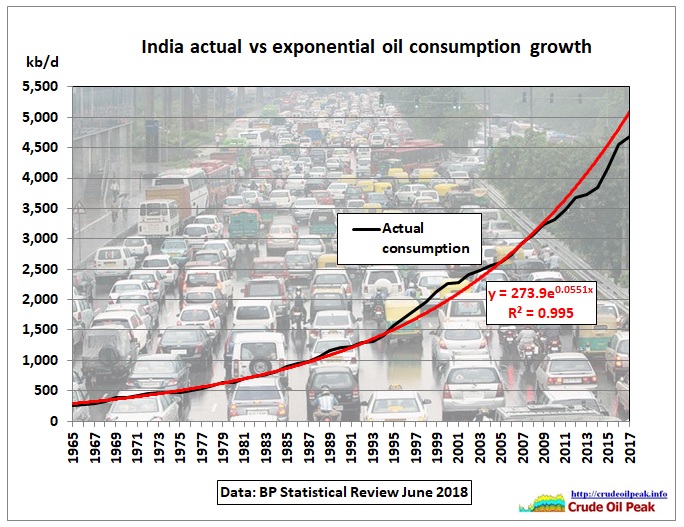 Fig 8: Indian oil consumption trend 1965-2017
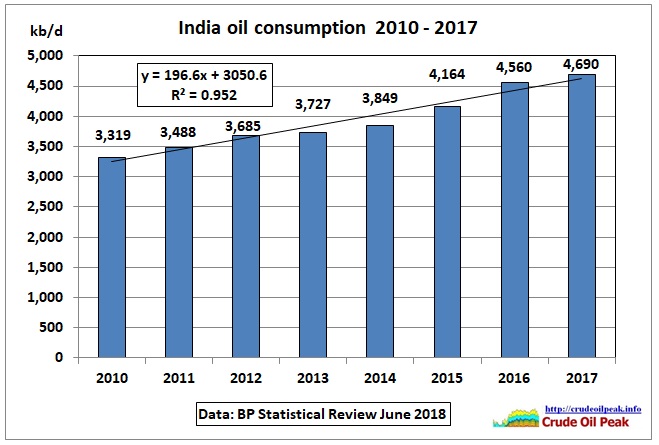 Fig 9: India oil consumption trend 2010-17
The above graph includes a linear trend at around + 200 kb/d but there could also be another exponential trend at a lower level than before 2010.
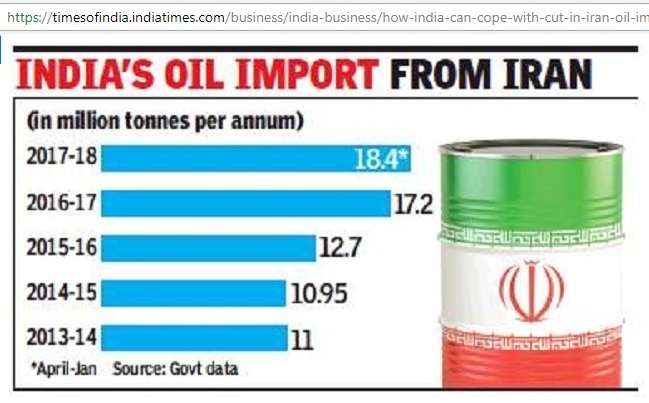 Fig 10: India imported 350 kb/d from Iran in 2017/18
https://timesofindia.indiatimes.com/business/india-business/how-india-can-cope-with-cut-in-iran-oil-imports/articleshow/64790637.cms
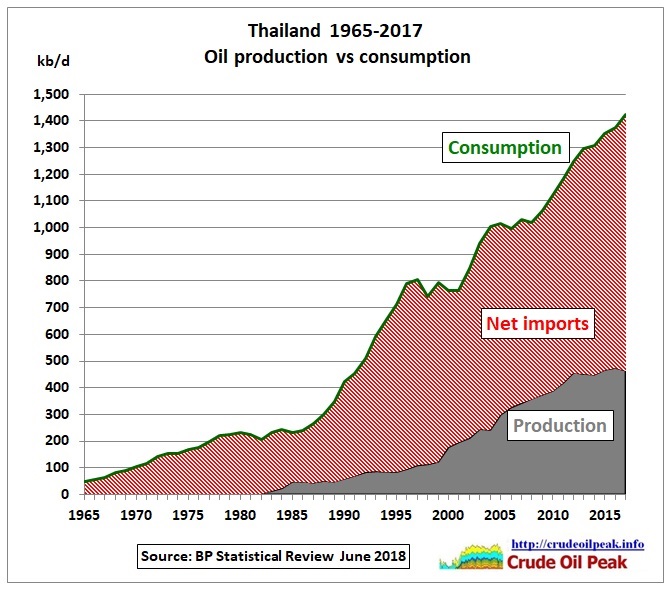
Fig 11: Thailand oil production and consumption
Thailand was always a net importer of oil.
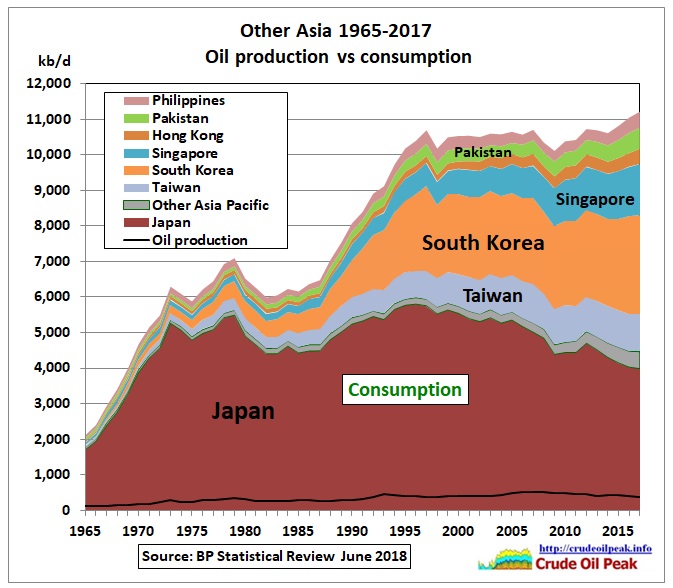 Fig 11: Asian countries with no or little oil production
This group is dominated by Japan with declining consumption which allowed other Asian countries to import the oil Japan saved. But recently there was an uptick in oil consumption and Japan’s continuing consumption decline could no longer offset that growth.
Conclusion
All Asia Pacific countries are now net oil importers. This means that there will be a lot of competition among these countries once the global oil supply situation gets tight.
Previous posts:
12/8/2018
Peak oil in China and the Asia Pacific (part 2)
http://crudeoilpeak.info/peak-oil-in-china-and-the-asia-pacific-part-2
18/6/2018
Peak oil in Asia Pacific (part 1)
http://crudeoilpeak.info/peak-oil-in-asia-pacific-part-1