This post on power supplies will be updated from time to time as we sweat through the coming days. Figs 1,3 and 4 are based on data available on Fri, 27th Jan 2017
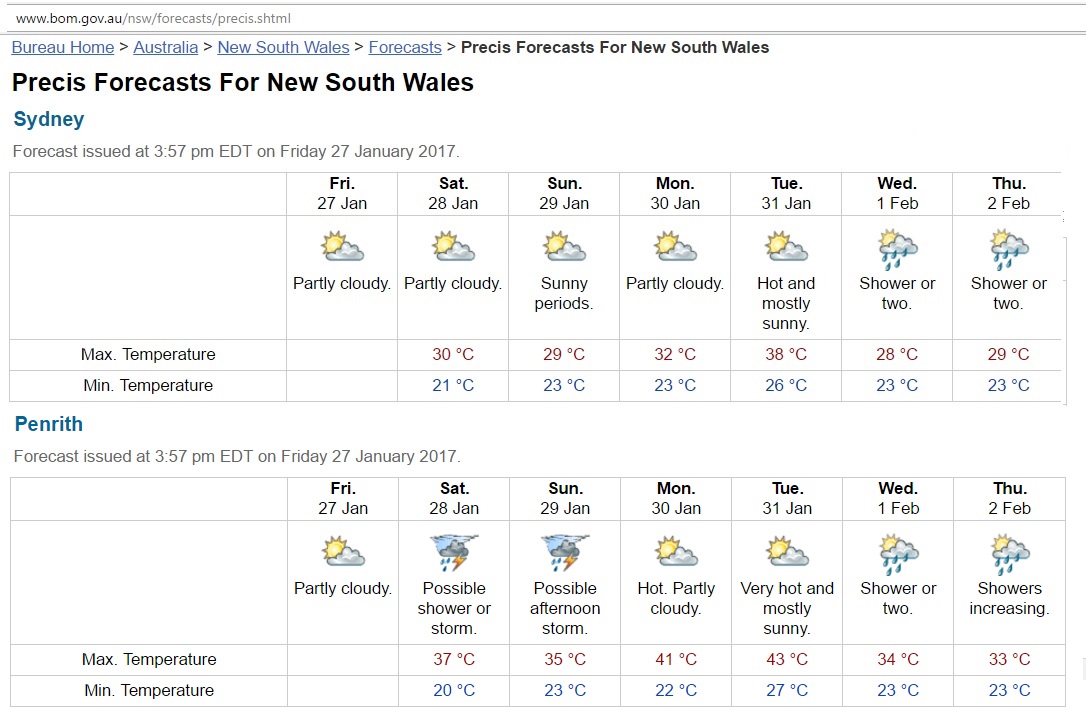
Fig 1: Weather forecast 28 Jan – 2 Feb 2017
http://www.bom.gov.au/nsw/forecasts/precis.shtml
What has this power supply post to do in an oil blog? First, it is assumed that electric cars will be one of the solutions for peak oil. We also need power to run extensive urban rail systems and long-distance interstate rail to replace domestic air travel. So where will the primary energy come from for these solutions? Secondly, peak oil is not alone. We are heading for an electricity crisis as well because timely decisions in the energy sector have not been made over the last 10-15 years and are unlikely to be made given the toxic political environment in Australian Parliaments in relation to carbon pricing and renewable energies. Thirdly, we have to know what a simultaneous oil and power crisis will mean for the economy.
Context
This is especially important as the 50 year old Hazelwood brown coal fired power plant in Victoria with a nameplate capacity of 1,600 MW is closing end March 2017 – after the summer. This suggests there would be problems already in this summer had it shut down earlier.
This article gives an introduction to the Hazelwood problem:
http://www.abc.net.au/news/2016-11-03/hazelwood-what-will-happen-if-power-plant-closes/7939460
The Australian Energy Market Operator updated its Electricity Statement of Opportunities in November 2016 and advised that, among other measures to increase supply, a
Permanent demand reduction in response to anticipated increases in market prices
will be required to avoid the breach of reliability standards after the Hazelwood closure.. The AEMO report is here:
https://www.aemo.com.au/-/media/Files/Electricity/NEM/Planning_and_Forecasting/NEM_ESOO/2016/update/2016-ESOO-Update—Hazelwood-Retirement.pdfv
This emerging problem is the background for this post. We need to know more about the NSW power supply which depends on imports from Victoria.
Weather dependency
Demand for electricity is very much dependent on temperatures. The following weather forecast was done on 24/11/2016
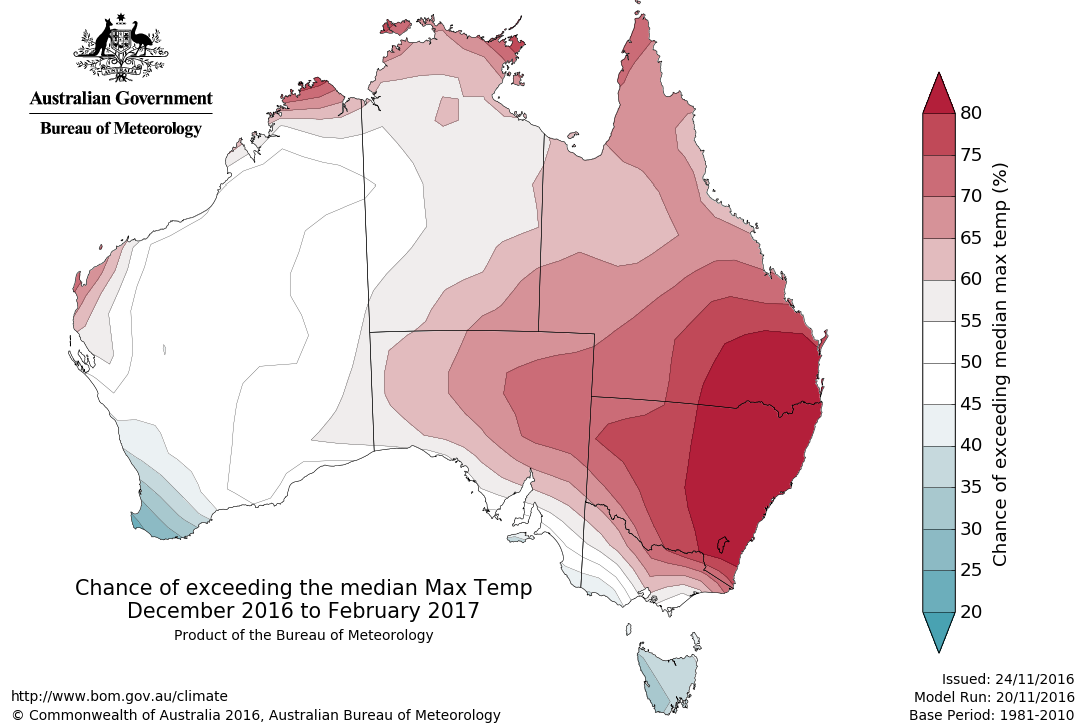
Fig 2: Australian Bureau of Meteorology 3 month summer forecast
http://www.bom.gov.au/climate/ahead/archive/temperature/maps/tmax.forecast.median.national.season1.20161124.hr.png
AEMO’s 7 day outlooks
The Australian Energy Market Operator (AEMO) did the following forecast on 27/1/2017
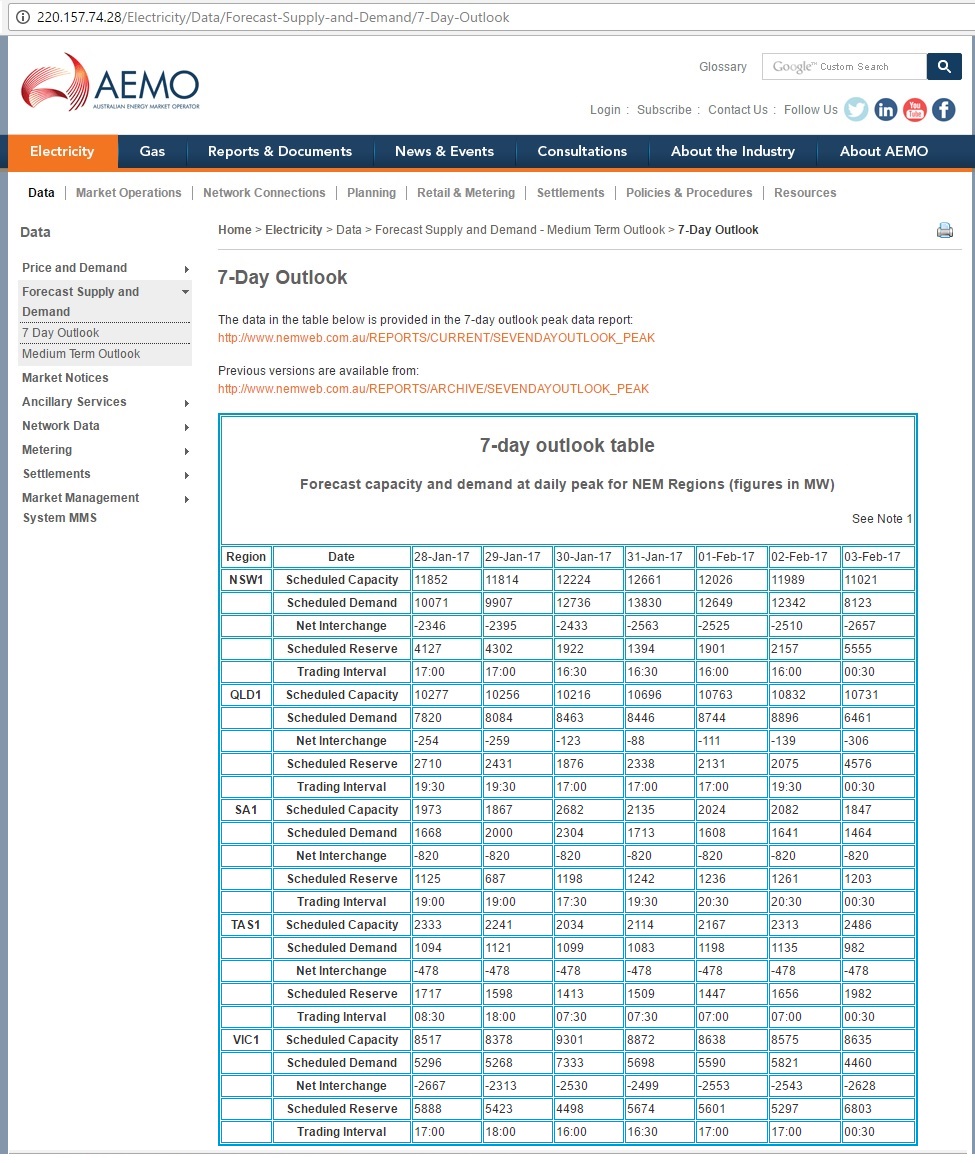
Fig 3: 7 day outlook table from AEMO published on 27/1/2017
http://220.157.74.28/Electricity/Data/Forecast-Supply-and-Demand/7-Day-Outlook
Definition: A scheduled generator has an aggregate nameplate capacity of 30 MW or more and usually operates an appropriate equipment to participate in the central dispatch process managed by AEMO.
More details can be found here: “Participant categories in the National Electricity Market”
https://www.aemo.com.au/media/Files/Other/Registration%202014/Registration%20Final/PARTICIPANT_CATEGORIES_IN_THE_NEM_final.pdf
Let’s put the NSW data into a graph
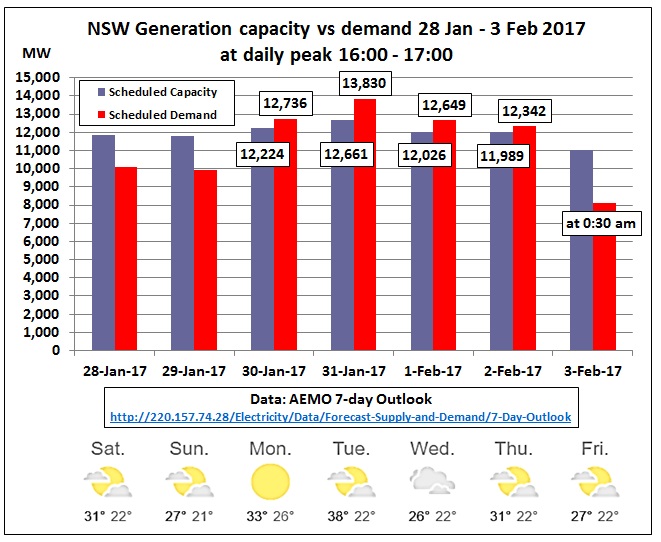
Fig 4: NSW generation capacity vs demand as estimated on 27/1/2017
We see that demand exceeds capacity on 4 days in the afternoon by between 3-9%. This difference has to be imported from neighbouring States Queensland and/or Victoria.
How does the NSW demand in above table compare to the maximum in the National Electricity Forecasting Report (NEFR)?
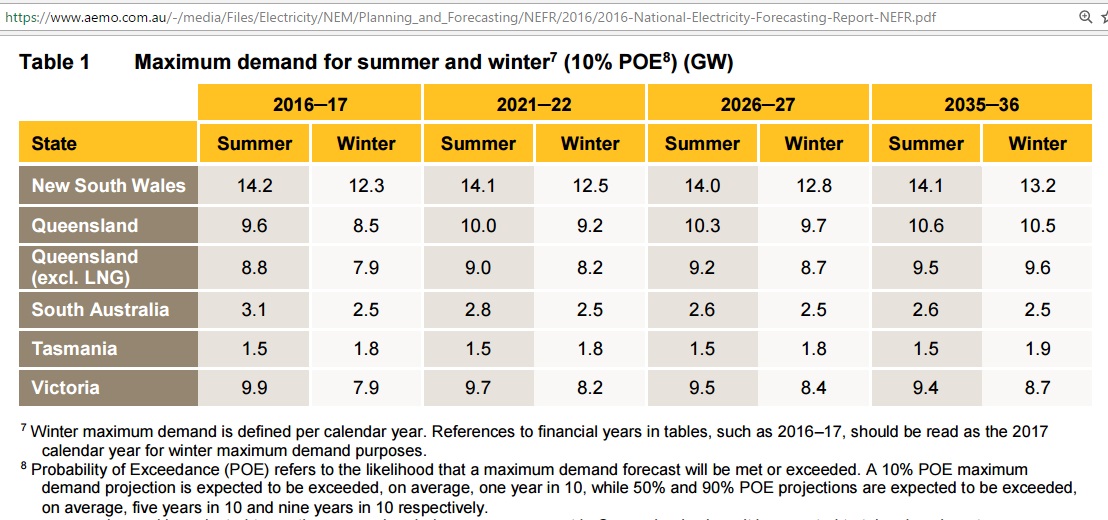
Fig 5: Maximum demand from the NEFR
Note: For maximum demand, the top 10 highest demand half-hours each year were used to calculate the average generation at time of maximum demand
https://www.aemo.com.au/-/media/Files/Electricity/NEM/Planning_and_Forecasting/NEFR/2016/2016-National-Electricity-Forecasting-Report-NEFR.pdf
Well, it’s just 14,200 – 13,830 = 370 MW. Very close.
The maximum import requirement during 4 days would be 13,830 – 12,661 = 1,164 MW. The numbers will certainly change as we are approaching the critical days but it seems they are in the order of 1 GW on 31/1/2017 16:30.
Previous heatwaves this January
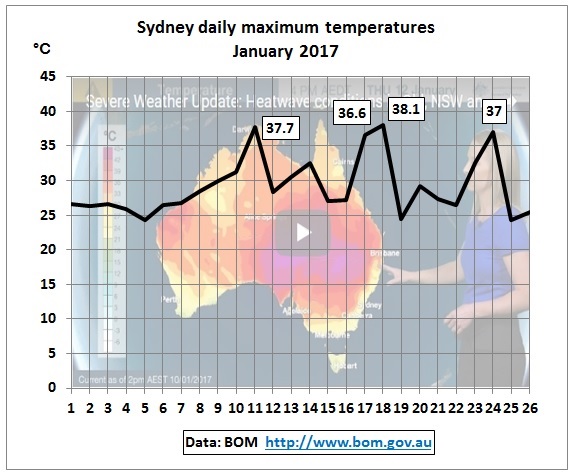
Fig 6: Sydney’s daily maximum temperatures 1-26 Jan 2017
11th January 2017 (Wednesday, summer holidays)
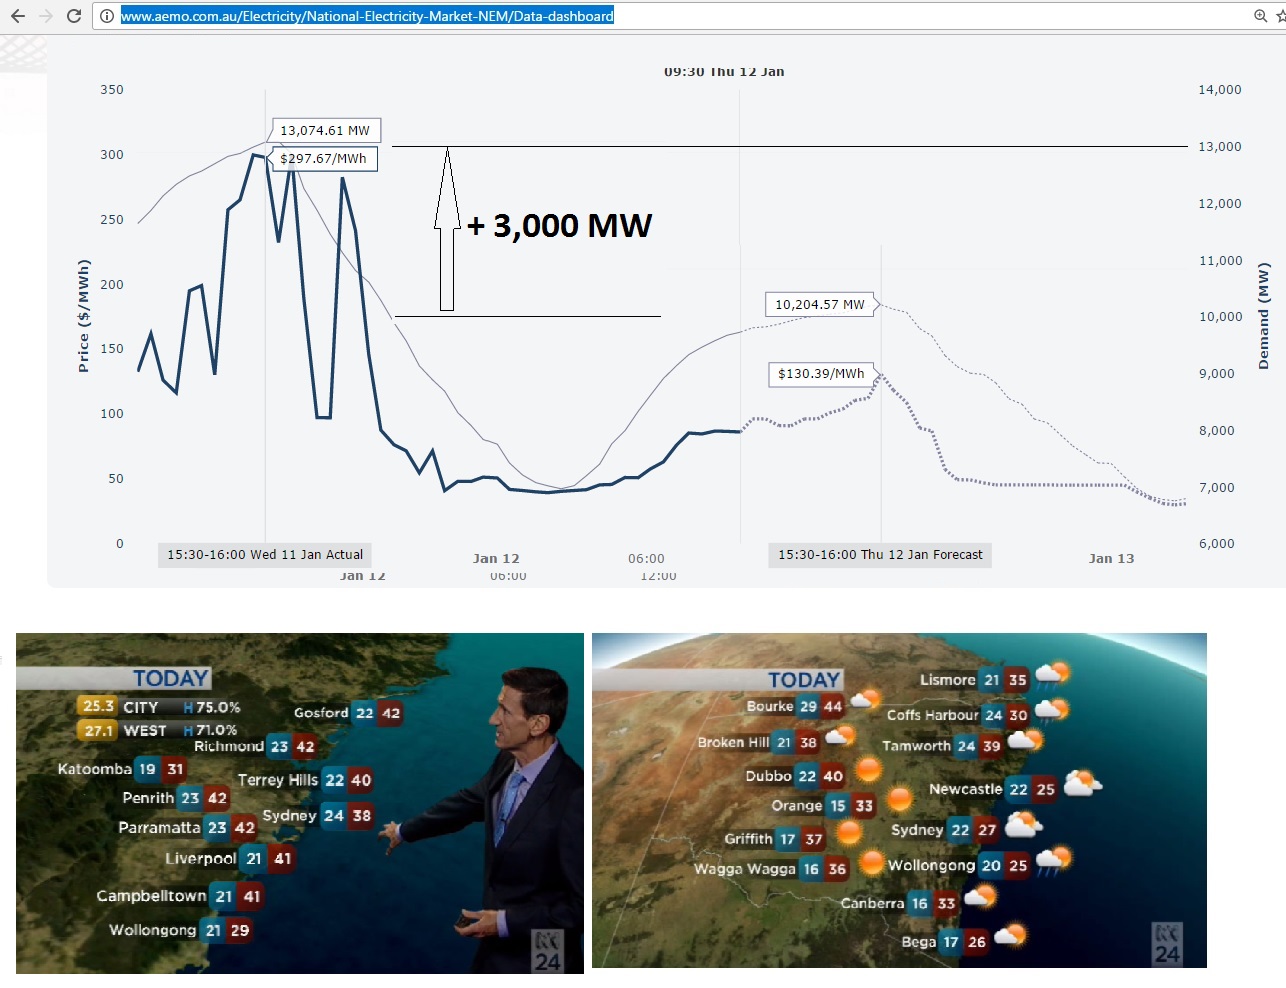
Fig 7: Impact of hot day on electricity demand and prices
In the above graph the upper panel shows AEMO’s dashboard for Wednesday 11th and Thursday 12th January 2017 with a maximum demand of 13,074 MW. The difference in demand between these 2 midweek holidays was 3,000 MW. The maximum spot price of around $300/MWh on the hot day was around twice as much as that on the cooler day.
The AEMO dashboard is here: http://www.aemo.com.au/Electricity/National-Electricity-Market-NEM/Data-dashboard#price-demand
17th and 18th January 2017 (Tuesday and Wednesday, summer holidays)
2 hot days with 37 and 38 °C
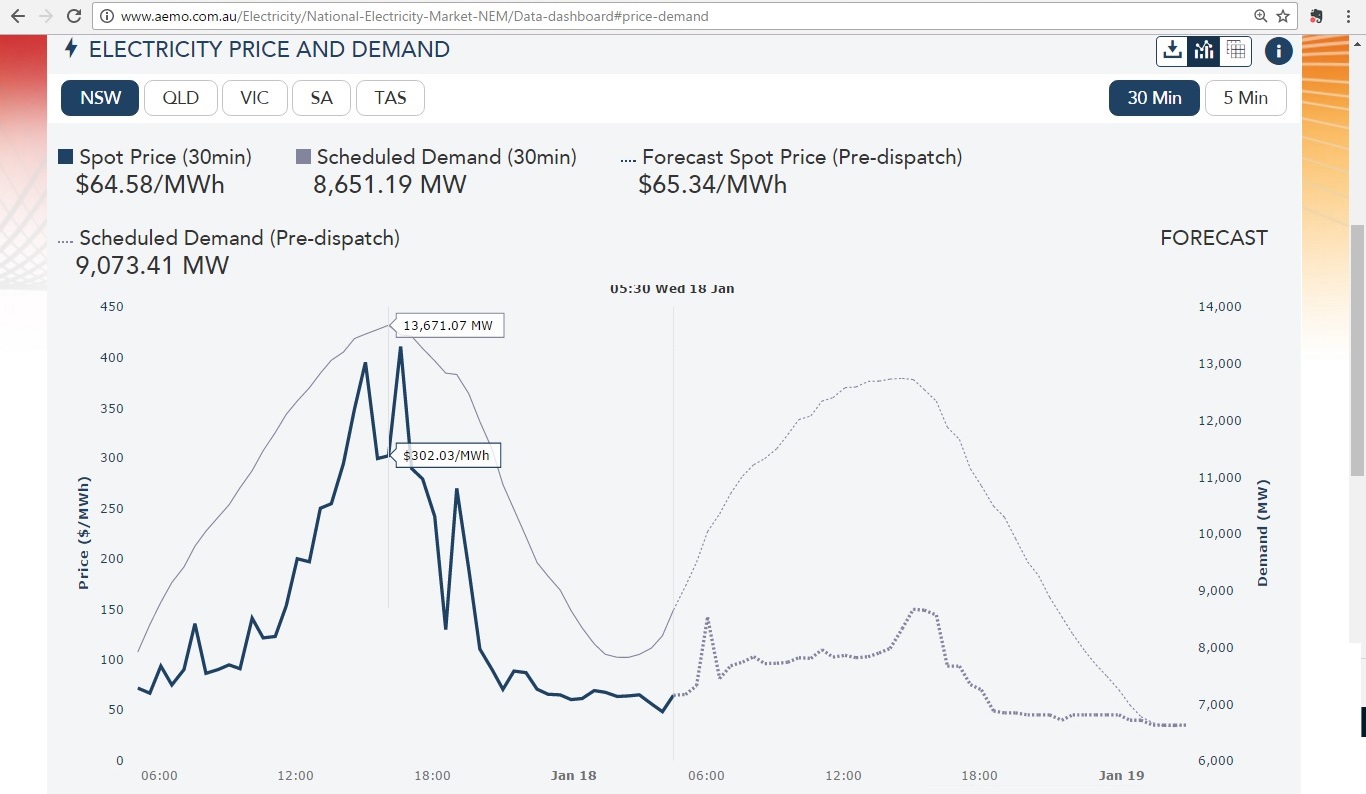
Fig 8: AEMO dashboard snapshot taken on 18th 5:30 am (NEM time)
Maximum demand for the 17th was 13,671 MW and prices went up to around $400/MWh. The following day demand was 12,803 MW at 13:00 hrs and prices spiked at $300/MWh at 15:00, higher than estimated in the above graph.
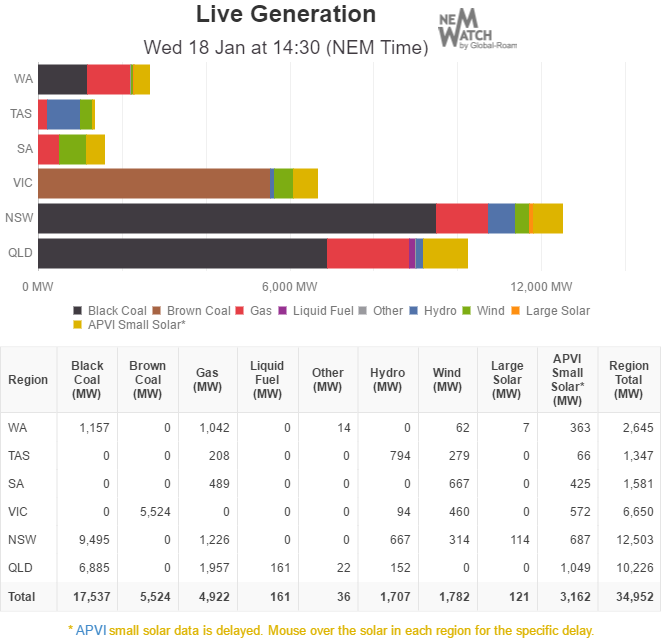
Fig 9: Australia’s live generation by fuel type on 18th Jan 2017 14:30
The above graph and table can be downloaded from this website every 5 minutes http://reneweconomy.com.au/nem-watch/
but is actually from NEM-Watch by Global Roam
http://home.global-roam.com/examples/tag/nem-watch/
Total generation of 12,503 MW was lower than demand of 12,803 MW at 14:30 NEM time
NSW coal fired power plants delivered 9,495 MW. That is 93% of name plate capacity of 10,240 MW – taken from this AEMO table:
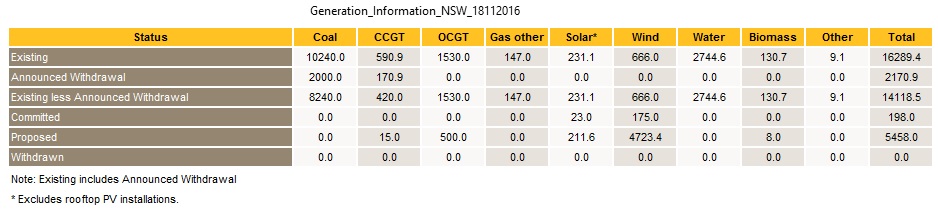
Fig 10: NSW’s power plants November 2016
24th January 2017 (Tuesday, summer holidays)
The next hot day in this season was on 24/1/2017 with a temperature of 34.5 °C at 16:00. On the morning of that day AEMO did the following estimate:
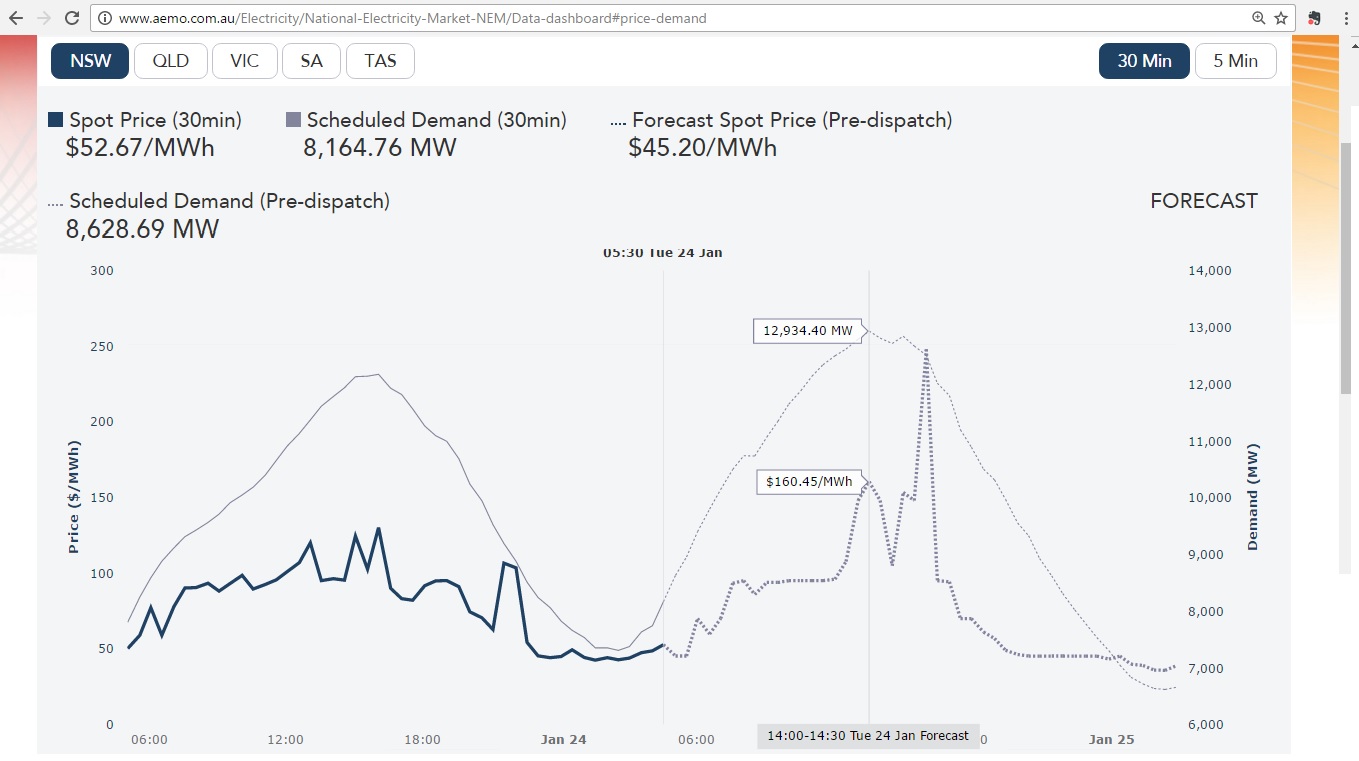
Fig 11: Screen shot of AEMO’s Dashboard on 24/1/2017 5:30 am
According to AEMO’s aggregated data files, actual maximum demand went up to 12,967 MW so the morning estimate was pretty good.
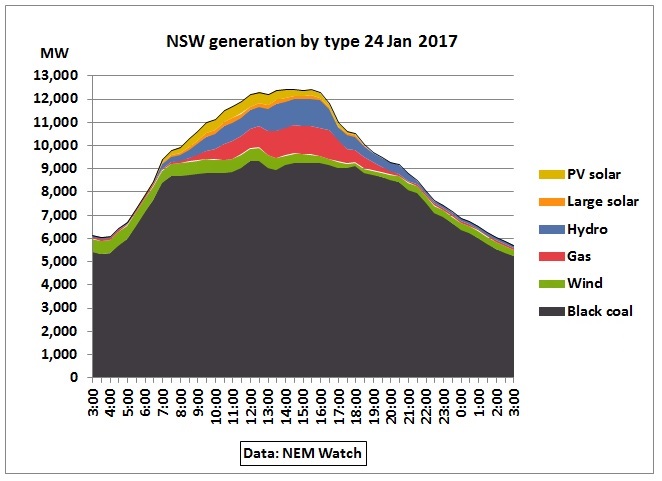
Fig 12: Power generation in NSW on 24/1/2017
Maximum generation on that day was 12,406 MW at 15:30. At the scheduled demand peak of 12,934 MW at 14:30 generation was only 12,396 MW. Therefore demand was higher by 538 MW and imports were required.
NEM Watch dashboard
The NEM Watch dashboard was showing varying interconnector flows into NSW
From 9:30 to 15:00
Queensland to NSW 275 – 332 MW
Direct Link (Terranora) 26 – 34 MW
Victoria to NSW 610 – 808 MW
Total NSW imports 938 – 1,086 MW
So this was in the order of 1 GW.
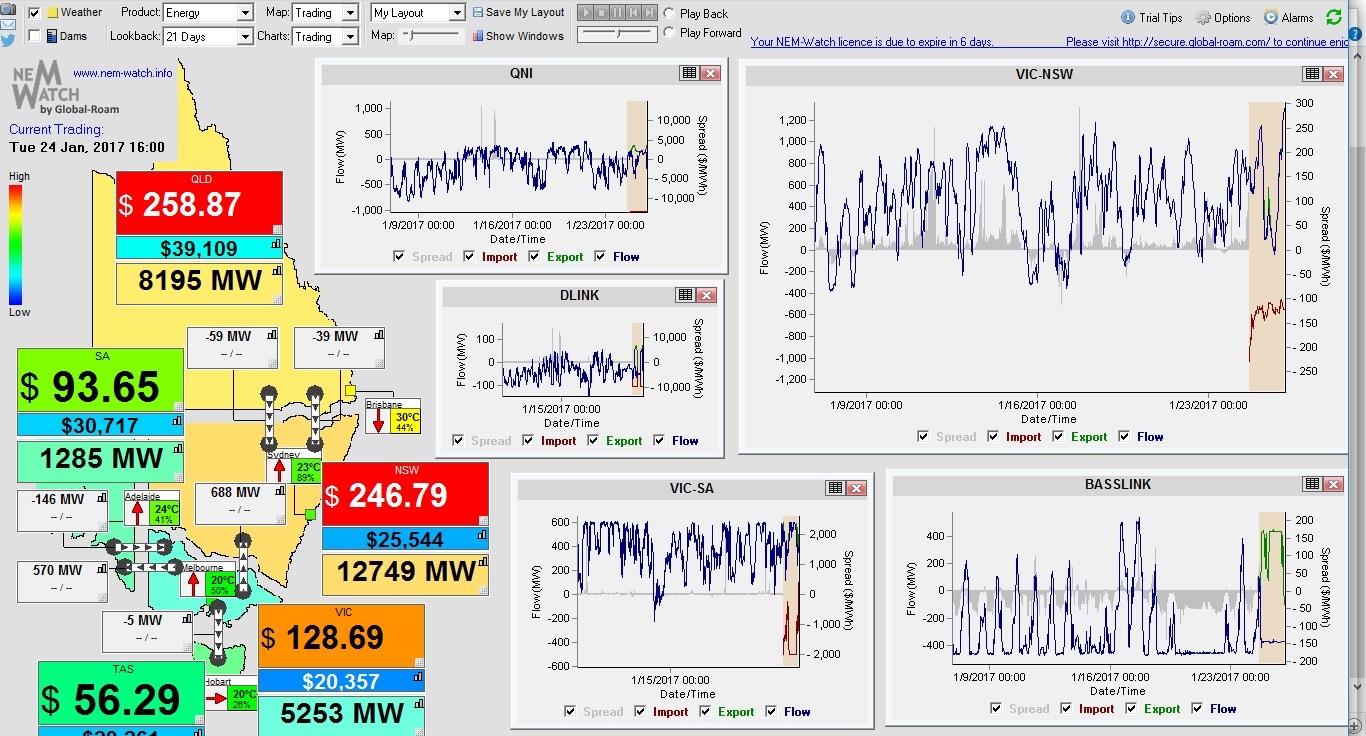
Fig 13: NEM Watch dashboard showing power demand, prices and interconnector flows on 24/1/2017 at 16:00
At 16:00 temperatures in Sydney had dropped by 13 °C and NSW imports had gone down to 786 MW but spot prices were still high (indicated by red colors) because demand in Queensland was still going up. So we have many factors at play here.
The data are from Global Roam:
http://home.global-roam.com/examples/tag/nem-watch/
And very useful articles commenting on this dashboard can be found here:
http://www.wattclarity.com.au/
Summary
- Utilization of NSW black coal during hot days hit 93% in January 2017 sofar. Therefore, contrary to what is reported in the media (including the ABC article above), there is little scope for exports to Victoria during critical demand peaks when there are simultaneous heatwaves in NSW and Victoria
- NSW demand on hot days is regularly higher than scheduled generation capacity and requires imports from Queensland and Victoria in the order of 1 GW. This dependency will only get worse with further global warming in the pipeline from CO2 already in the atmosphere
Outlook
The outlook on a 132 KV transmission line is beautiful from these electric flats in a Sydney suburb.
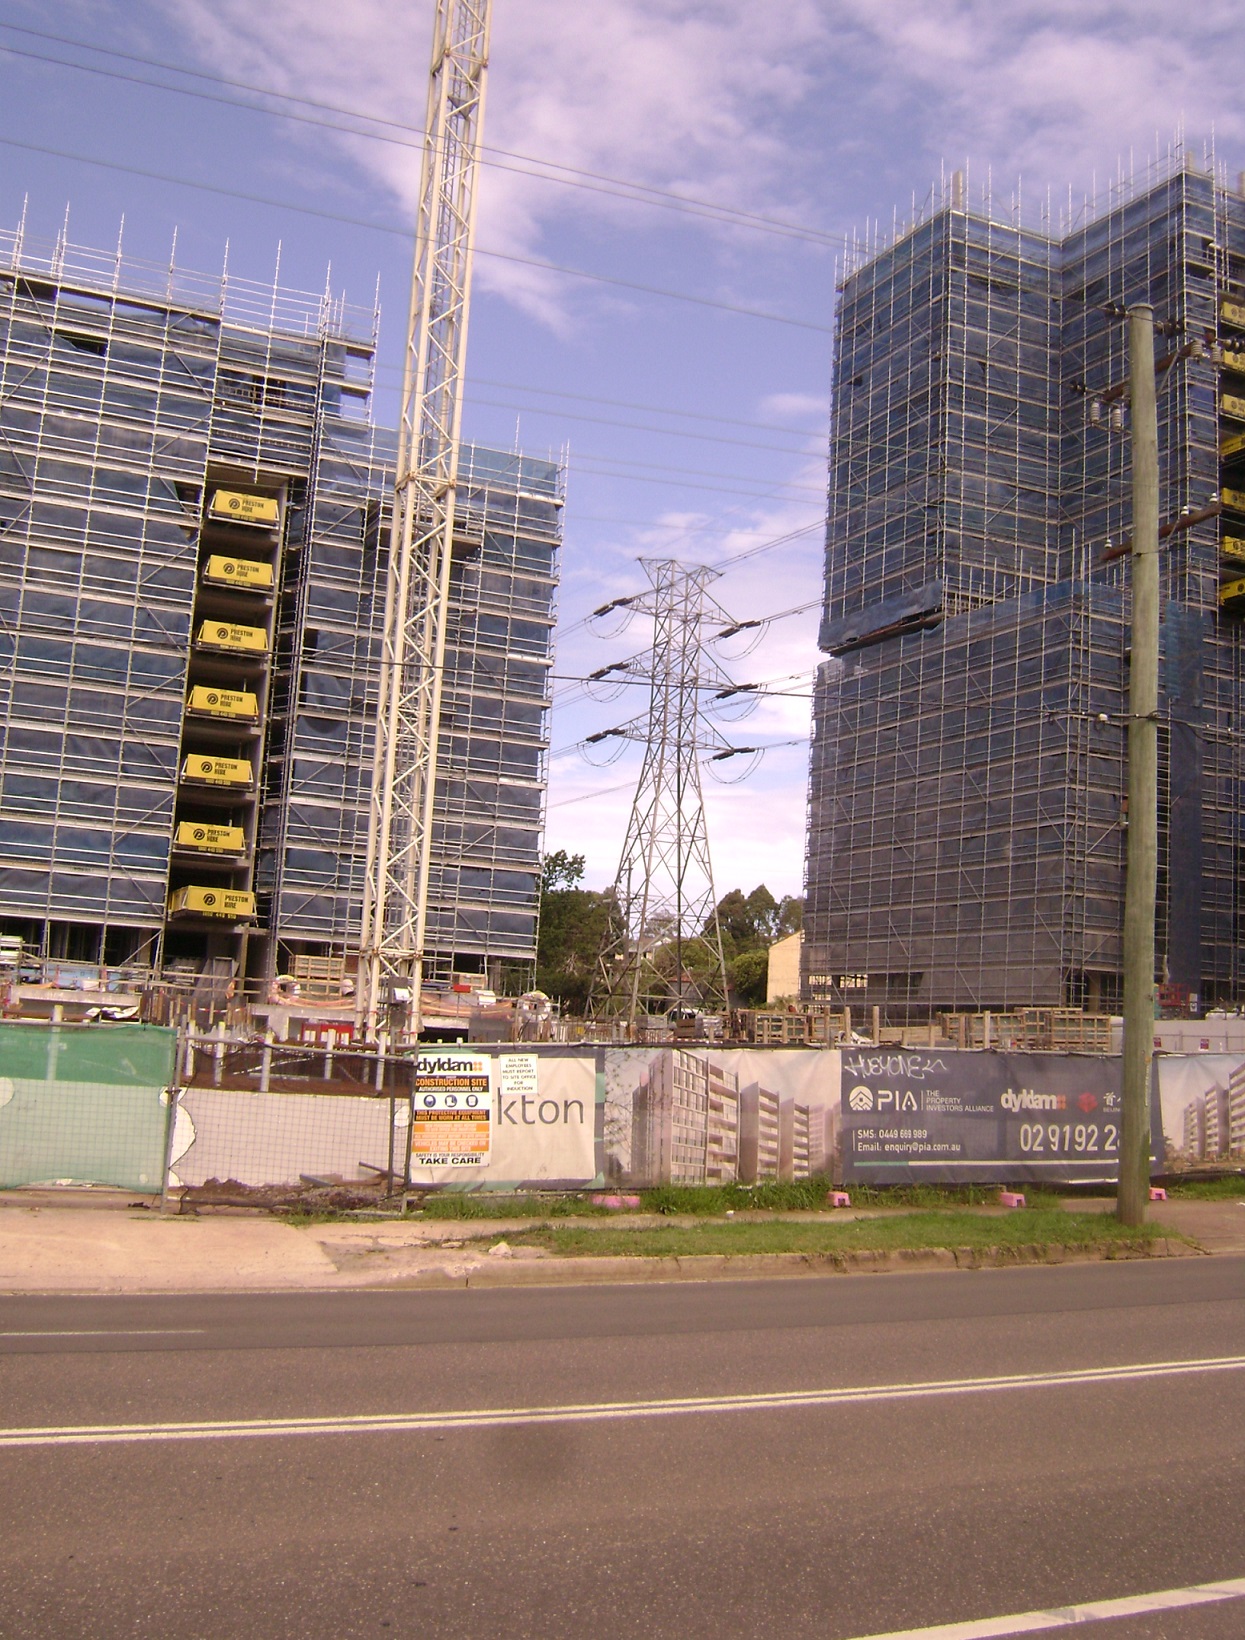
Fig 14: Flats under construction near Carlingford station in Sydney
The picture shows how desperate congested Sydney has become to welcome immigrants. Unsuspecting future residents who are not concerned about the proximity to high voltage lines will nevertheless be surprised later when their lifts one day will run on diesel generators, provided of course there are no diesel shortages.
Note that these poor people staying in these apartments will never have the opportunity to install solar panels which would reduce their load on the grid.
Conclusion
It is recommended that all planners, investors and Members of Parliament who dream of millions of electric cars and think they can grow Australian capitals by x million population install NEM-Watch software in their office so that they get a feeling for power supply numbers and in particular watch generation by fuel. Hopefully it will then dawn on them that further growth will only make our job to replace coal so much harder.
Updates
29/1/2017
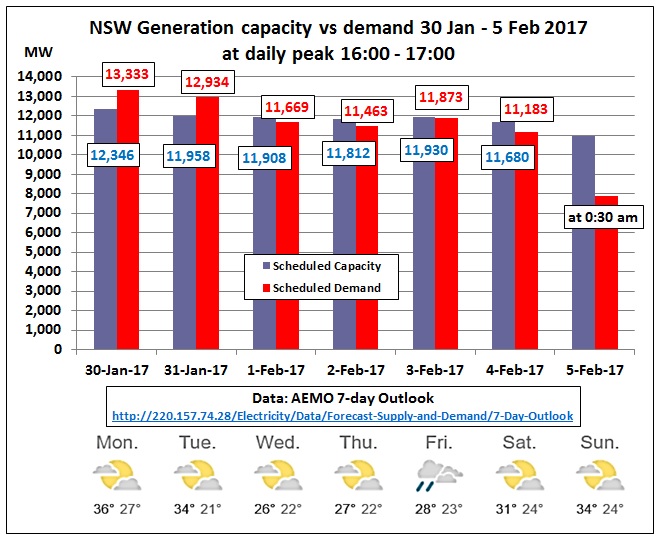
Fig 15: NSW generation capacity vs scheduled demand
Victoria also has a hot day tomorrow
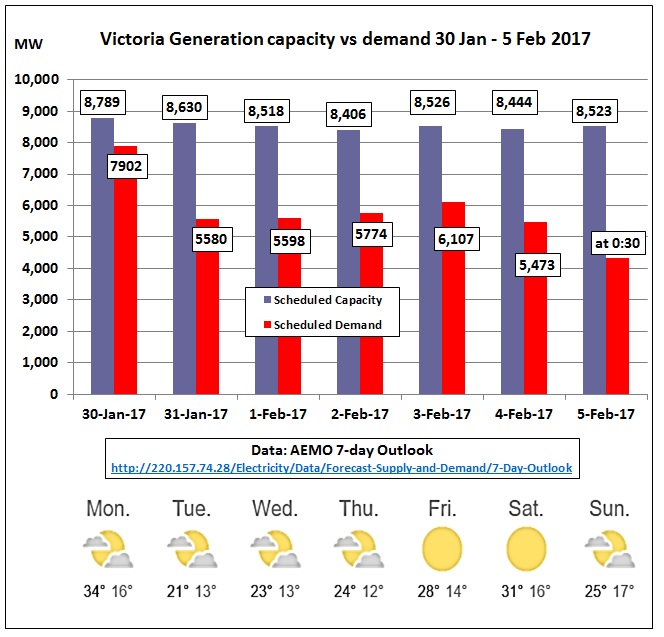
Fig 16: Victoria generation capacity vs scheduled demand
Victoria’s surplus is around 900 MW – coming from Hazelwood?
30/1/2017
Forecast Low Reserve Notice issued 13:12 hrs

Fig 17: Low Reserve Level 1 forecast for NSW
https://www.aemo.com.au/Market-Notices
The notice was later canceled at 16:15 in notice 57081. Please note there is reserve sharing between States.
31/1/2017
Looking at AEMO’s record of the previous day
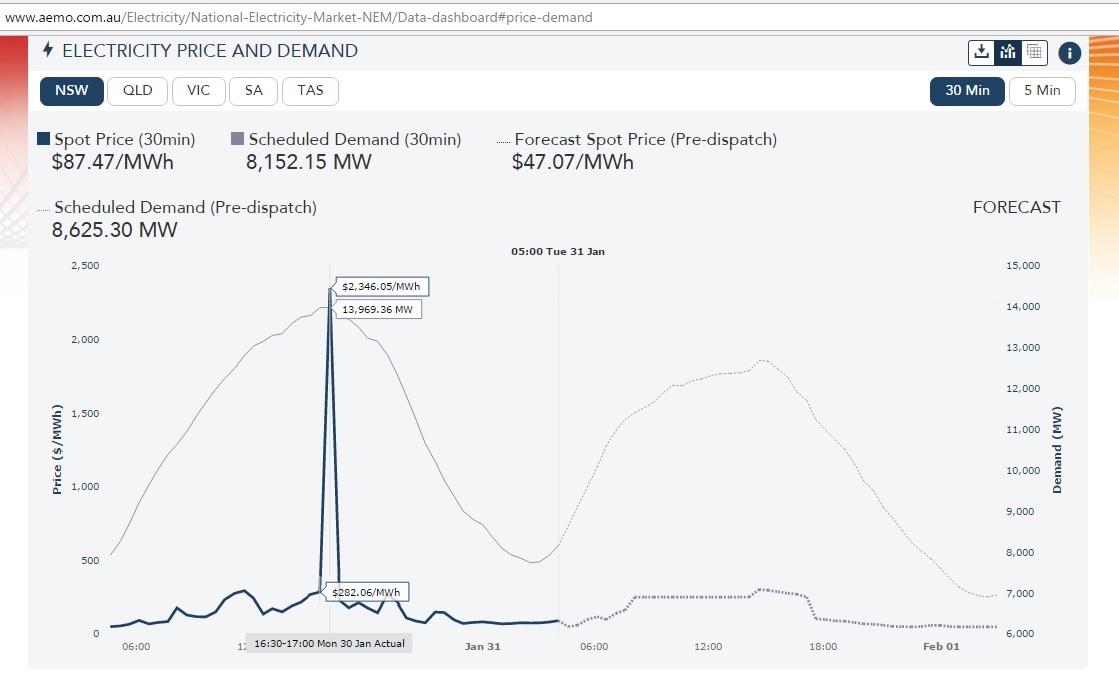
Fig 18: Demand peaked at 13,970 MW on 30/1/2017 16:30 and a spot price of $282/MWh. Half hour later prices spiked at $2,346/MWh at practically the same level of demand.
Available capacity in NSW at that time was 14,629 MW so the reserve capacity for NSW alone was only 659 MW. Plus total imports of 795 MW. That’s 1,454 MW reserve sharing with Queensland and Victoria, just slightly above the contingency reserve mentioned in the above note 57079.
This price spike event has been described in more detail by WattClarity in the following article:
Initial Review: NEM-wide Price Event, Monday 30 Jan 2017
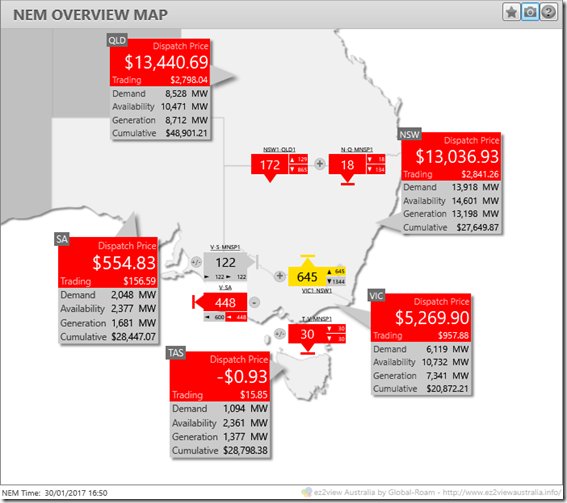
Fig 19: NEM Overview Map for 30 Jan 2017 16:50
- Brutally hot weather in NSW – approaching 44 degrees in western Sydney – driving demand to very high levels. Queensland demand was also strong.
- Transmission constraints limiting the ability of Victorian generation to flow northwards into NSW to help meet those high demands. In particular the NEM’s own unique version of the rail gauge problem reared its head.
- Bidding behaviour also contributed
The rail gauge problem refers to Victoria’s large scale generation connected to 500 KV while NSW uses 330 KV, built during the Snowy Hydro Scheme construction. This requires a transformer at South Morang near Melbourne, constraining flows to 650-700 MW.
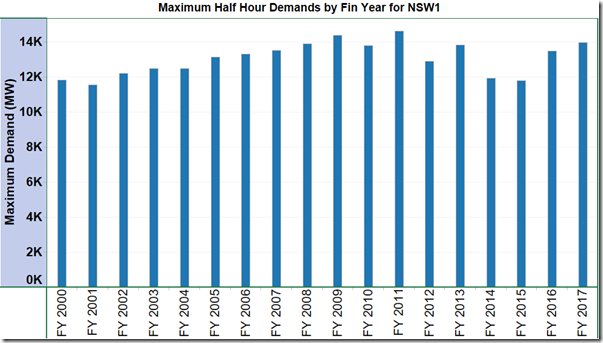
Fig 20: NSW maximim half-hr demand
http://www.wattclarity.com.au/2017/01/initial-review-nem-wide-price-event-monday-30-jan-2017/
The demand graph shows the impact of the financial crisis, the peak of the mining boom, the closure of the Kurri Kurri aluminium smelter and oil refineries at Clyde and Kurnell as well as weaker demand from manufacturing. Since 2015 demand has rebounded strongly.
Next post on same topic
10 Feb 2017
NSW running low on contingency reserves during hot days
http://crudeoilpeak.info/nsw-running-low-on-contingency-reserves-during-hot-days