This is an update to a post of December 2018
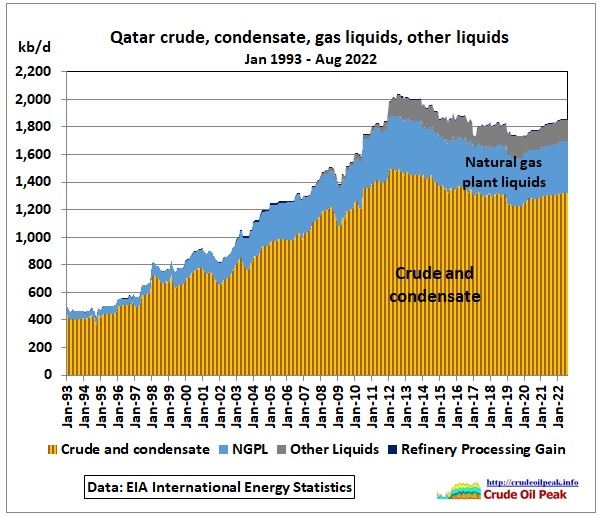 Fig 1: Qatar crude & condensate, NGPLs and other liquids
Data are from the Energy Information Administration (starting in 1993)
https://www.eia.gov/international/data/world/petroleum-and-other-liquids/annual-petroleum-and-other-liquids-production
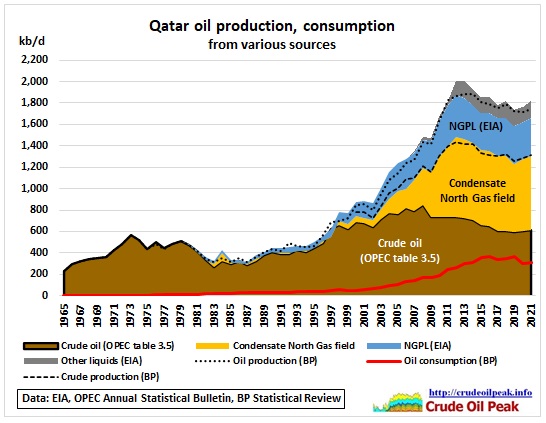 Fig 2: Qatar annual oil production, consumption from various sources
The 2 crude peaks represent 2 production cycles as can also be seen when doing a Hubbert Linearization. In the fopllowing graph, we plot
y-Axis: annual production as percentage of cumulative production
x-Axis: cumulative production
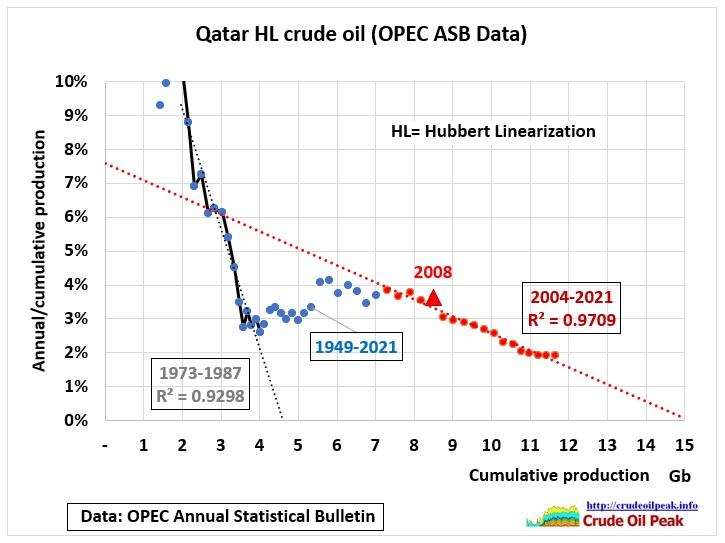 Fig 3: Hubbert Linearization for Qatar’s crude oil
The dotted line trend up to 1987 pointed to 4.5 Gb total production which was in fact the remaining oil reserve (including condensate and NGLs) shown in the BP Statistical Review until 1996. The trend 2004-2021 points to 15 Gb but that may be too low as points of the last 4 years have been above the trend line.
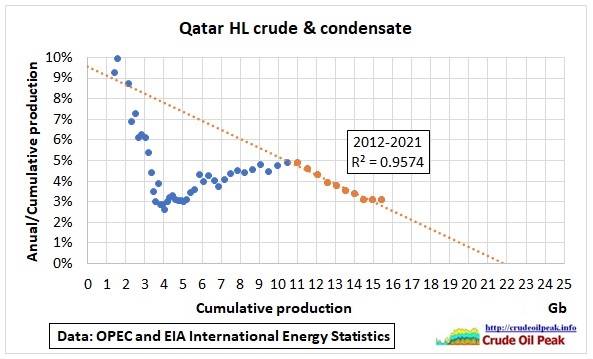 Fig 4: Hubbert Linearization for Qatar’s crude oil & condensate
The trend of the data series 2012-21 points to 21 Gb but again there was an uptick in the last 2 years.
Rystad has remaining 2P reserves including condensate (which is substantial due to the gas fields) of 10 Gb.
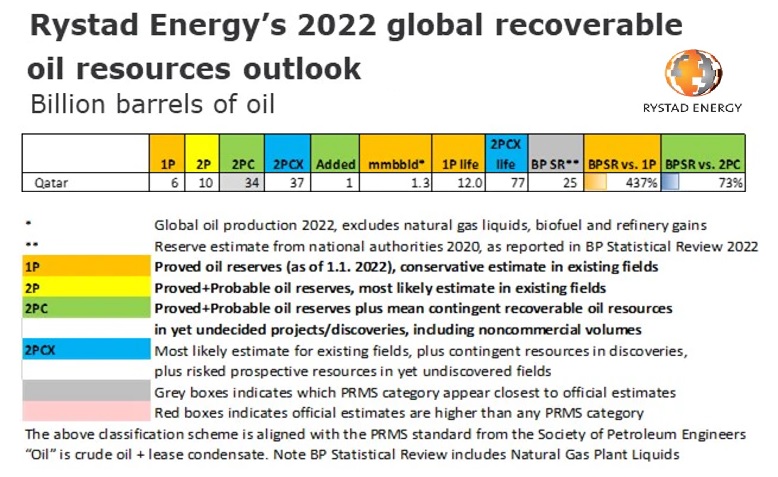 Fig 5: Extract from Rystad’s resource table
https://www.rystadenergy.com/news/total-recoverable-oil-worldwide-is-now-9-lower-than-last-year-threatening-global
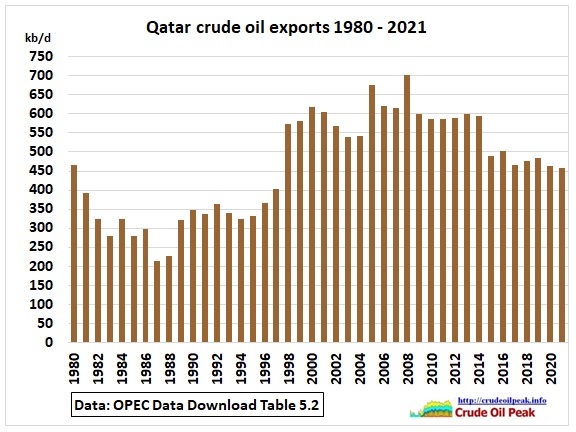 Fig 6: Qatar crude oil exports
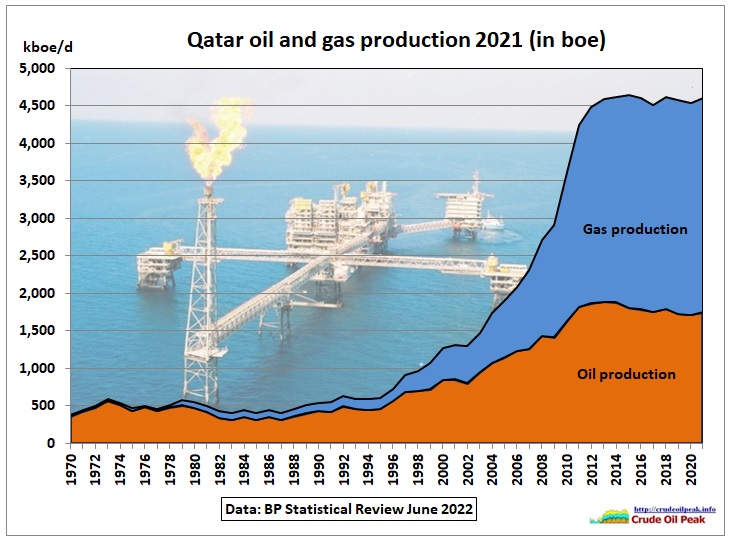 Fig 7: Oil and gas production together (gas converted to boe)
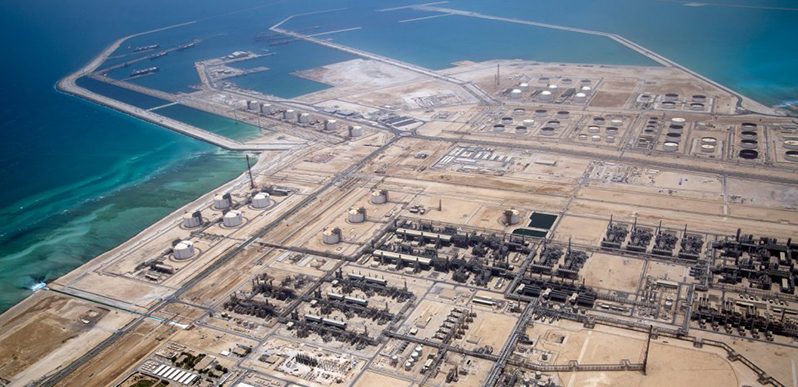 Fig 8: Qatargas LNG trains in Ras Laffan Industrial City
https://www.mechademy.com/lng_plant/qatargas-1-trains-1-3/
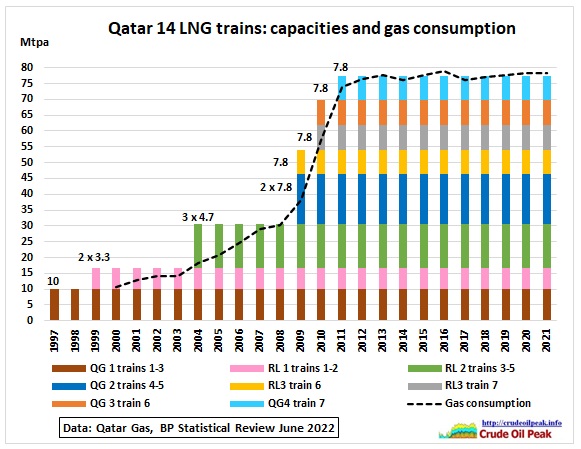 Fig 9: Qatar’s 14 LNG trains
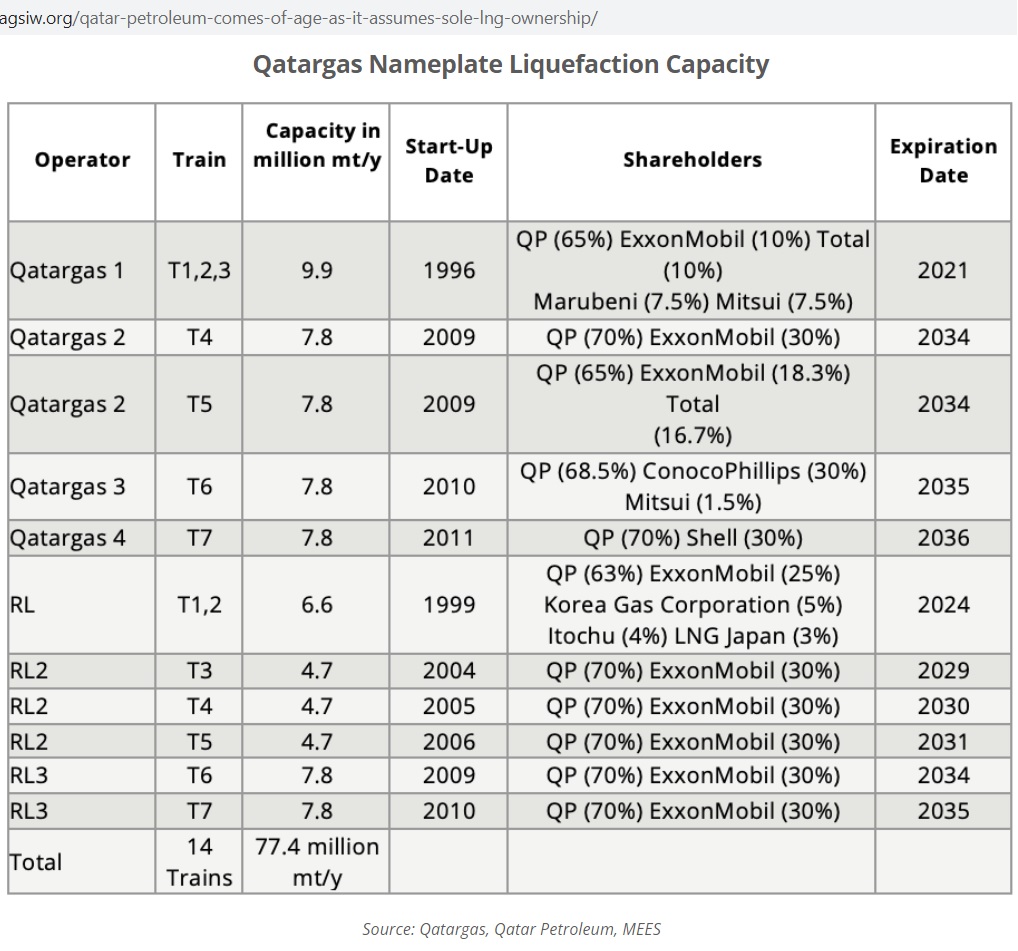 Fig 10: Ownership and expiration dates of 14 LNG trains
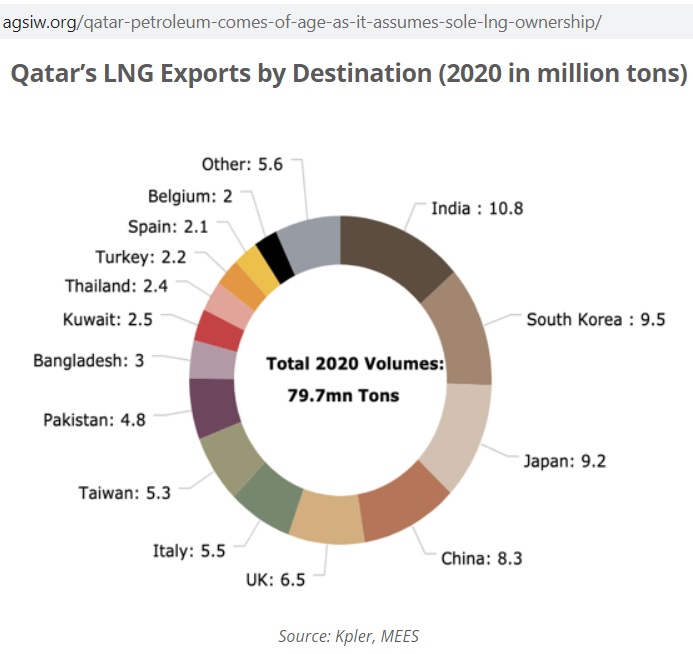 Fig 11: Qatar LNG exports by destination
https://agsiw.org/qatar-petroleum-comes-of-age-as-it-assumes-sole-lng-ownership/
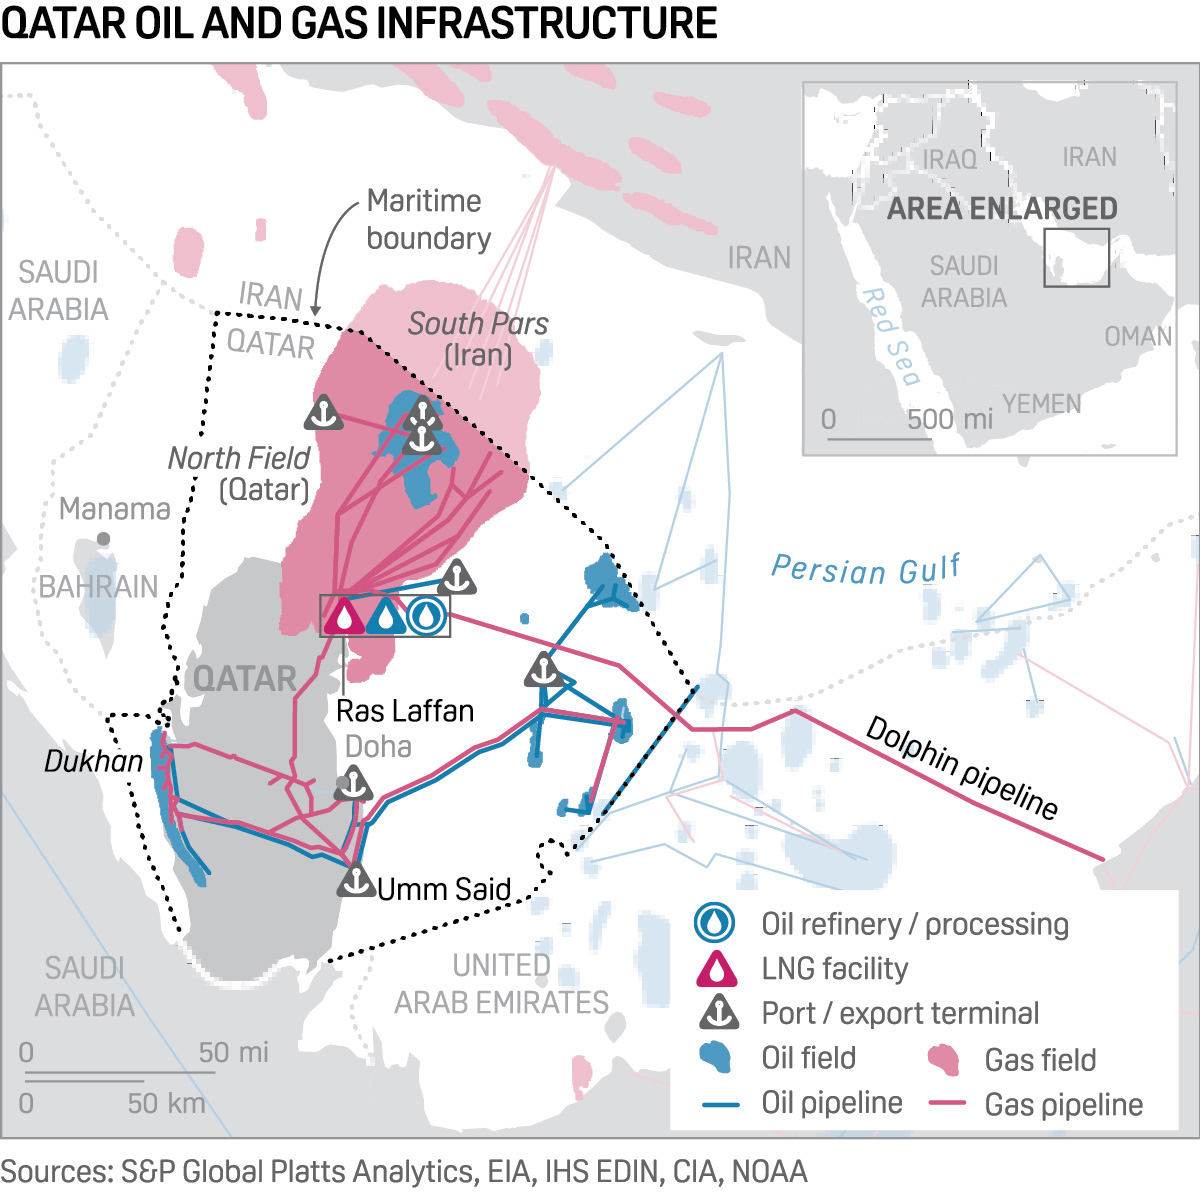 Fig 12: Location of North Field and South Pars
https://www.spglobal.com/commodityinsights/plattscontent/_assets/_images/latest-news/20200421-qatar-oil-gas-infrastructure-lr.jpg
Note the possible conflicts with Iran’s South Pars field
9 Feb 2021
Qatar Petroleum makes FID on $28.7bn North Field East project
Qatar Petroleum has made a final investment decision (FID) for the $28.75bn North Field East project with a capacity of 33 million tonnes per annum (Mmtpa).
Said to be the largest of its kind globally, the North Field East project is expected to increase Qatar’s LNG production capacity to 110 mmtpa from 77 mmtpa.
In addition to the LNG, the project will have the capacity to produce condensate, LPG, ethane, sulphur, and helium.
Under the contract, the joint venture will build the four mega LNG trains with related utility facilities.
The contract also includes the construction of large CO₂ carbon capture and sequestration facility, which is expected to reduce more than 25% of greenhouse gas emissions when compared to similar LNG facilities.
So gas has not peaked. But note how the new capacity is replacing expiring LNG trains (see Fig 10) built 25 years ago.
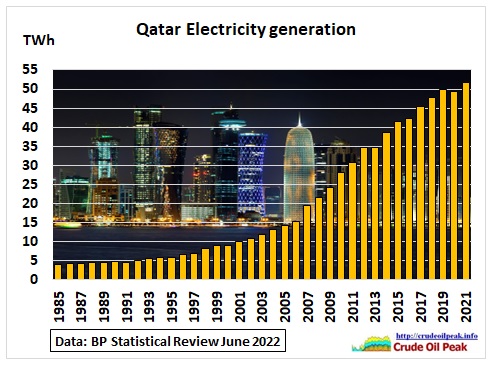 Fig 13: Qatar electricity generation