This post is a continuation of part 1
https://crudeoilpeak.info/us-crude-oil-imports-by-gravity-and-country-of-origin-part-1
All data are from this website:
http://www.eia.gov/dnav/pet/pet_move_impcus_a2_nus_epc0_im0_mbblpd_m.htm
 Fig 10: US imports from Africa
US crude imports from Africa declined dramatically between 2009 and 2013 by 2 mb/d.

Fig 11: US imports from Africa in the last 5 years
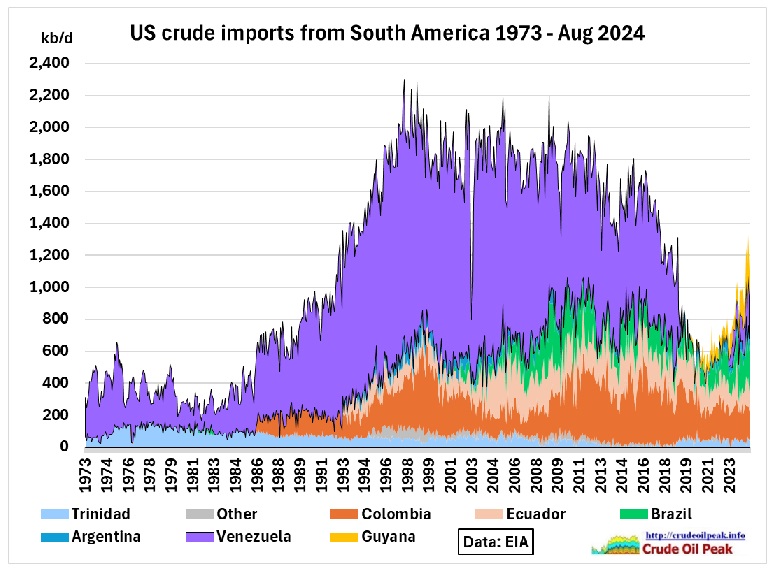 Fig 12: US crude imports from South America
US crude imports from Venezuela fell off a cliff in 2016 when Venezuelan oil production started a dramatic decline. Venezuela’s heavy oil was replaced by Canadian oil.
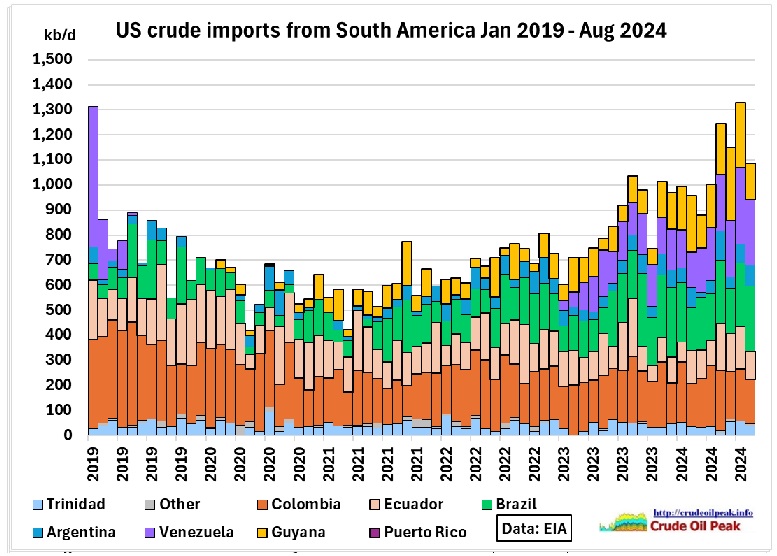 Fig 13: US crude imports from South America in last 5 years
Imports from Colombia and Ecuador are stable. Imports from Brazil and Guyana are increasing, also again from Venezuela.
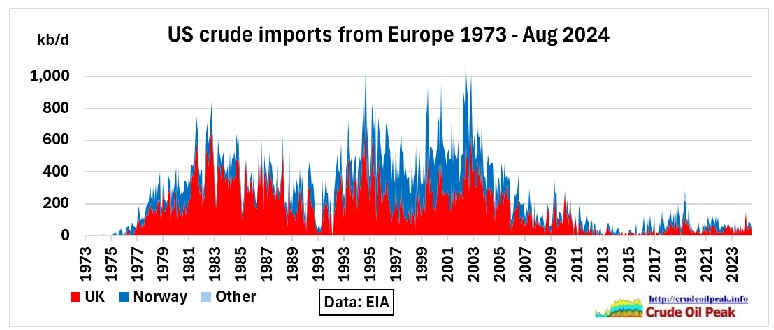 Fig 14: US crude imports from UK and Norway
These imports practically disappeared after peak oil in the North Sea
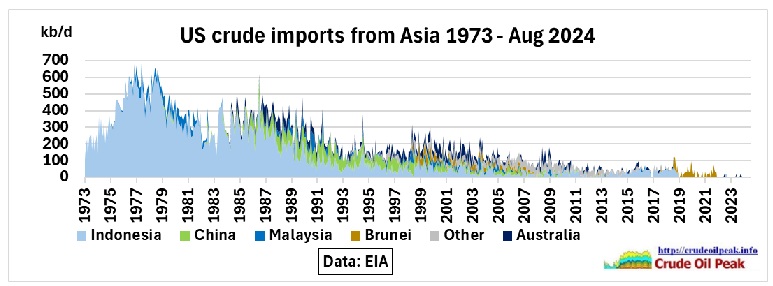 Fig 15: US crude imports from Asia petered out
Indonesian oil production peaked in 1991 and declined since then while demand increased until 2012. Since 2003, Indonesia is a net importer of oil.
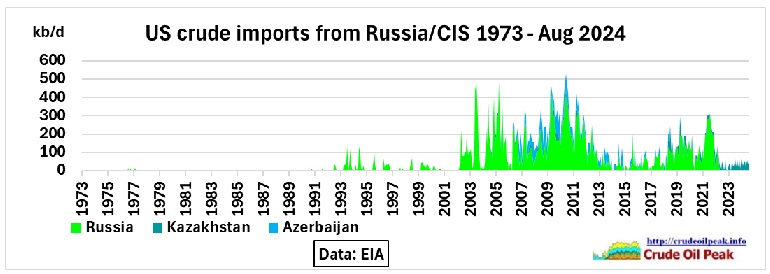 Fig 16: US crude imports from Russia and Kazakhstan
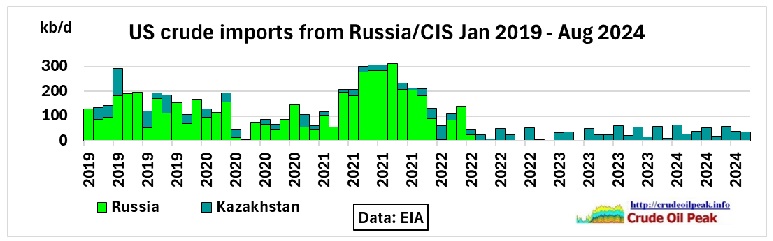 Fig 17: Imports from Russia stopped in 2022 (Ukraine invasion)
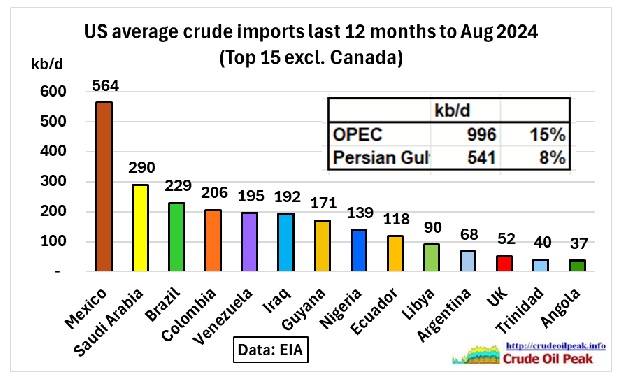 Fig 18: 37% of US crude imports come from many different countries
Assuming a worst case scenario for the Middle East the direct impact on US crude imports would be the loss of 500-600 kb/d, less than 10% of the total but it would be a quarter of all seaborne crude imports.
Drill, baby drill under Trump? More light oil!
Standard Chartered: American Oil Output Won’t Surge Under Trump
10 Nov 2024
“These companies have largely left behind their trigger-happy, drill-baby-drill days and adopted strict capital discipline, eschewing rapid production increases in favor of returning more capital to shareholders in the form of dividends and share buybacks. “
“the Permian is maturing, and its deteriorating geology will weigh on the production of crude oil down the road.”
“ ….peak production is only maintained for a relatively brief period, usually a couple of months, following which hyperbolic decline sets in. The rate of decline is determined by several factors, including reservoir characteristics, completion techniques and production drawdown, but can be between 40-80%. Such high decline rates and short production profiles mean that new production must be continually brought onstream, the so-called ‘Red Queen effect’. Effectively managed, StanChart has predicted that U.S. supply will stabilize at current prices.
“Trump has pledged to impose massive tariffs of as much as 60% on imported products. Steel is used throughout the drilling and production phases, with treated steel required for drilling equipment, pumps, pipes and tubes. US oil producers have cited various cost pressures as significant headwinds to growth in many recent industry surveys. These costs are significant for new projects considering that the majority of steel piping used for oil and gas drilling and pipeline infrastructure is imported.”
“Finally, Trump is likely to open up Federal land for exploration and production. However, StanChart has noted that the timeframe required from licensing, to exploration and appraisal, and eventual production is multi-year, meaning any production from federal lands would likely come after his four-year term is over.”
Conclusion and Summary
US crude imports peaked 2003-2008 due to high oil prices which resulted in a recession and a financial crisis, dampening oil consumption and therefore oil imports. Economic stimulus led to a recovery. Quantitative easing (QE1-QE3) provided liquidity for the evolving shale oil sector which grew faster than consumption, further reducing the need to import oil, especially light oil which the US was now able to produce domestically. At the same time, oil production in many countries the US imported from were peaking over many years so these countries had a reducing capacity to export. The imbalance in gravities between domestic crude production and the requirements of US refineries required increasing imports from Canada.
Next post will be on US crude exports.