Skip to content

Crude Oil Peak

Menu
  • Home
    • About
    • Disclaimer
  • OECD imports
    • France
    • Germany
    • Italy
    • Japan oil imports
    • OECD Europe
    • OECD Pacific
    • South Korea
    • UK
    • US Imports
  • Australian graphs
    • Australian electricity supply graphs
    • Australian crude oil production
    • Australian crude oil reserves
    • Oil import dependency
    • Oil and fuel imports
    • ULP prices
    • Industry stocks
    • End use of oil
    • WA crude oil
    • WA domestic gas
    • East coast conventional gas
    • Geoscience Australia March 2010
    • Geoscience Australia 2005/2006
    • Gippsland
    • LPG
    • Petrol rationing in WW2
  • Oil reserves
    • OPEC paper barrels
    • Kuwait Reserves
    • Strategic Oil Reserve
  • Global Peak
    • Algeria peak
    • Angola peak oil
    • Argentina peak
    • Azerbaijan peak
    • Brazil
    • Brunei peak
    • Canada and tar sands
    • Caspian peak
    • China Peak Oil
    • Deepwater peak
    • Egypt
    • Gabon peak
    • India peak oil
    • Indonesia peak
    • Iran Peak
    • Libya peak oil
    • Malaysia-peak
    • Mexico peak
    • Norway peak oil
    • Qatar peak
    • Russia peak
    • Saudi Arabia export peak
    • Sudan Peak
    • Syria
    • Tunesia
    • UAE peak
    • UK Peak
    • US Peak
    • Vietnam peak
    • Venezuela peak
    • Yemen
  • Energy Transitions
    • Germany energy transition
    • Japan Energy Transition
    • UK Energy Transition
    • US
  • Fuel Shortages
    • China Fuel Shortages
    • Egypt Diesel shortages
    • India petrol price hike
    • Malawi fuel shortage
    • Nepal
    • Nigeria fuel shortage
    • Pakistan petrol shortage
    • Russia
    • Tanzania fuel shortage
    • Uganda Fuel Shortage
    • Yemen fuel shortages
  • I told you so
    • Top Ryde Shopping Centre
    • North South Bypass Tunnel (Clem7) Brisbane
    • Airportlink Brisbane
    • Cross City Tunnel
    • Lane Cove Tunnel
    • Too late for Metro tunnels
    • Australian car manufacturing closing down
    • How the first phase of peak oil brought Virgin Australia into minus after 2008
  • Solutions
    • Night trains
    • Electric Rail on Freeways
    • LNG locomotive conversion
    • Electric trolley buses
    • Walk to school
  • Oil crises
    • Oil crisis 1973
    • My experience oil crisis 1979
    • Historical Oil Disruptions
  • Food and Oil
    • Farm Costs Australia
    • Food crises and political instability
  • Global warming
    • Storms of my Grandchildren
    • Extreme weather events
    • Global warming and petrol lines
    • Compensation claims from global warming damage
    • Sea level rises
    • Why coal seam gas will not reduce CO2 emissions
Menu

US shale oil growth covers up production drop in rest-of-world

Posted on September 15, 2014

We use the period starting with January 2010 when crude production had come back to 2005 levels after the exceptional year of 2009
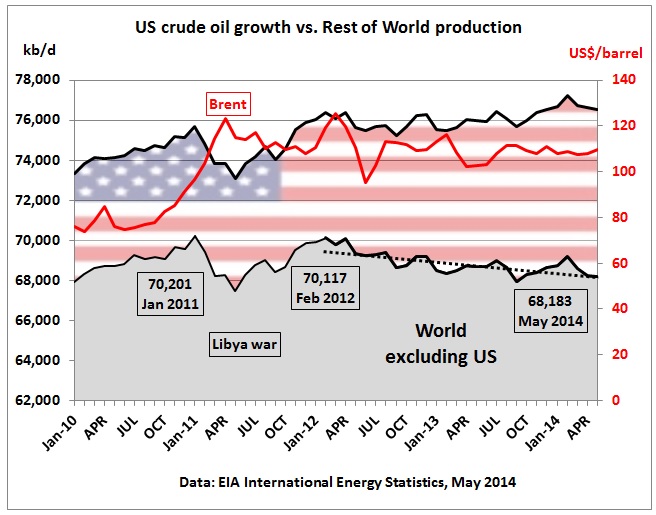
Fig 1: US crude oil vs crude oil in rest-of-world

While US shale oil production is growing, there was a drop in crude production in the rest of world since February 2012 of almost 2 million barrels/d. How did this come about? As usual, there is decline and growth and then we have geopolitics. The following graphs show how much is contributed by whom. Incremental oil production is calculated as monthly oil production minus the minimum monthly production in a given period:
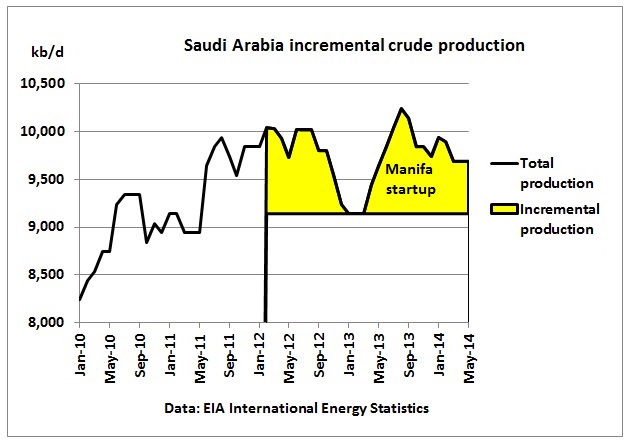
Fig 2: Incremental Saudi crude production (yellow area) in relation to total production

This is an example how incremental production is defined. The drop in Saudi production in the last quarter of 2012 and 1st half of 2013 has not been explained. There is usually a production drop around September (less direct fuel oil burn in power plants) by about 700 kb/d but the above drop was too long compared to previous seasons. The offshore Manifa oil field started up in April

We can see that maximum Saudi crude production did not stay above 10 mb/d for very long.
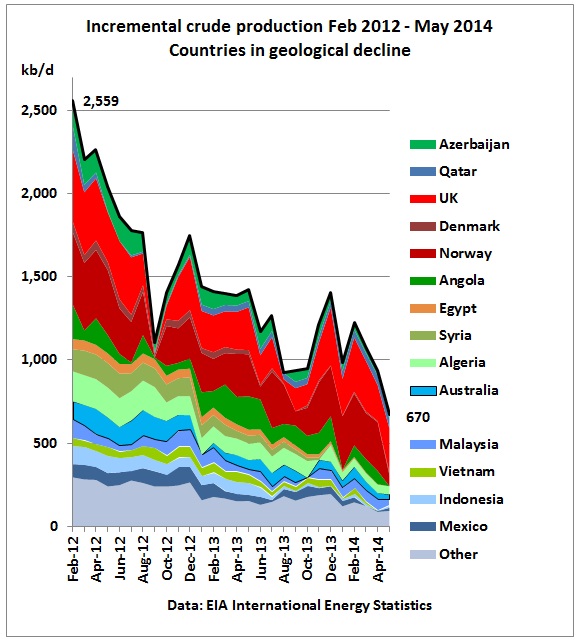
Fig 3: Incremental crude oil Feb 2012-May 2014 in the declining group

Incremental crude production in this group declined from 2,560 kb/d to 670 kb/d or around 1.9 mb/d. Out of a production of 17.6 mb/d in Feb 2012 this is a decline rate of 4.8% (seasonally adjusted 3.8%). Note that North Sea production is zigzagging quite a lot mainly due to maintenance periods but the declining trend is clearly visible.
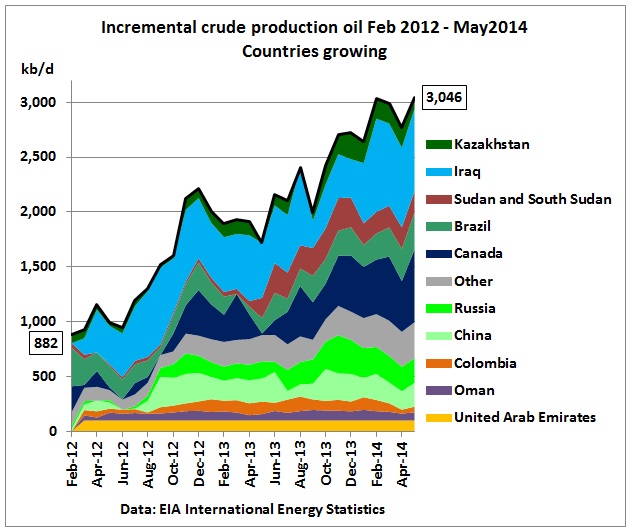
Fig 4: Incremental crude production of growing group

Incremental crude production in this group increased from 882 kb/d to 3,046 kb/d or 2.2 mb/d. The largest contribution came from Iraq. Whether this growth can continue is very much in doubt given the civil strife in this country. Russia and China increased their production in late 2012 (and Russia again in late 2013 but since then could not hold this level sustainably. The Russian Ministry of Finance had warned in July 2014 that their oil production will decline in 2016. Sudan came back and Canadian syn crude from tar sands increased, but with interruptions like in the 1st half of 2013. Brazil is to be monitored whether pre-salt oil can offset decline in legacy fields.
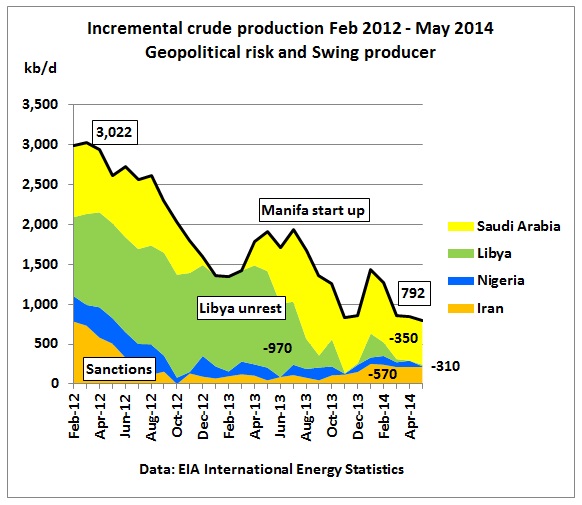
Fig 5: Incremental crude production in geopolitical group

In this group we see the impact of sanctions on Iran and the unrest in Libya. Saudi Arabia could not sustainably offset production drops in Iran and Libya (although the type of oil is also playing a role) so Saudi’s role of swing producer is in doubt. Nigeria is another difficult case. In total, incremental production dropped from around 3 mb/d to 0.8 mb/d

Altogether now.
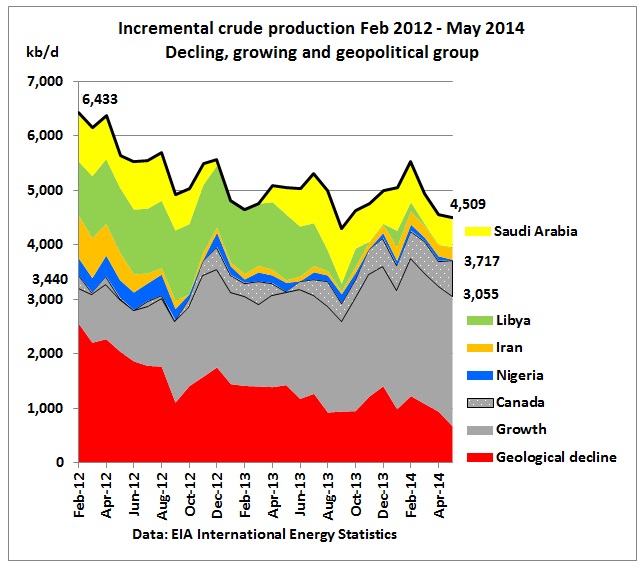
Fig 6: Incremental crude production by group

Growing incremental production more than offset declining production as a result of syncrude from Canadian tar sands. Without this unconventional oil the growing group would not have been able to compensate for decline.

Conclusion:

The world is transfixed on growing world crude production driven by US shale oil but forgets to look what is happening under this remarkable growth curve. We find a production drop in the rest-of-world since February 2012, mainly caused by geopolitics (Iran), civil strife (Libya), corruption (Nigeria) and a poor performance of Saudi Arabia. Declining crude production in one group of countries could still be offset by a growing group, but only because of unconventional oil from Canada and conventional oil from the Southern part of Iraq. Dick Cheney is now praying for the oil fields there.

Related, previous posts:

14/8/2014   IEA report implies US crude oil production may start to peak in 2016

15/6/2014   https://crudeoilpeak.info/worlds-untested-assumption-on-6-mbd-iraqi-oil-by-2020
 

Key data & graphs

  • Net oil importers
  • Oil Exports
  • Crude oil imports
  • Downloads
  • Latest Graphs
  • Oil price analysis
  • US drilling rig count
  • International drilling rig count
  • Australian fuel prices
  • Diary
  • International oil companies
  • US tight oil production
  • China peak oil
  • World liquids supply – demand balance
  • Tankers arriving and departing in Sydney
  • Australian oil and fuel imports

Latest posts

  • Jet fuel stocks just 2.6 days above the Minimum Stockholding Obligation as new Western Sydney Airport enthusiasm soars
  • Asia Pacific peak oil update 2025, consumption 5x higher than production
  • Australian jet fuel stock floating offshore while fuel prices are flying away
  • Australian Diesel imports in August dropped from high in May
  • First early hot summer day in spring 2026 and power prices spike at a whopping AUD 23k per MWh
  • Energy Minister Bowen firm in refusing Russian fuel imports but keeps options open for diesel imports from Russian dependent India

Archives

©2026 Crude Oil Peak | Design: Newspaperly WordPress Theme