Skip to content

Crude Oil Peak

Menu
  • Home
    • About
    • Disclaimer
  • OECD imports
    • France
    • Germany
    • Italy
    • Japan oil imports
    • OECD Europe
    • OECD Pacific
    • South Korea
    • UK
    • US Imports
  • Australian graphs
    • Australian electricity supply graphs
    • Australian crude oil production
    • Australian crude oil reserves
    • Oil import dependency
    • Oil and fuel imports
    • ULP prices
    • Industry stocks
    • End use of oil
    • WA crude oil
    • WA domestic gas
    • East coast conventional gas
    • Geoscience Australia March 2010
    • Geoscience Australia 2005/2006
    • Gippsland
    • LPG
    • Petrol rationing in WW2
  • Oil reserves
    • OPEC paper barrels
    • Kuwait Reserves
    • Strategic Oil Reserve
  • Global Peak
    • Algeria peak
    • Angola peak oil
    • Argentina peak
    • Azerbaijan peak
    • Brazil
    • Brunei peak
    • Canada and tar sands
    • Caspian peak
    • China Peak Oil
    • Deepwater peak
    • Egypt
    • Gabon peak
    • India peak oil
    • Indonesia peak
    • Iran Peak
    • Libya peak oil
    • Malaysia-peak
    • Mexico peak
    • Norway peak oil
    • Qatar peak
    • Russia peak
    • Saudi Arabia export peak
    • Sudan Peak
    • Syria
    • Tunesia
    • UAE peak
    • UK Peak
    • US Peak
    • Vietnam peak
    • Venezuela peak
    • Yemen
  • Energy Transitions
    • Germany energy transition
    • Japan Energy Transition
    • UK Energy Transition
    • US
  • Fuel Shortages
    • China Fuel Shortages
    • Egypt Diesel shortages
    • India petrol price hike
    • Malawi fuel shortage
    • Nepal
    • Nigeria fuel shortage
    • Pakistan petrol shortage
    • Russia
    • Tanzania fuel shortage
    • Uganda Fuel Shortage
    • Yemen fuel shortages
  • I told you so
    • Top Ryde Shopping Centre
    • North South Bypass Tunnel (Clem7) Brisbane
    • Airportlink Brisbane
    • Cross City Tunnel
    • Lane Cove Tunnel
    • Too late for Metro tunnels
    • Australian car manufacturing closing down
    • How the first phase of peak oil brought Virgin Australia into minus after 2008
  • Solutions
    • Night trains
    • Electric Rail on Freeways
    • LNG locomotive conversion
    • Electric trolley buses
    • Walk to school
  • Oil crises
    • Oil crisis 1973
    • My experience oil crisis 1979
    • Historical Oil Disruptions
  • Food and Oil
    • Farm Costs Australia
    • Food crises and political instability
  • Global warming
    • Storms of my Grandchildren
    • Extreme weather events
    • Global warming and petrol lines
    • Compensation claims from global warming damage
    • Sea level rises
    • Why coal seam gas will not reduce CO2 emissions
Menu

US shale oil peak in 2015

Posted on March 30, 2016

The recent EIA drilling productivity reports show a peaking of shale oil production in the main production regions. https://www.eia.gov/petroleum/drilling/

Fig 1: Bakken production change from old/new wells

The 1st panel shows that the number of drilling rigs has dropped sharply but the initial well production per rig has increased from 450 b/d to 750 b/d. The 2nd panel depicts the monthly production decline in old wells, which has stabilized at around 60 kb/d. This is the volume needed to keep production flat but the 3rd panel shows that new wells offset only about half of the decline. That is why in panel 4 overall production declines.

Fig 2: History of production change

We see that in 2015 production from new wells declined abruptly. The intersection point with old wells corresponds to the peak in production. The old wells decline has moderated suggesting that more and more old wells have entered their phase of final, flat production at very low levels.

Fig 3: Eagle Ford production change from old/new wells

Fig 4: Permian production change from old/new wells
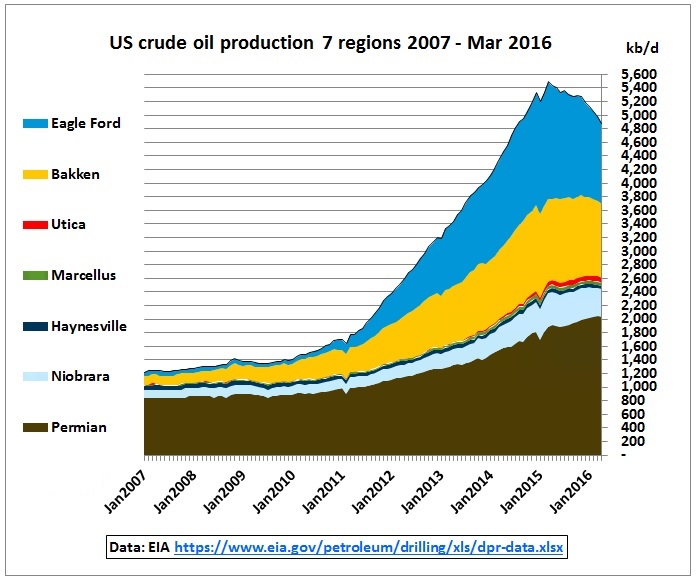
Fig 5: Crude oil production from 7 regions covered in the report

Data are from here:  https://www.eia.gov/petroleum/drilling/xls/dpr-data.xlsx

Let’s add the rest of the US:

Fig 6: Total US crude production

 Forecasts to end 2017 in EIA’s Short Term Energy Outlook

Fig 7: US crude oil forecasts

We see that forecasts by the EIA have been revised downwards since mid of last year. Production at the end of 2017 is expected to increase modestly as a result of rising oil prices.

Fig 8: Oil price range assumed by the EIA

 March 2016 Short Term Energy Outlook http://www.eia.gov/forecasts/steo/

Conclusion:

The so-called US shale oil revolution got stuck in 2015. The longer oil prices remain low, the more the 2015 peak will establish itself. There are no free-bees here. Pay less for oil and you will get less oil.

Key data & graphs

  • Net oil importers
  • Oil Exports
  • Crude oil imports
  • Downloads
  • Latest Graphs
  • Oil price analysis
  • US drilling rig count
  • International drilling rig count
  • Australian fuel prices
  • Diary
  • International oil companies
  • US tight oil production
  • China peak oil
  • World liquids supply – demand balance
  • Tankers arriving and departing in Sydney
  • Australian oil and fuel imports

Latest posts

  • Jet fuel stocks just 2.6 days above the Minimum Stockholding Obligation as new Western Sydney Airport enthusiasm soars
  • Asia Pacific peak oil update 2025, consumption 5x higher than production
  • Australian jet fuel stock floating offshore while fuel prices are flying away
  • Australian Diesel imports in August dropped from high in May
  • First early hot summer day in spring 2026 and power prices spike at a whopping AUD 23k per MWh
  • Energy Minister Bowen firm in refusing Russian fuel imports but keeps options open for diesel imports from Russian dependent India

Archives

©2026 Crude Oil Peak | Design: Newspaperly WordPress Theme