Light festival in Sydney 2023
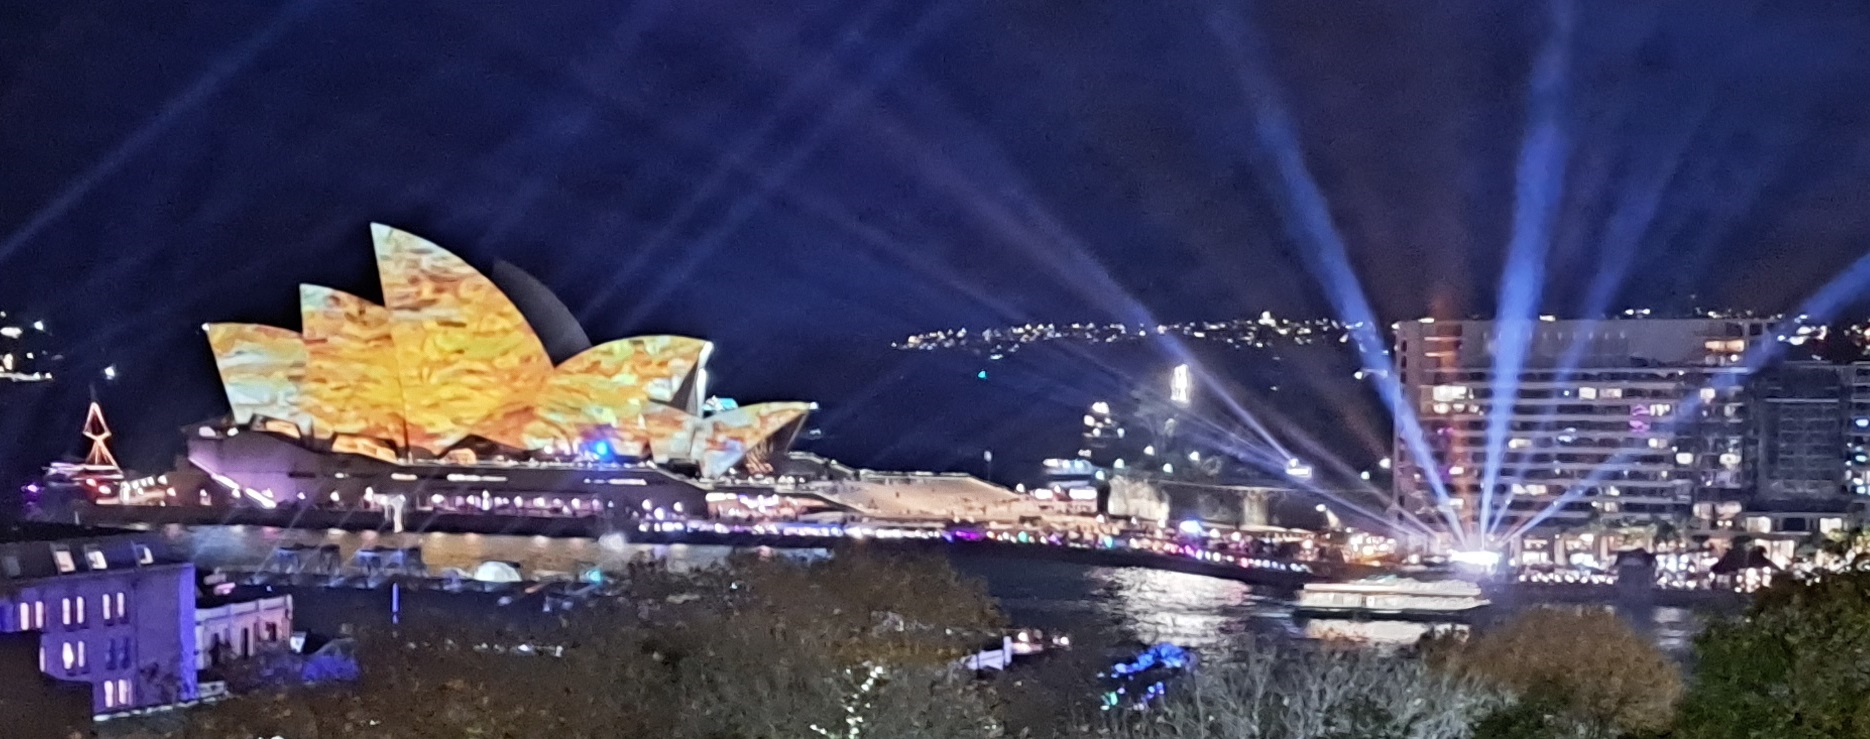
VIDEO: Vivid Festival kicks off in Sydney
https://www.abc.net.au/news/2023-05-26/vivid-festival-kicks-off-in-sydney/102400366
Just a quarter of an hour before Vivid Sydney turned on its lights on 26 May 2023, there was a price spike of $1,400/MWh ($1.4/KWh). Demand was already high (above 11 GW) due to a cold snap.
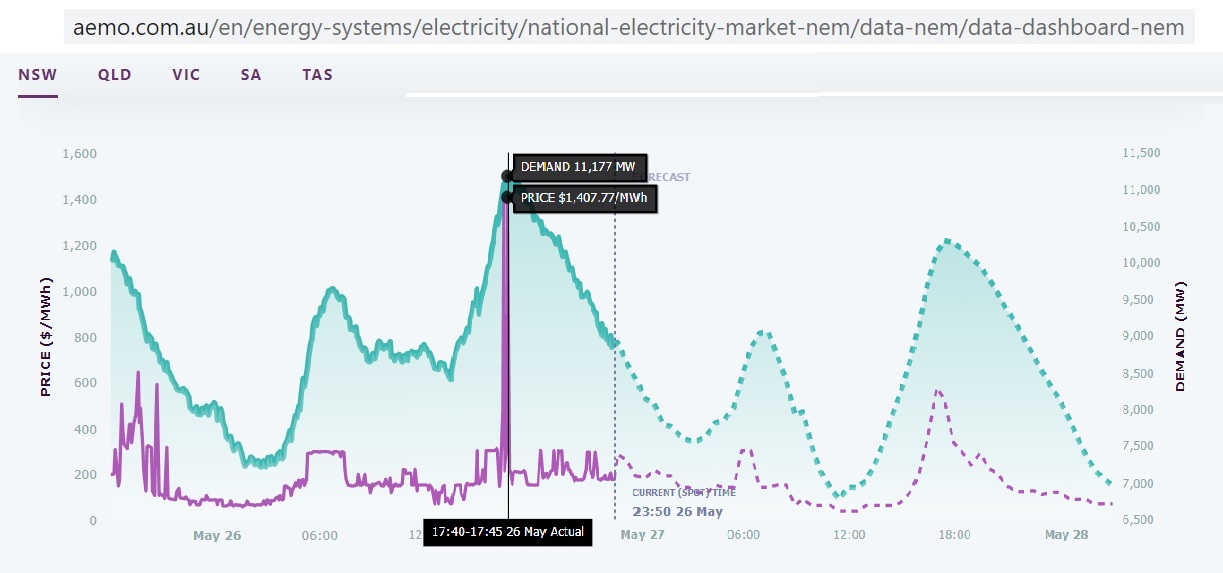 Fig 1: Power demand and electricity prices in NSW 26 May 2023
At the same time, an actual lack of reserve warning was in place:
108197 RESERVE NOTICE 26/05/2023 05:51:09 PM
AEMO ELECTRICITY MARKET NOTICE
Actual Lack Of Reserve Level 1 (LOR1) in the NSW region – 26/05/2023
An Actual LOR1 condition has been declared under clause 4.8.4(b) of the National Electricity Rules for the NSW region from 1730 hrs.
The Actual LOR1 condition is forecast to exist until 2030 hrs.
The forecast capacity reserve requirement is 1400 MW.
The minimum capacity reserve available is 973 MW.
Manager NEM Real Time Operations
https://aemo.com.au/en/market-notices
A LOR1 exists when reserve levels are lower than the 2 largest supply resources in a state. As an example, in NSW one unit of Eraring is 700 MW. By the way, ER02 went off-line at midnight 22/23 May, coming back on 27 May, 7 pm, ramping up slowly to 205 MW by midnight.
So what is the power consumption of the light display?
We find on Vivid’s website:
Partnering with Tasman Environmental Group, Vivid Sydney is in the process of offsetting 211,446 kWh of electricity that was recorded throughout the 23 days and nights of the festival. This equates to the usage of 476 Sydney homes (with 2.5 people) per each night of the festival.
86% of Vivid Sydney’s lighting installations were grid-connected to 100% green-power accredited renewable energy through Transgrid. In addition, 85% of lighting installations used LED fixtures, a choice that reduces power consumption by more than 65%, when compared to non-LED fixtures.
https://www.vividsydney.com/info/sustainability-2023
“was recorded” last year? Anyway, let’s take this number. 211,446 KWh/23 days/5 hrs = 1.8 MW average. Plus the additional power consumption from appr. 2 million visitors i.e. 90,000 per evening and other events. Let’s assume every visitor consumes just 0.5 KWh, that would be 90,000 x 0.5 KWh/5 hrs = 9 MW, more than the lights. Together 11 MW. That’s not much. But let’s have a look at the power supply in NSW in May 2023. The price spike in Fig 1 was just one 10th of earlier spikes:
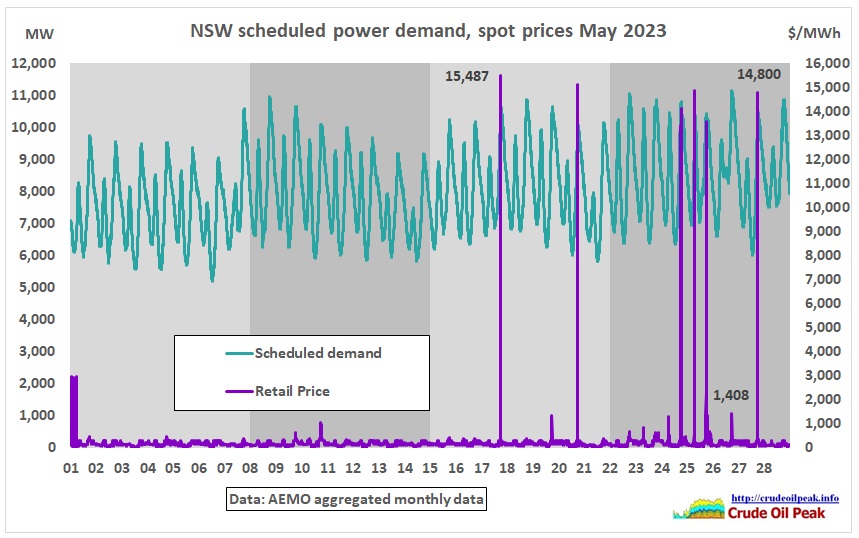 Fig 2a: NSW power price spikes 1-28 May 2023
Market Price Cap [MPC] and Cumulative Price Threshold [CPT]
23 February 2023
Under the National Electricity Rules, the Australian Energy Market Commission (AEMC) is required to adjust the market price cap and cumulative price threshold for the national electricity market, in line with the consumer price index, by 28 February each year.
The market price cap is the maximum price that can be reached on the spot market during any dispatch and trading interval. The cumulative price threshold is the maximum price across seven days worth of trade.
2022-23 2023-24
Market price cap $15,500 / MWh $16,600 / MWh
Cumulative price threshold $1,398,100 $1,490,200
The updated values, which will apply from 1 July 2023, and underlying calculations are available in a schedule of reliability settings on the AEMC website.
https://www.aemc.gov.au/news-centre/media-releases/aemc-publishes-schedule-reliability-settings-2023-24
https://www.aemc.gov.au/sites/default/files/2023-02/Schedule%20of%20reliability%20settings%20-%20Calculation%202023-24%20financial%20year.pdf
”Average trading” would bring the CPT to around 320,000 ($160 x 7 x 288). 20 price spikes at $15,000 add another $300,000; together $620,000, less than half the CPT. Therefore, its exceedance is very rare.
Wattclarity describes how the CPT works:
https://wattclarity.com.au/articles/2022/06/10june-qld-cumulativeprice-above-1100000/
We zoom into power prices up to $2,000 to show more detail:
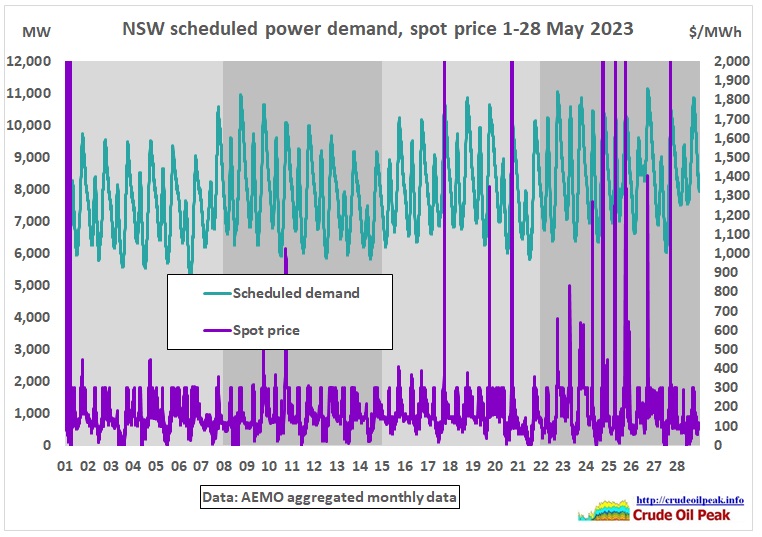 Fig 2b: NSW scheduled demand and spot prices
96% of 5 min trading intervals have spot prices <=$300/MWh. That’s amazing as the APC was increased from $300 to $600.
Administered Price Cap (APC)
AEMC Rule determination
Amending the administered price cap
17 Nov 2022
The Commission has made a final rule on Amending the administered price cap (APC) in
response to a rule change request received from Alinta Energy. The Commission considered
the rule change to be urgent as it relates to a matter imminently prejudicing or threatening
the effective operation of the wholesale exchange operated by AEMO and the safety, security
and reliability of the national electricity system, and initiated the rule change request under
an expedited process. The final rule is a transitional arrangement which changes the APC
from $300/MWh to $600/MWh, from 1 December 2022 until the end of 30 June 2025. Any
longer-term change to the setting would be made following the AEMC’s consideration of the
Reliability Panel’s rule change request.
https://www.aemc.gov.au/sites/default/files/2022-11/Amending%20the%20administered%20price%20cap%20-%20Final%20Determination.pdf
The Commission gave following reasons:
• international events and local fuel constraints have materially increased generator inputs including gas, coal and liquid fuel prices
• Historically, gas prices traded at around $10/GJ. The ACCC LNG netback benchmark price for gas in Australia increased from $27.96/GJ in June to a high of $66.99/GJ in October. The November 2022 forward price was trading at $44.32/GJ. The value of the gas administrative price cap was $40/GJ. As the APC was lower than the cost of electricity generated from gas some gas-powered generators withdrew their capacity.
• Export coal prices from Newcastle at over $400 USD/t, (with historical levels at or below $100 USD/t) have impacted coal availability to domestic power generators.
• Extreme rain events in the eastern states have also reduced coal availability to domestic power generators, compounding domestic coal supply issues.
• higher customer demand due to cooler than expected winter condition
• lower than average wind and solar output
• the volume of planned and unplanned outages of conventional thermal generators
Watt Clarity on administered price caps
https://wattclarity.com.au/articles/tag/administered-price-cap/
Back to the Vivid Sydney’s feel-good argument to offset emissions. What matters of course is the power mix in the grid at the time power is turned on. Coal was 54.7 % and gas 14.8%. And imports at 7.4% from Queensland (after sunset: 65% coal, 24% gas). So in total the Vivid lights were powered by coal and gas at 76%.
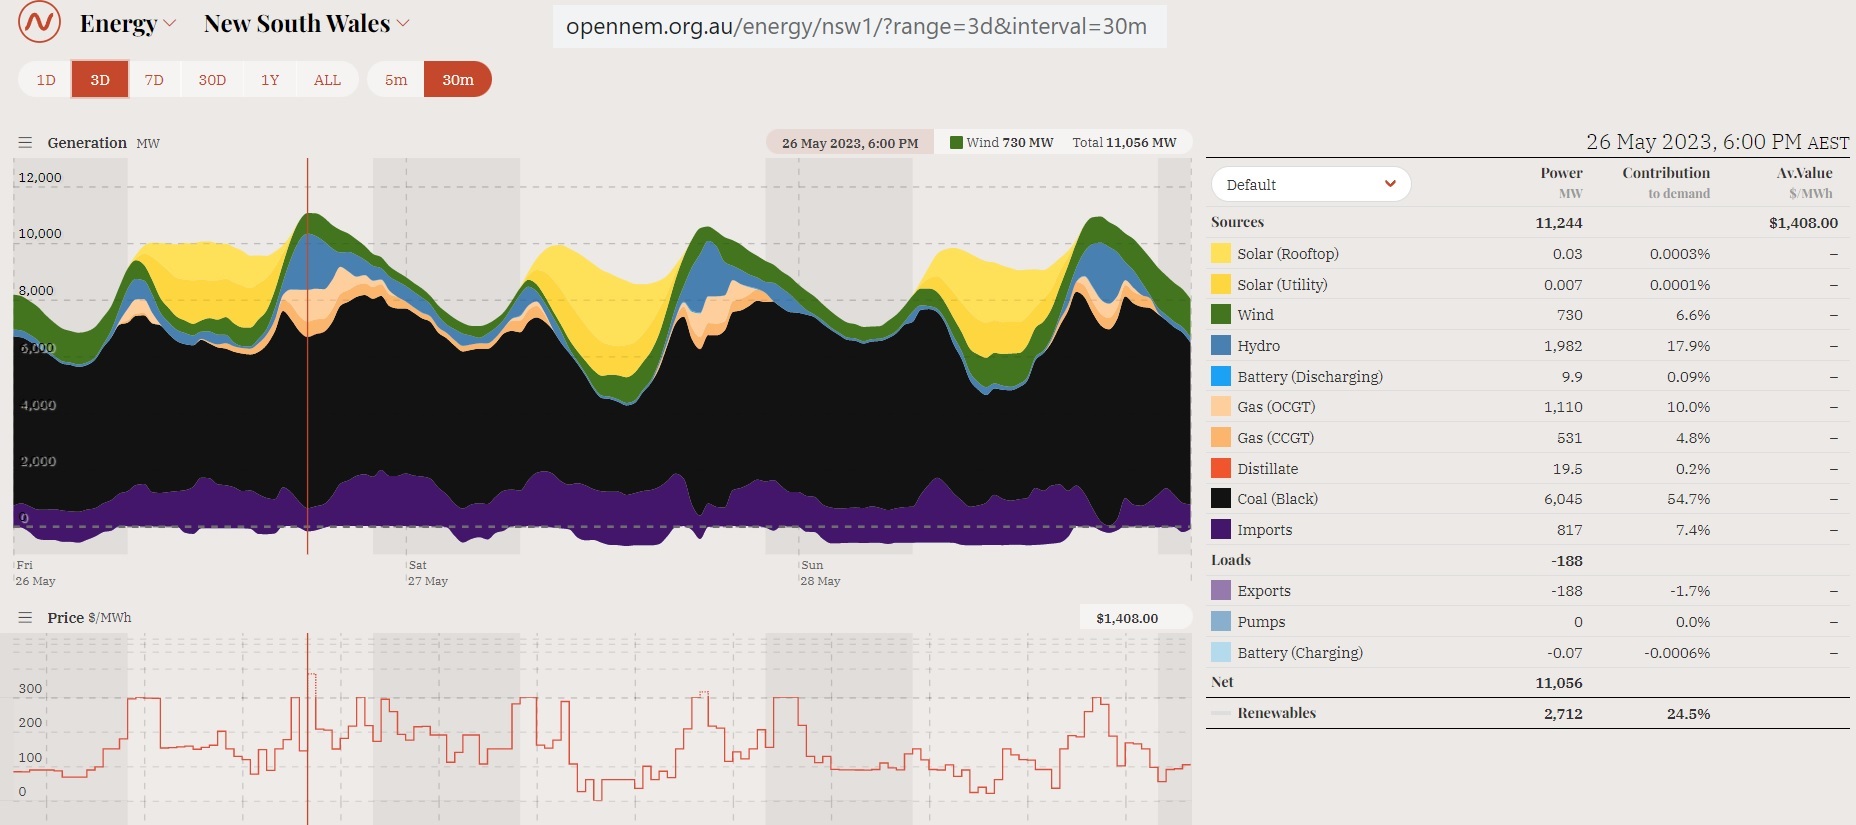 Fig 3: NSW power generation by fuel 26-28 May 2023
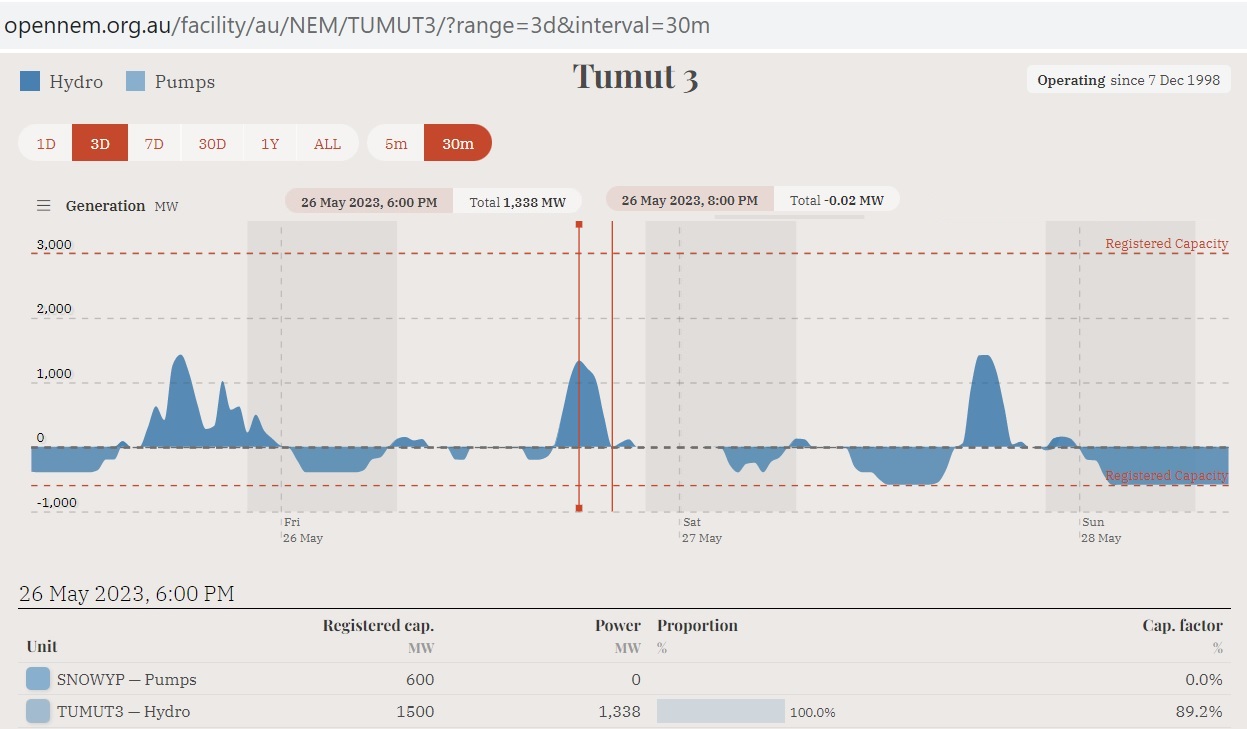 Fig 4: Power generation from pumped hydro
As we can see, generation from hydro power went down after 6pm.
The price spike on the 1st evening of Vivid was dwarfed by 12 previous price spikes >13,000/MWh 2 days earlier, on 24/25 May 2023: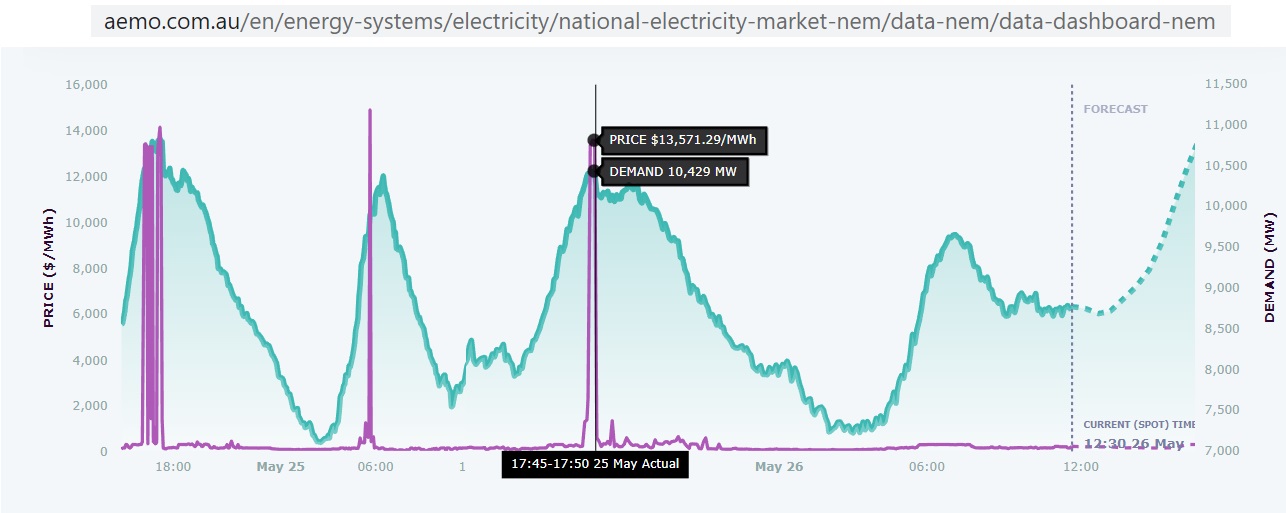 Fig 5: Price spikes 24/25 May 2023
This post will be continued in part 2.
Conclusion: If Vivid’s numbers are correct, an extra 11 MW is not much. But the festival comes at a time of energy crisis. The wrong signals are sent while the public is not informed about the precarious power supply situation. We need to power down, not continue business-as-usual.
Matt Mushalik (MEng)
31/5/2023