But will $740 million be enough to complete the M2 widening?

Out of $740 million of new loans given by banks to Transurban, $465m are only for refinancing old M2 debt, leaving just $275 m for a project which costs $550 m to build. Where will the other $275 m come from? Transurban already sits on a mountain of debt which is continuously being rolled over (or should we say tolled over), but not paid back.
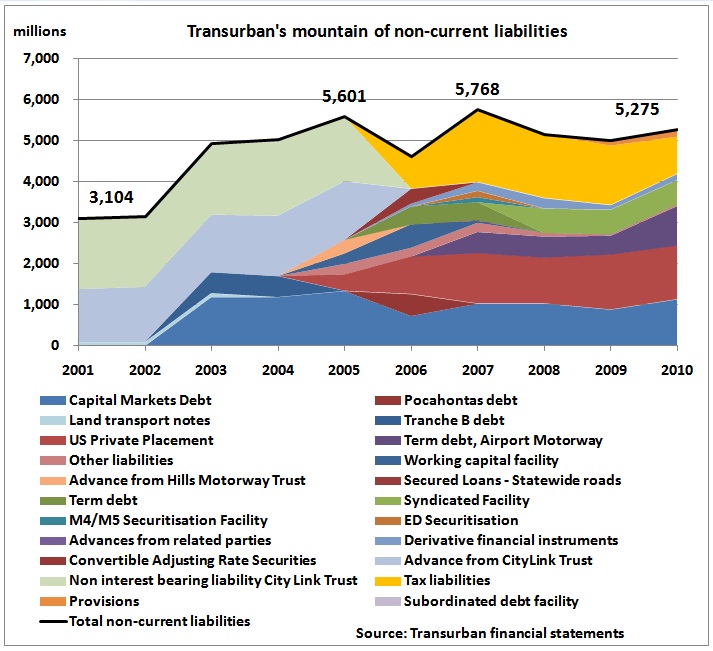
Up: Transurban is sitting on a big mountain of liabilities. The only way out of this dilemma is a new business model away from oil. Time for public transport solutions is running out as we are approaching the next oil crunch which may come just when the M2 widening is scheduled to be open for traffic. Every month counts.
Data from: http://www.transurban.com.au/346.htm
Transurban finds $740m for M2
TRANSURBAN, the country’s biggest operator of toll roads, has signed $740 million of loans to finance the long-awaited upgrade of the Hills M2 Motorway in north-western Sydney.
The company has obtained four- and six-year non-recourse project financing from the Commonwealth Bank, NAB, the Bank of Tokyo-Mitsubishi, Credit Agricole, Scotiabank Group and Sumitomo Mitsui Banking Corporation, it said in a statement to the ASX yesterday.
The cost of the improvements are expected to be $550 million. Yesterday’s funding includes the re-financing of $465 million of existing debt and $275 million of new debt.
http://www.smh.com.au/business/transurban-finds-740m-for-m2-20101119-180yc.html
Peak oilers wish these banks good luck. They need more luck than they deserve, not having looked at oil production data and not being professionally able to do fundamental energy calculations as presented here:
19/6/2010 M2 widening: Primary Energy Dilemma for cars
http://www.crudeoilpeak.com/?p=1631
I had sent out many emails and faxes to banks, they had 4 months time to do their own calculations. The way things are going, the M2 widening will become another candidate for my “I told you so” column, just like the Clem 7 road tunnel. How much more money will banks have to lose until they understand peak oil?
| So we have | $ 740 m |
| Refinancing old M2 debt | – $ 465 m |
| Balance new debt | $ 275 m |
| Construction cost M2 widening | $ 550 m |
| additional funds needed | $ 275 m |
So the question is: where will this money come from?
In the Transurban Annual report 2009-2010 it says on page 104:
Events occurring after the balance sheet date
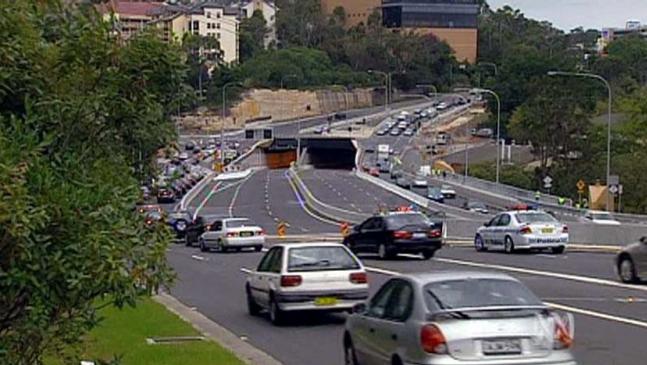
Subsequent to the end of the financial year, the Group has completed the acquisition of the assets and motorway concession deed connected with the Lane Cove Tunnel in Sydney. The Group took control of the assets and concession deed on 10 August 2010. The acquisition was funded through cash on hand from a capital raising in May 2010 and external borrowings.
http://www.transurban.com.au/files/TRN021_AR10_Fins_FA3.pdf
The Lane Cove Tunnel cost was $630.5 million.
The capital raising in May 2010 was widely publicised
and yielded only $542.3 million (117,916,625 triple stapled securities) out of which institutional investors took up $410 million. The retail offer was not fully taken up at $4.6 so the rest went to the underwriter UBS AG, Australia branch.
Strangely enough, there was no Product Disclosure Statement (which would, for example, have to include traffic forecast calculations) and the purpose of the capital raising was also very generally formulated in this ASX press release dated 16/6/2010 as:
“The purpose is to raise funds to be used to partially fund the acquisition of the Lane Cove Tunnel, to provide additional funding flexibility for identified growth opportunities, and otherwise for general corporate purposes”
http://www.transurban.com.au/AMENDED_APPENDIX_3B_FOR_THE_ENTITLEMENT_OFFER.pdf
But what about the “external borrowings” needed to cover the difference between $542.3 million and 630.5 million? And how much “cash on hand” was used? From the above annual report 2010 we have in the cash flow statement on page 54
| Proceeds from issues of stapled securities, net of costs | $ 530.929 m | (oops, 11.4 million gone) |
| Balance of all other cash transactions in the financial year | $ 150.330 m | |
| Cash and cash equivalents at end of year | $ 681.259 m |
In the financial year 2010/2011
| Payment of Lane Cove tunnel | $ -630.500 m |
| Balance after payment for Lane Cove Tunnelt | $ 50.759 m |
Ouch, that’s not much left over. Current liabilities at the end of the financial year were:
| Trade and other payables | $ 202.354 m |
| Borrowings | $ 35.604 m |
| Derivative financial instruments | $ 2.822 m |
| Current tax liabilities | $ 17.779 m |
| Provisions (distributions, employees, maintenance | $ 293.569 m |
| Total current liabilities (30/6/2010) | $ 630.163 m |
Incidentally, a similar amount to the cost of the Lane Cove Tunnel.
For comparison, quarterly toll revenue in the September quarter 2010 was, in $ million (net of GST)
| share | |||
| City Link | 107.752 | 1 | 107.752 |
| Hills M2 | 36.698 | 1 | 36.698 |
| Lane Cove Tunnel | 8.347 | 1 | 8.347 |
| M1 Eastern Distributor | 23.249 | 0.751 | 17.460 |
| West Link M7 | 47.939 | 0.5 | 23.970 |
| M5 | 42.635 | 0.5 | 21.318 |
| Pocahontas | 3.575 | 0.75 | 2.681 |
| All 7 toll-ways | 218.225 |
http://www.transurban.com.au/September_traffic_and_revenue_data.pdf
So Transurban needs around 3 quarters worth of toll revenue just to cover it’s short term liabilities at the beginning of the financial year.
Equities:
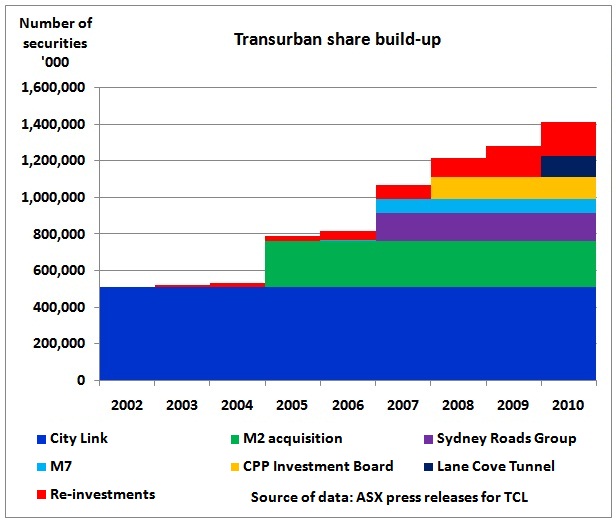
The number of Transurban shares has been steadily increasing. If that continues and traffic doesn’t grow for peak oil or CO2 reasons, there could be a dilution problem.
Shares are vulnerable to oil shocks as already mentioned in a previous post:
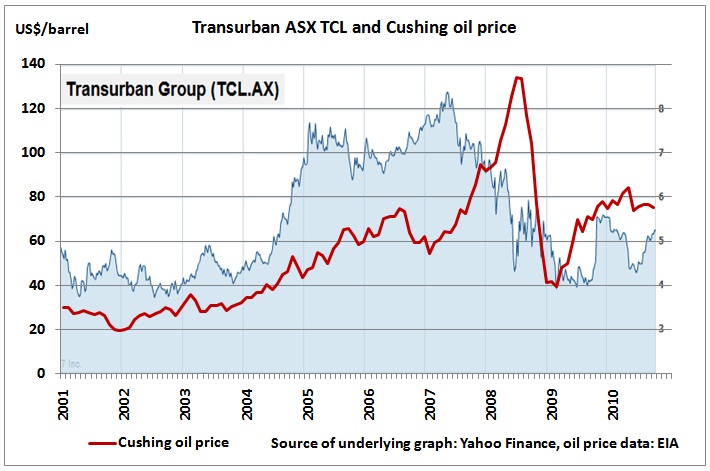
Distributions peaked in 2008, is that a coincidence with what I call the Oilympic peak year?
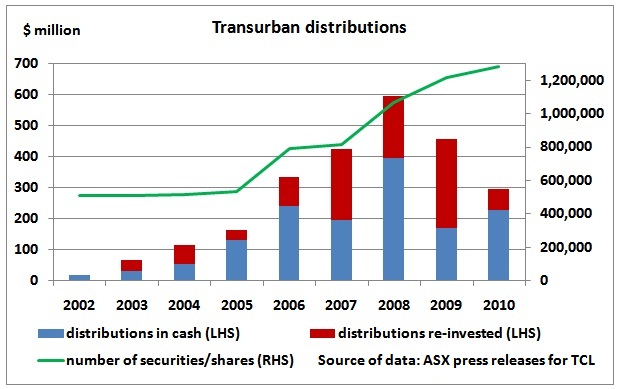
It should also be of concern to Transurban that cash payouts of distributions are again increasing, possibly requiring bridge facilities.
Thus the question is justified: where will the money come from to complete the M2 widening? What happens if there is another oil war in the Middle East? Or another oil price shock? Will Transurban now go again on the equity market to raise funds for the M5 widening? How long will this go on like this? When will Transurban actually REDUCE its non-current liabilities which stand at a whopping $5.275 bn?
Previous posts on the same topic:
15/11/2010 Transurban’s M7 traffic 38% less than expected
http://www.crudeoilpeak.com/?p=2136
9/11/2010 M2 widening increases Sydney’s oil vulnerability
http://www.crudeoilpeak.com/?p=2039
Banks did not do their homework:
28/10/2010 Quick risk analysis for M2 widening (Part2)
http://www.crudeoilpeak.com/?p=2012
25/10/2010 Sydney’s RTA about to pull down public transport infrastructure
http://www.crudeoilpeak.com/?p=1992
21/9/2010 RTA fails to present business case for M2 widening (part 1)
http://www.crudeoilpeak.com/?p=1886
.