The annual BP Statistical Review with data up to and including 2016 was published last week. In this post we have a look at oil statistics for Asia – Pacific. China’s oil production has declined in 2016 by 310 kb/d while total Asian consumption went up by 1,080 kb/d. The gap between oil production and consumption has widened to a whopping 24.5 mb/d, one third of which comes from China.
Production
For the BP Statistical Review “oil” means crude oil, tight oil, tar sands, natural gas liquids and condensate from gas fields.
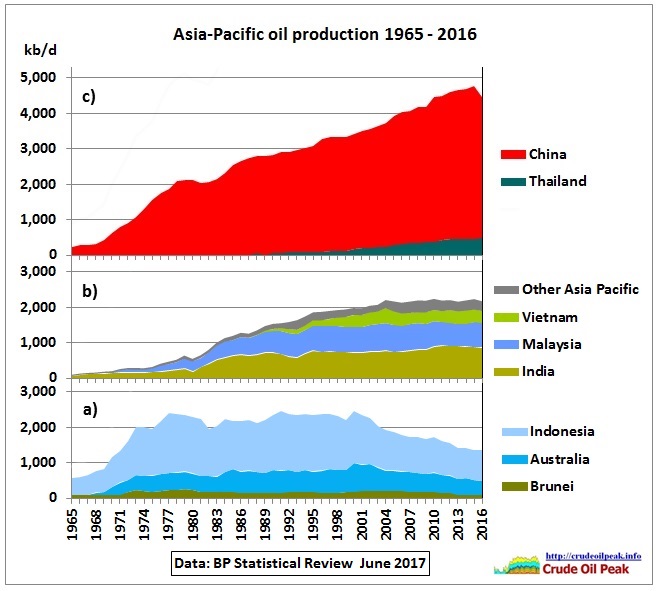 Fig 1: Asia-Pacific oil production by growth and decline rates
Panel a: oil production is in decline since 2000 when Australia peaked. Annual decline rates varied between -9.1 % and -0.7%, averaging -3.6%. This number includes years when production increased slightly.
Panel b: oil production is practically flat since 2004 at around 2,190 kb/d ±50 kb/d
Panel c: oil production growth was dominated by China (2.3% pa between 1982 and 2015) but that has come to an end with an astonishing decline of -310 kb/d or -7.2 % in 2016.
The South China Morning Post reported:
16/1/2017
“In an interview with the South China Morning Post from Singapore. “Capital investment cuts by the major Chinese national oil companies, shifting government policies to focus on profitability rather than output volume and oilfield maturity are the key factors behind this decline.”
Two of China’s oldest and largest oilfields, PetroChina’s Daqing field in Heilongjiang province, and Sinopec’s Shengli in Shandong, have already reduced their 2016 production by 4.8 per cent and 11.8 per cent respectively, as low global oil prices forced them to shut unprofitable wells, according to a Shanghai Securities News report.
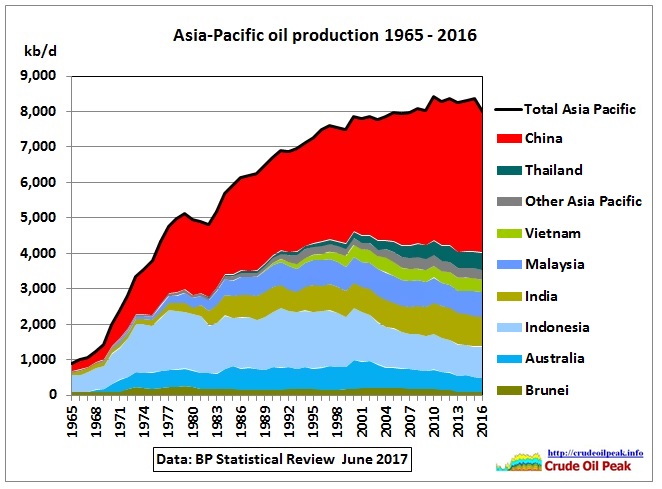 Fig 2: Oil production in Asia-Pacific
Let’s have a look at monthly data from a different source, JODI (data series start in 2002)
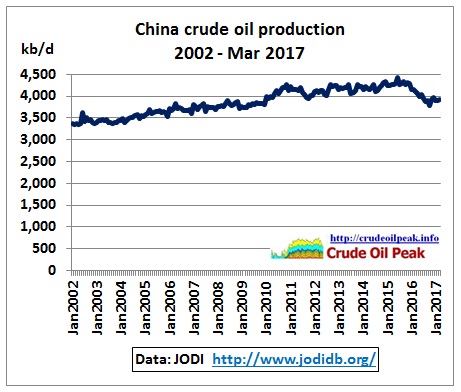 Fig 3: China’s monthly crude oil production
So China’s crude production is back to 2010 levels after a peak in July 2015.
Oil consumption
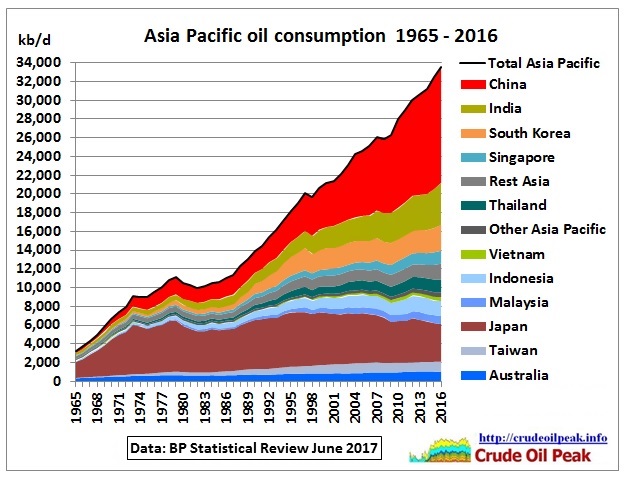 Fig 4: Oil consumption in Asia Pacific
Oil consumption has been relentlessly increasing at an average of 3.8% pa since the stock market crash of 1987. There were only 2 short interruptions during the Asian financial crisis (1998) and the global financial crisis (2008). But after each of these crises demand growth resumed so something very big must happen to stop this trend because ultimately it must bump into oil supply limits.
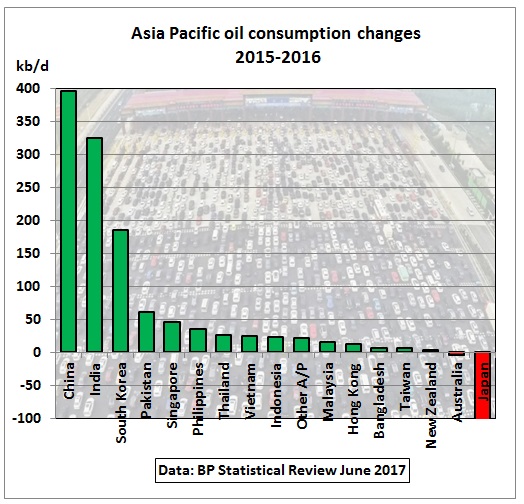 Fig 5: Consumption growth in 2016 compared to 2015
76% of all consumption growth has come from just 3 countries: China, India and South Korea. From these 3 countries we had following net increase of imports:
| Net increase of oil imports in 2016 to China, India and South Korea | |||
| Production decline | Consumption growth | Net increase imports | |
| kb/d | kb/d | kb/d | |
| China | -310 | 400 | 710 |
| India | -20 | 325 | 345 |
| South Korea | na | 190 | 190 |
| Top 3 | -330 | 915 | 1,245 |
.
Oil production vs consumption
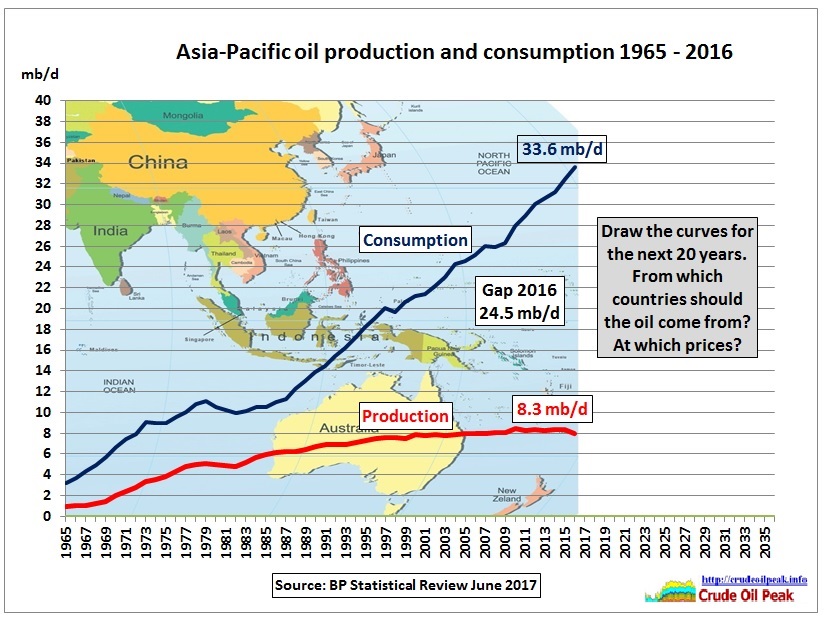 Fig 6: Where will the oil come from to fill the gap over the next 20 years?
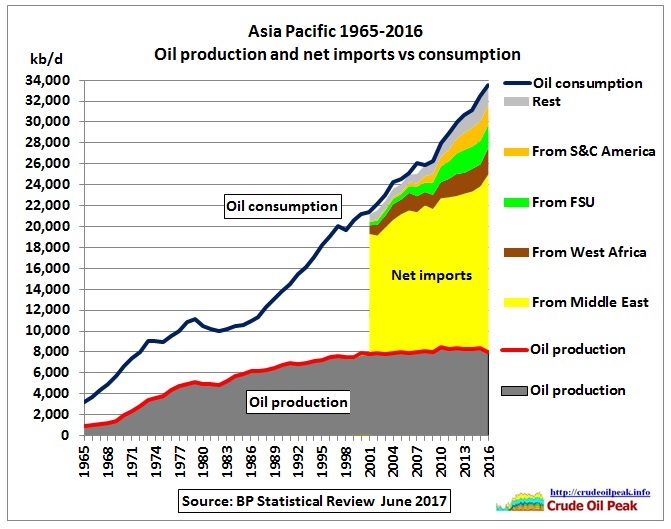 Fig 7: Asia Pacific oil production and net-imports
2/3 of net imports come from the Middle East, although its share has decreased as China and India have increased imports from Africa, South & Central America and Russia.
Oil reserves
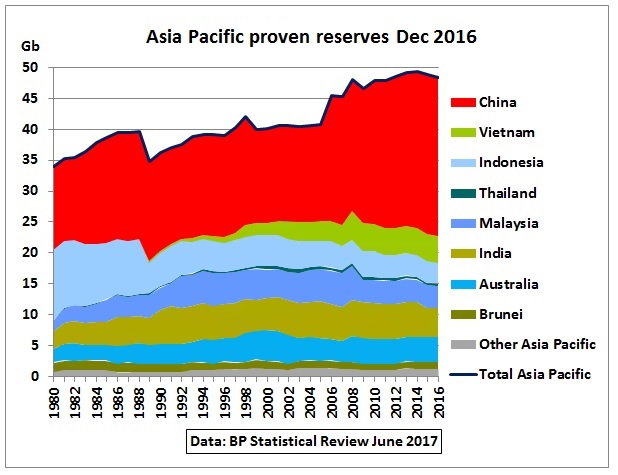 Fig 8: Proven oil reserves end 2016 in the BP Statistical Review
Note the sudden jump in Chinese oil reserves which was not there in last year’s review.
Fig 8 is indicative. For probability reasons, only mean reserves can be added. Jean Laherrere, French oil geologist and author of the ASPO website in France, has shown that oil reserves in BP’s Statistical Review are unreliable and political.
World US Saudi Arabia Russia UK oil production reserves August 2016 by Jean Laherrere
Nevertheless, let’s use the BP Review numbers to get an idea how that compares with cumulative production:
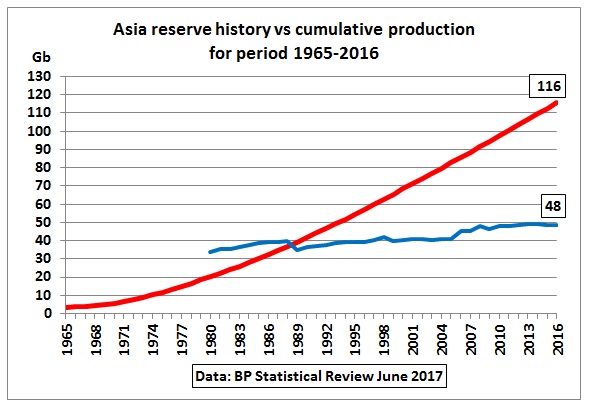 Fig 9: Asia’s reserve history compared with cumulative production
If no more resources can be turned into reserves (e.g. because they are unaffordable) the depletion level is 116/(116+48) = 70%
Related posts from last year
25/6/2016
Peak oil in Asia and Oil Import Trends (part 2)
http://crudeoilpeak.info/peak-oil-in-asia-and-oil-import-trends-part-2
20/6/2016
Peak oil in Asia (part 1)
http://crudeoilpeak.info/peak-oil-in-asia-part-1