Production: pre-Covid trends prevail
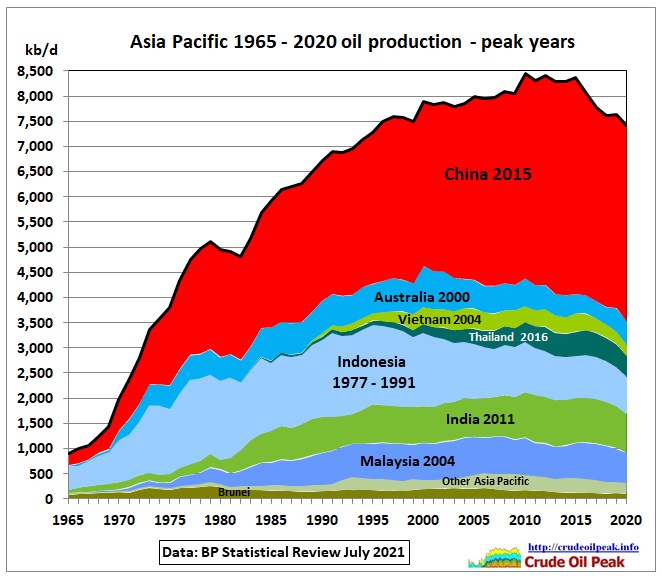 Fig 1: Oil decline in 2020 was a modest 200 kb/d similar to the post 2015 trend
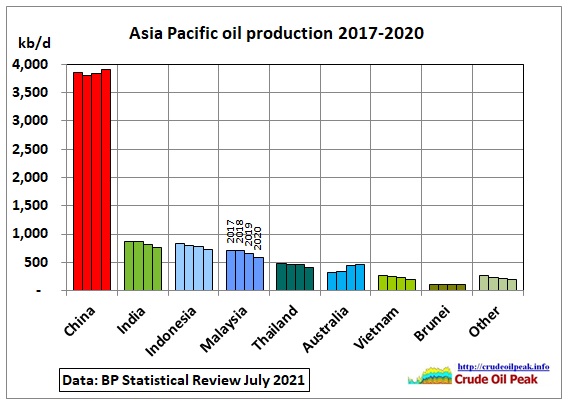 Fig 2: China’s (and Australia’s) modest growth of 65 kb/d (12 kb/d) could not offset decline elsewhere
Oil reserves: declined by 8% since 2013
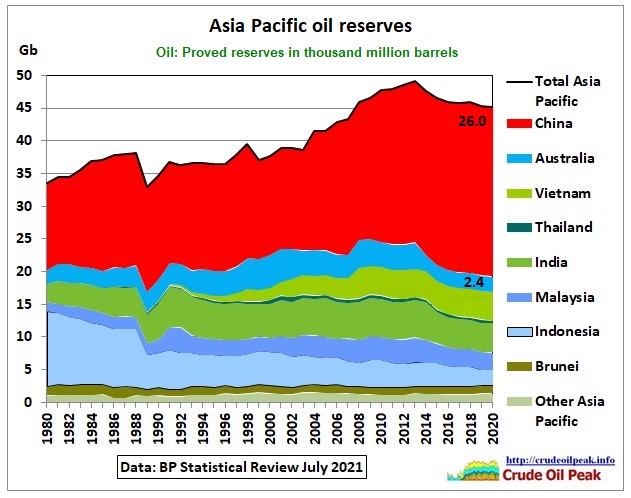 Fig 3: Asia Pacific oil reserves stood at 45 Gb in 2020
It is to be noted that “proved” reserves in the BP Statistical Review are not really proven 1P reserves. Best estimates are actually 2P reserves (proved + probable). The following extract from a table published by the Norwegian energy consultant Rystad in July 2021 makes this clear:
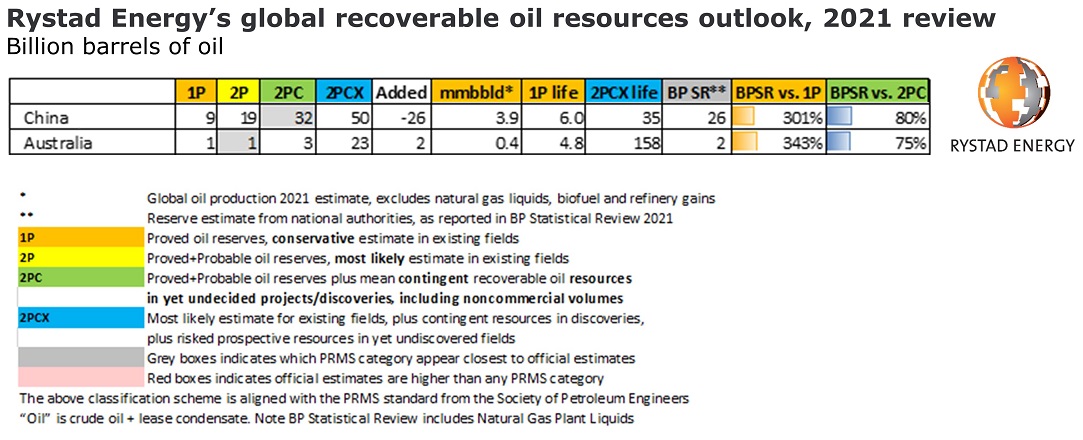 Fig 4: Rystad’s oil reserves and resources for China and Australia
https://www.rystadenergy.com/newsevents/news/press-releases/worlds-recoverable-oil-now-seen-9pct-slimmer-commercial-volumes-can-keep-global-warming-below-1p8c/
According to Rystad’s table, China’s proved reserves are 9 Gb (only 6 years of production), not 26 Gb which is somewhere between 2P (most likely in existing fields) and 2PC (including yet undecided discoveries and non-commercial volumes).
In Australia, Rystad’s proved reserves are also lower than those given in the BP Statistical Review. According to Geoscience Australia 2P reserves (crude oil, condensate, LPG) are 1.8 Gb and resources 2.2 Gb in 2019.
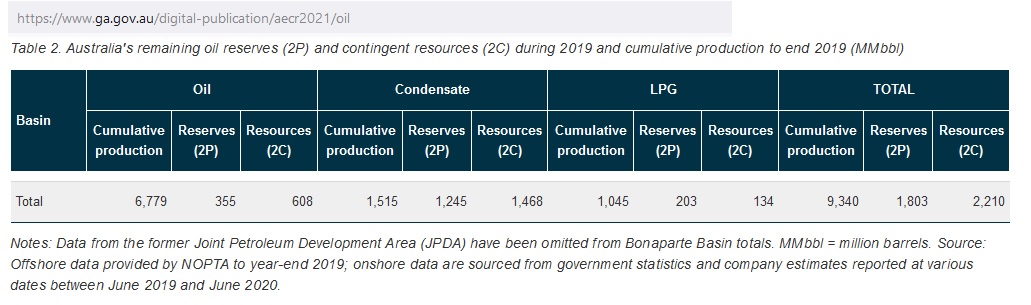 Fig 5: Australia’s oil reserves and resources
https://www.ga.gov.au/digital-publication/aecr2021/oil
Note that Australia’s oil reserves are depleted by 9.3/(9.3+1.8) = 84% and resources by 70%. Rystad’s 2PCX resources of 23 Gb would include unconventional contingent oil.
Let us assume the BP Statistical Review reserves of 45 Gb were 2P reserves and could be economically produced. A bell curve shaped decline of between 200 and 250 kb/d would consume around 43 Gb until 2050. The following graph is NOT a Hubbert linearization but just an illustration showing the magnitude of these reserves in comparison with observed decline rates since the peak in 2015
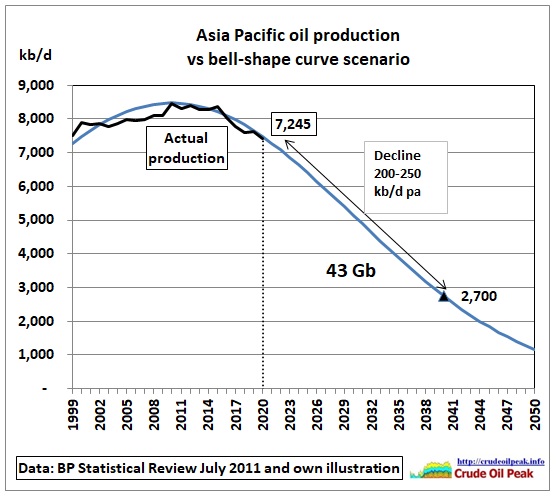 Fig 6: A bell shape curve has been fitted into actual production 1999-2020
This could to be an involuntary contribution to the net zero emissions target.
Oil consumption: that’s where the big change was
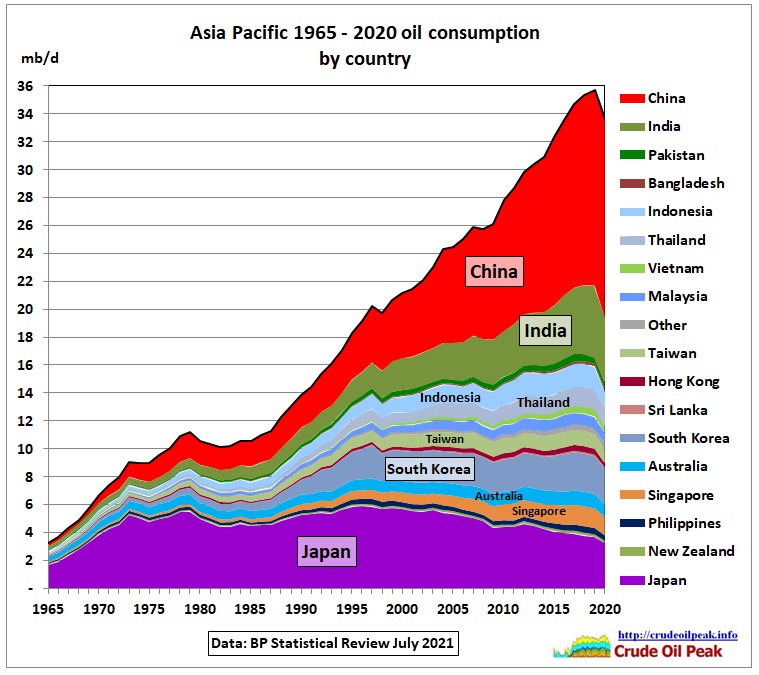 Fig 7: Oil consumption dropped by 2.1 mb/d (-5.8%) due to the Corona virus
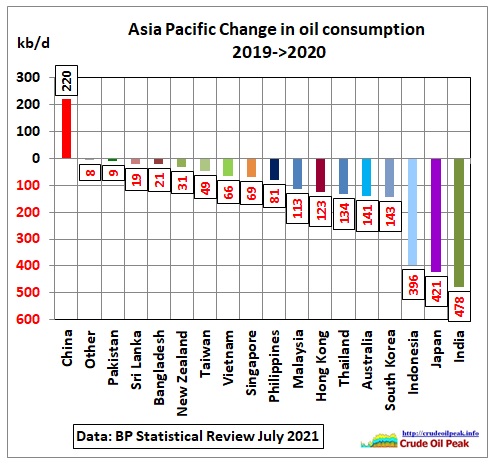 Fig 8a: Consumption drops by country in kb/d. Biggest changes in Indonesia, Japan and India
China was the only country where consumption increased. All the other drops were not uniformly distributed. Different countries were impacted to various degrees measured in per cent of consumption:
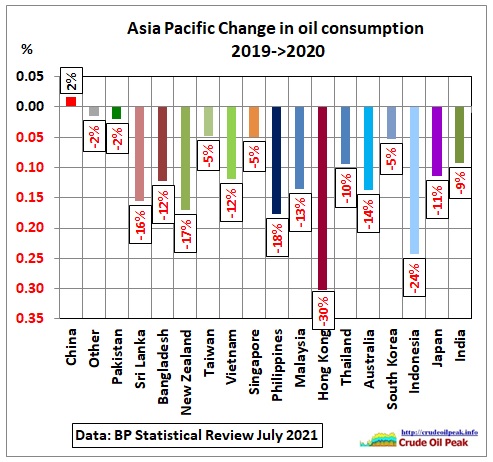 Fig 8b: Consumption drops by country in %
Hong Kong (most likely hit by a reduction in flights) and Indonesia stand out. New Zealand and Australia had strict lock-downs.
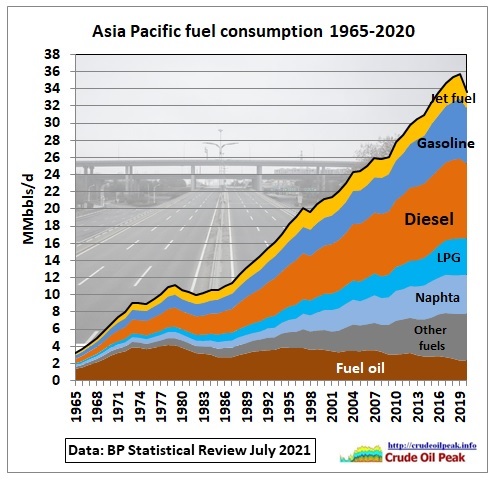 Fig 9: Oil consumption by fuel
The biggest impact was on land and air transport fuels (17 mb/d). Note that other fuels, mainly used in the chemical industry and shipping, remained flat:
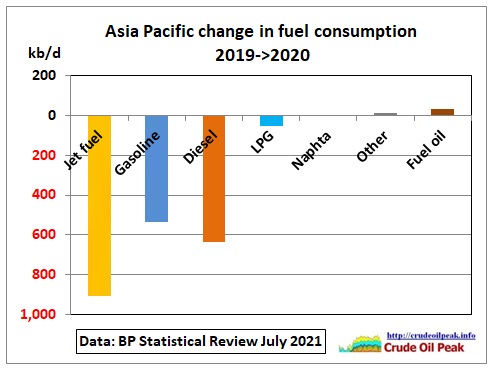 Fig 10: Fuel consumption change
Oil imports
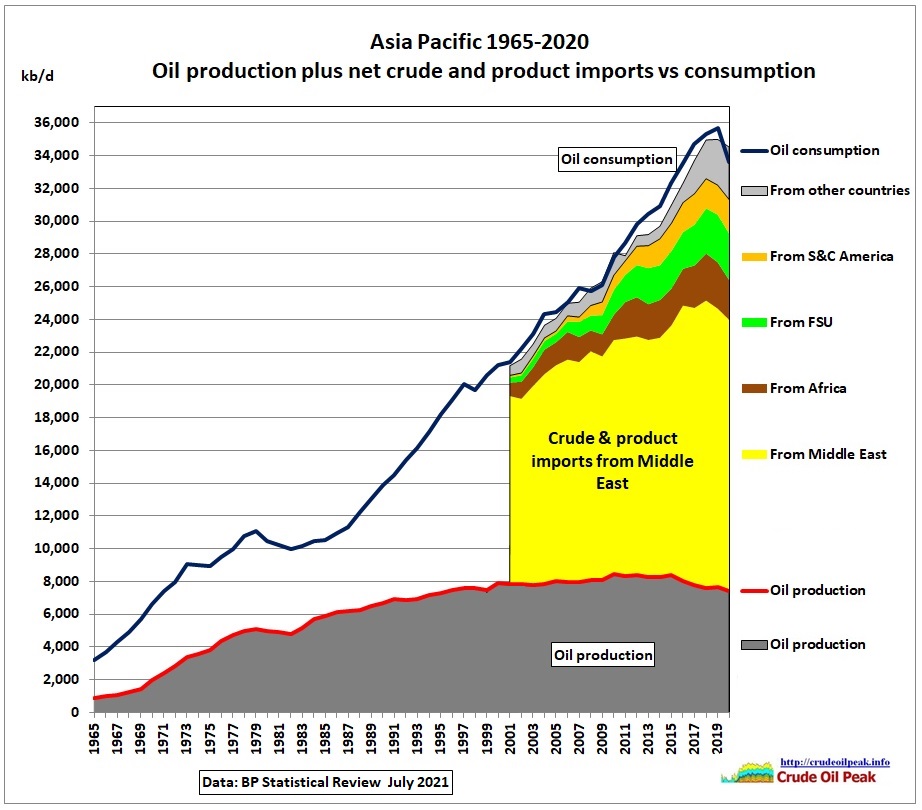 Fig 11: Asia Pacific oil imports have been diversified
There are obviously differences between the sum of production and net imports on one hand and consumption on the other.
Imports grew by an average 4.2% pa until 2018 when growth stalled. In 2020, imports dropped by 270 kb/d or 1%, although China managed to increase imports as shown in the previous post:
29/8/2021
China increased oil imports in Covid stricken 2020 by a lucky 8.8%
https://crudeoilpeak.info/china-increased-oil-imports-in-covid-stricken-2020-by-a-lucky-8-8
Asia Pacific’s dependency on the Middle East was reduced from 80% in 2006 to 60% in 2020.
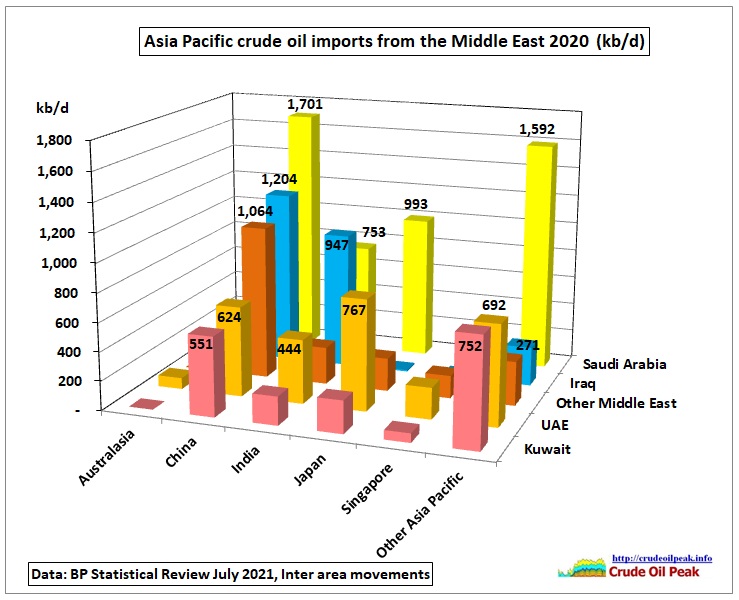 Fig 12: Asia Pacific crude oil imports from the Middle East
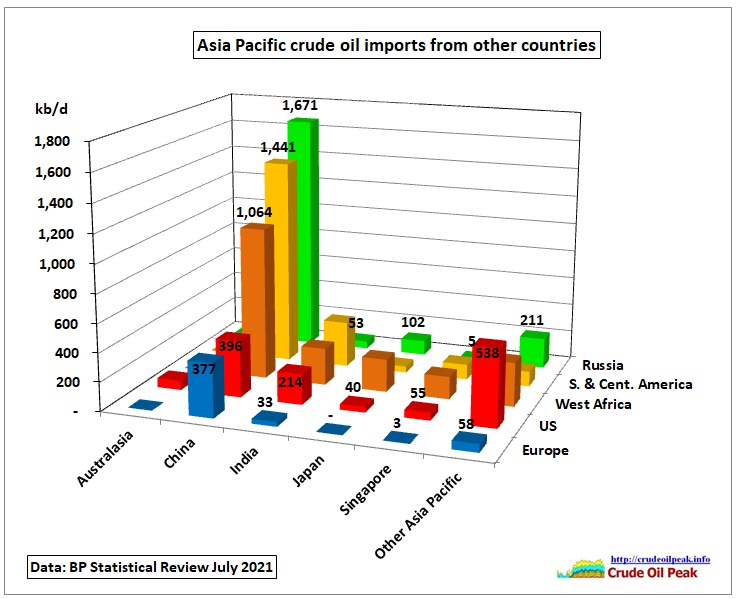 Fig 13: Asia Pacific crude imports from other countries
Country production peaks
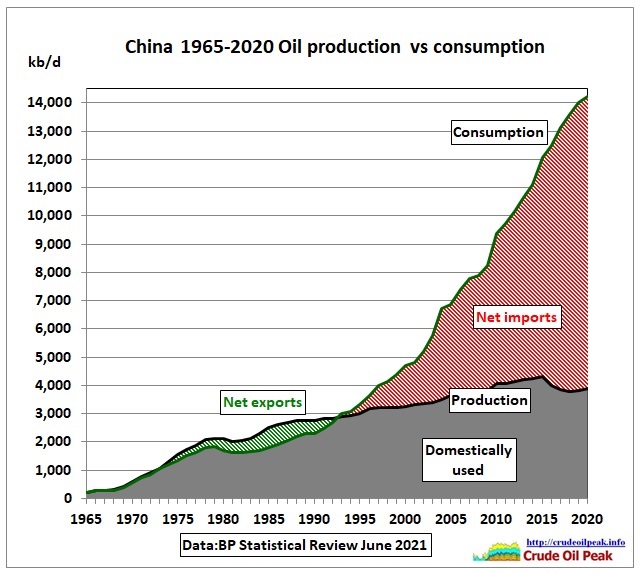 Fig 14: China
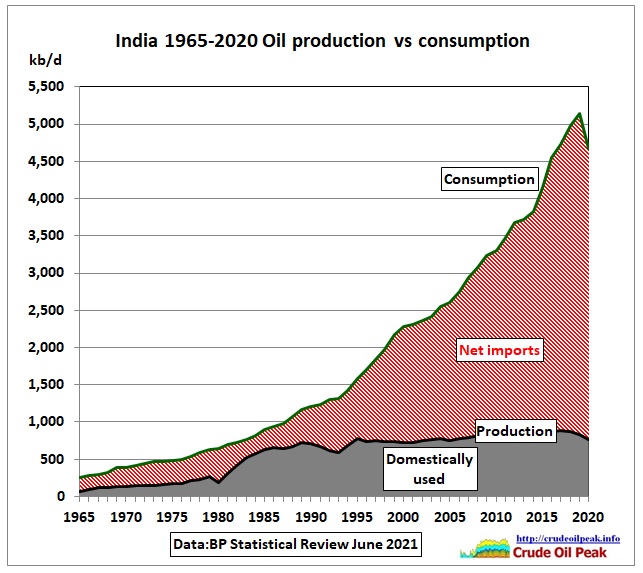 Fig 15: India
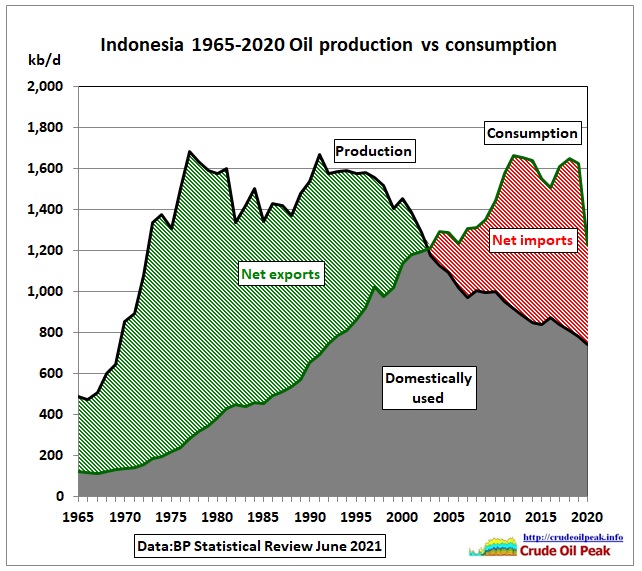 Fig 16: Indonesia
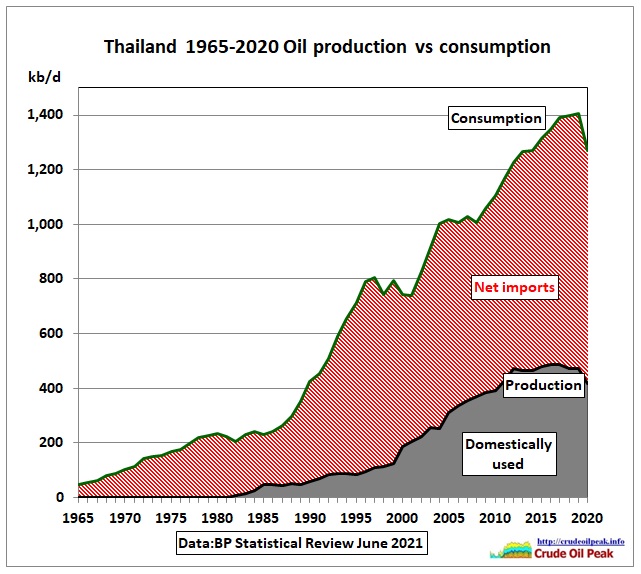 Fig 17: Thailand
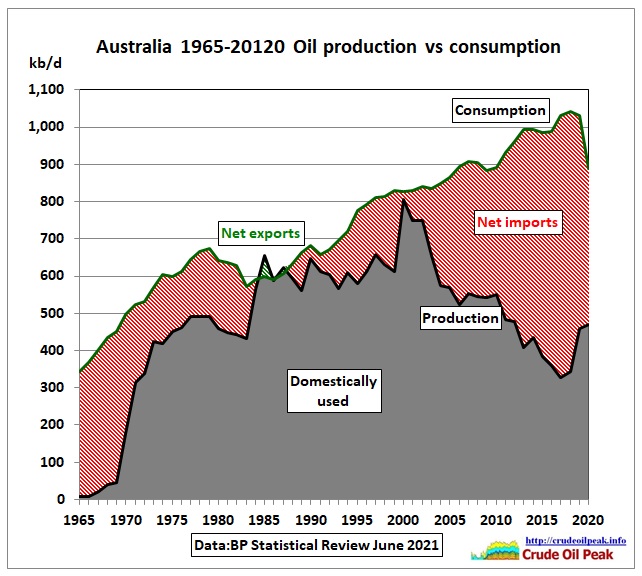 Fig 18: Australia
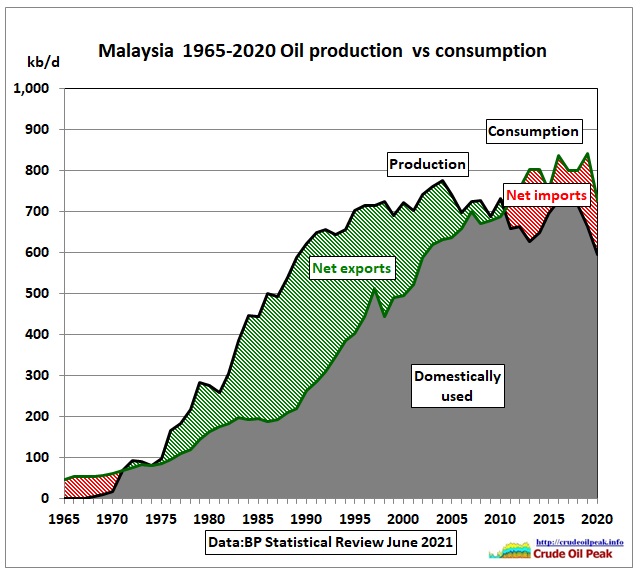 Fig 19: Malaysia
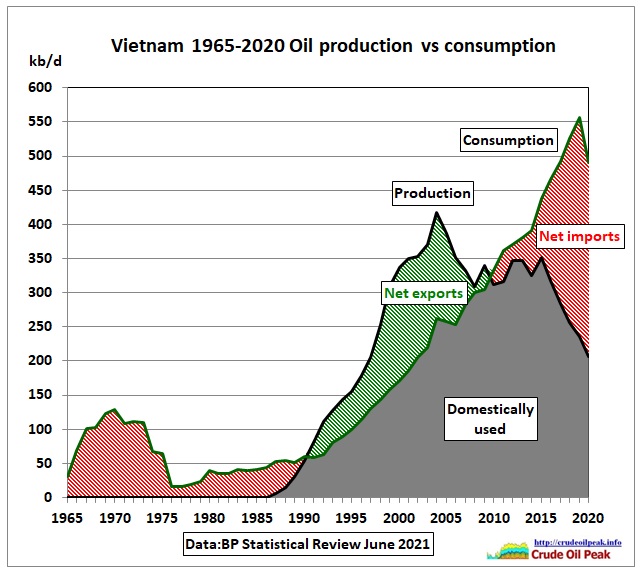 Fig 20: Vietnam
Conclusion
Asia’s Covid induced 2020 oil production drop was – in percentage terms – 10 times bigger than the drop during the oil price shock year of 2008. Production decline, however, was in line with the average of previous years, irrespective of what demand was doing.