This post turns information given to the media into easily understandable time line graphs. It includes implied and inconvenient facts the Energy Minister did not mention in:
Press conference – Sydney
Transcript
Saturday 16 May 2026
Chris Bowen:
“And as a total, the 6.2 billion litres we have on hand is more than at any time since 2023. So, as the PM said, this is a result of government and private sector working so closely together in the most difficult international circumstances for energy and oil ever, to ensure that Australia is well stocked. We have 52 ships on the water on their way to Australia, and we have 3.8 billion litres locked in, contracted to be delivered over the next four weeks. That’s 2 billion litres of diesel, 760 million litres of petrol, 326 million litres of jet fuel and 648 million litres of crude oil. In addition, as the PM said yesterday, we were able to announce another 150 million litres of Export Finance Australia supported additional buffer cargoes”
https://www.pm.gov.au/media/press-conference-sydney-16-may-26
Let’s go through these statements:
(1a) “3.8 bn litres locked in” in a time plot:
This number is without orders supported by Export Finance Australia (EFA), also called “extra” orders by the Minister for Energy. The exact number is 3,734 ML.
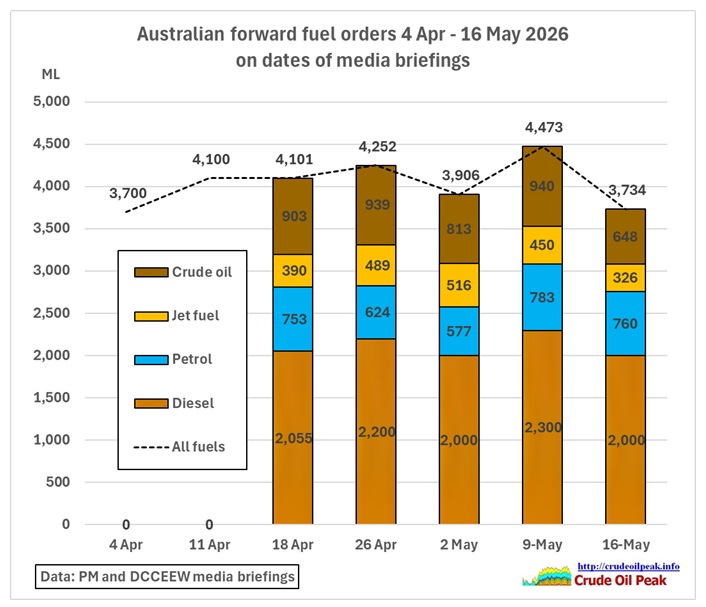 Fig 1: Forward fuel orders since they were made public, w/o extra orders
All types of fuels and crude oil dropped in the last week, together by 17%.
(1b) 52 ships on the water
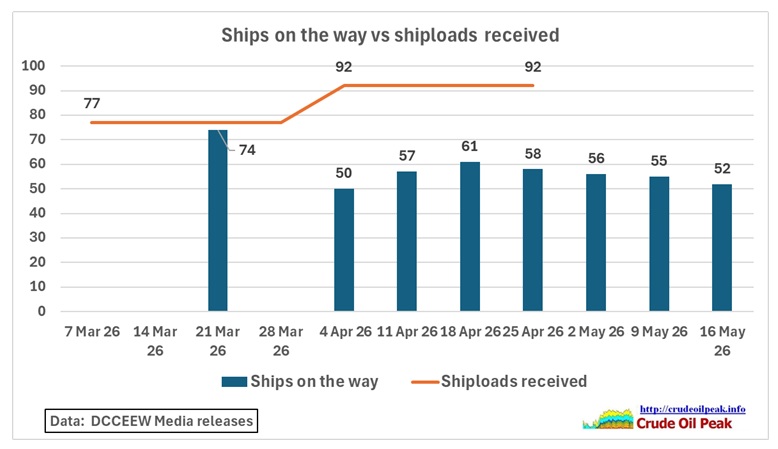 Fig 2: Ships on the water
As we can see ships on the water for the next 4 weeks have dropped from 61 on 18 Apr. If we divide the 3,734 ML “locked in’ by the ships on water we get 3,734/52 = 72 ML/ship, a bit higher what can be found for Sydney for April/May: 10 AFRAMAX (LR2) and 30 Medium range tankers will give an appr. average of (10×100 ML + 30x50ML)/40 = 62 ML
Tankers arriving and departing in Sydney
https://crudeoilpeak.info/tankers-arriving-and-departing-in-sydney
(1c) “another 150 million litres of Export Finance Australia supported additional buffer cargoes”
Joint media release: Three additional ships of diesel headed to South Australia, Tasmania, Victoria and Queensland
15 May 2026
The Albanese Labor Government has secured approximately 150 million litres, or 900,000 barrels, of additional diesel in three new shipments through partnerships with Ampol, Viva and regional supplier IOR.
These three new fuel shipments are heading to South Australia, Tasmania, Queensland and Victoria, helping get fuel to where it’s needed most, and increasing the distribution spread of additional supplies across the country.
https://minister.dcceew.gov.au/bowen/media-releases/joint-media-release-three-additional-ships-diesel-headed-south-australia-tasmania-victoria-and-queensland
Let’s add the extra orders to Fig 1:
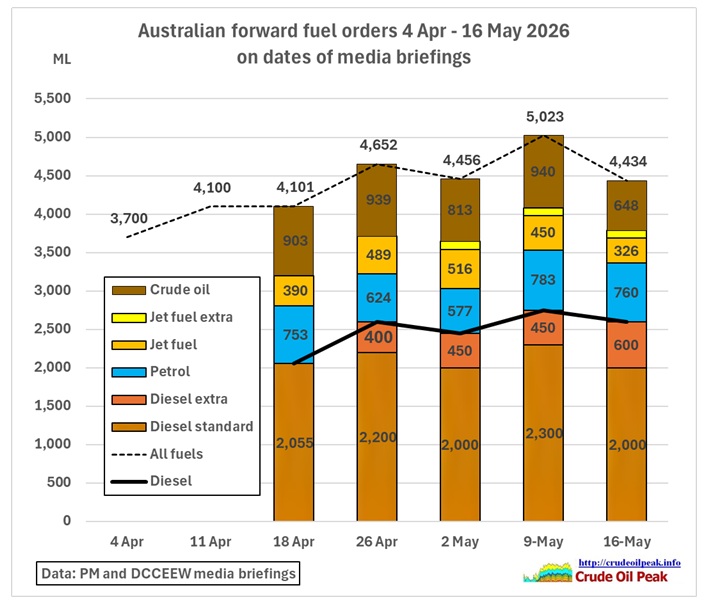 Fig 3: Forward orders including “extra” orders
Was that a peak on 9 May? Less crude oil needed because of repairs of the Geelong refinery after the fire? Or is it getting harder to import crude from alternative suppliers like Argentina? The Minister did not give any explanation, nor did any journo ask. The media had moved on to other topics like budget, tax policies and Trump’s visit to China
We see that the extra orders have lifted orders well above the 4,100 ML level achieved in mid-April. But the overall drop was still 12% in one week.
(2) most difficult international circumstances
This drop is not good news as some analysts are predicting that crunch time will start in June, based on JP Morgan’s research (which started off in April with a publication titled “Illusion of Plenty: JPMorgan Explains Why Hormuz Will Reopen By September… One Way Or Another”)
Why June Is the Oil Market’s Point of No Return
11 May, 2026
By Willima Usher, former CIA officer
At the start of 2026, the world held approximately 8.4 billion barrels of oil and oil products — a number that sounds reassuring until you examine what’s actually usable. According to JP Morgan’s analysis, only around 800 million barrels of that stockpile can be drawn without pushing the physical system into what they call “operational stress.” Roughly 35 percent of that accessible buffer had already been consumed by late April.
https://www.thecipherbrief.com/why-june-is-the-oil-markets-point-of-no-return
An oil geologist in Houston, Texas published this graph on the withdrawal of the US SPR:
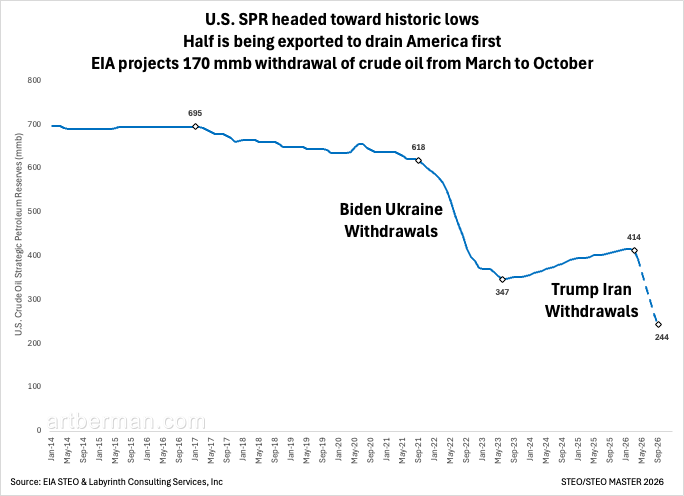 Fig 4: Decline of the US Strategic Petroleum Reserve (dated 12 May 2026)
414 mb in Feb 2026 and 244 mb in August 2026
The STEO MASTER is here: https://www.eia.gov/outlooks/steo/data/browser/ with the SPR data in the last row in the table 4a
The Short Term Energy Outlook (STEO) is here: https://www.eia.gov/outlooks/steo/ with an archive https://www.eia.gov/outlooks/steo/outlook.php, published monthly
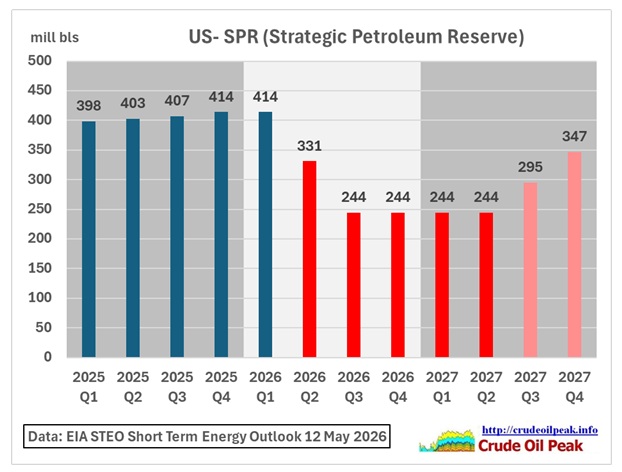 Fig 5: EIA SPR own colours: blue (actual), red (decline – 40%), pink (recovery)
The EIA assumes that the Strait of Hormuz will remain effectively closed until late May 2026, with shipping traffic slowly starting to resume in June 2026, obviously an optimistic scenario.
(3) “6.2 billion litres on hand”
These are the dark green columns in the weekly MSO chart
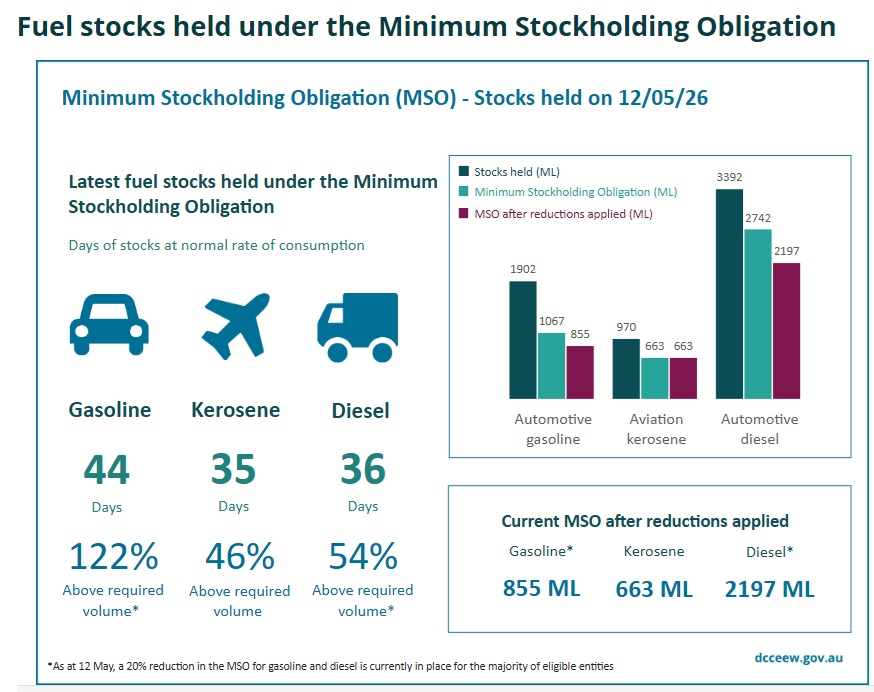 Fig 6: MSO chart for 12 May 26 published on 16 May 26
Note the MSO website does not have an archive of previous MSO tables. This crude oil peak website keeps track of these tables (see Fig 9 below)
The daily cover exists only in theory (total withdrawal of stock). The real number of interest is the number of days available using the operational stock, i.e. the stock above the mandated minimum stockholding obligation. That is shown in the following table:
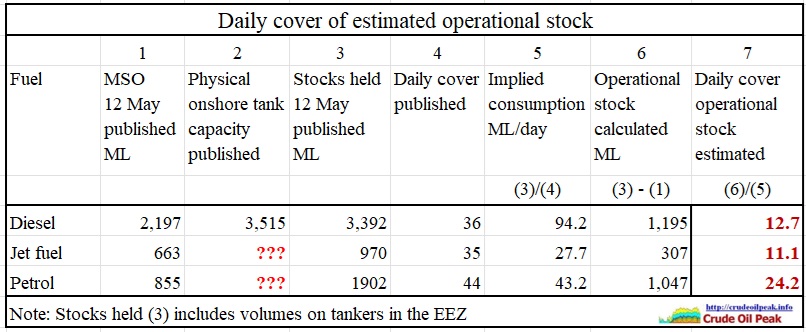 Fig 7: Daily cover of estimated operational stock
So for diesel it is 12.7 days until the MSO is hit. The methodology is similar to the “accessible” oil in the JP Morgan article.
The Australian petroleum Statistics (APS) have just come out with the March 2026 data
https://www.energy.gov.au/publications/australian-petroleum-statistics-2026
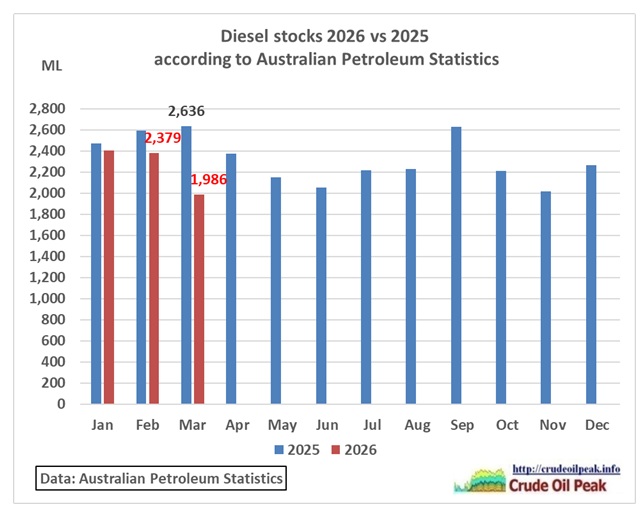 Fig 8: Diesel stocks in Australian Petroleum Statistics
As was to be expected, stocks in March were down, -393 ML from February 2026 and -650 ML from March 2025. Let’s put that into a timeline graph:
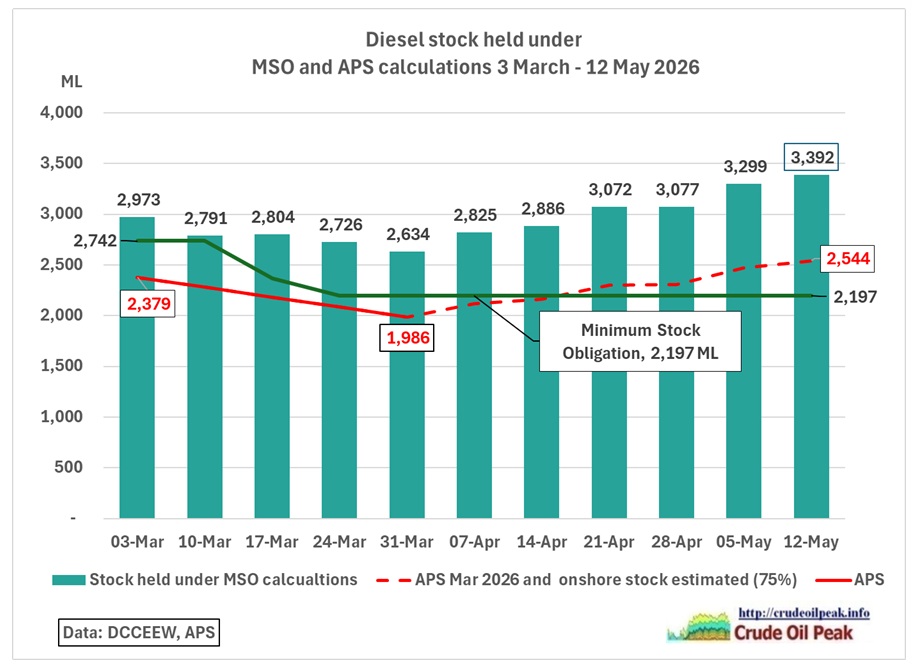 Fig 9: Timeline of diesel stock held vs estimated onshore stocks
At end February 26 diesel stock in the APS (onshore and at ports) were 20% lower than the stocks held in MSO statistics (including the EEZ). End March the percentage was 25%. We therefore add a corresponding onshore line (dashed). Compared to the previous month (2,639 ML), onshore stock has dropped by appr. 100 ML.
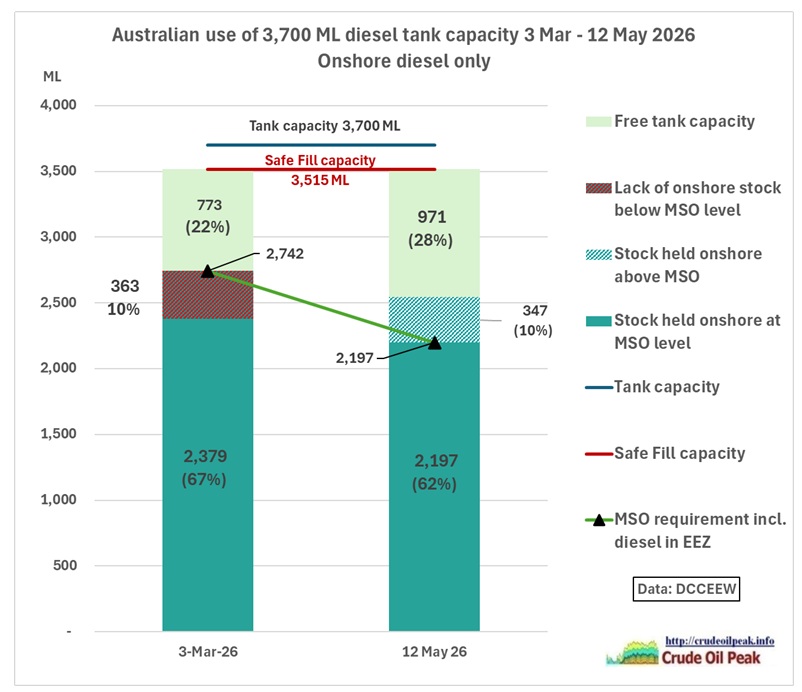 Fig 10: This graph highlights the changes since beginning of March 26
Conclusion:
The Energy Minister must fundamentally improve the information he is giving to the public on fuel otherwise complacency sets in (as can be seen from the lack of media questions)
(a) Archive previous versions of the MSO website
(b) Include crude oil in the MSO graph
(c) Calculate consumption by fuel
(d) Give numbers on stock in onshore tank farms
(e) Calculate operational volumes in onshore tanks
(f) Inform about physical capacity of onshore tank farms of jet fuel and petrol
(g) Analyse trends for stock hitting MSO levels, by fuel
(h) Relate the volume of fuels on order to the number of tankers on the way
(i) Estimate inventories in countries from which Australia imports crude and fuel including 3 scenarios