UK has actually more important problems to solve than the planned Brexit and this is the exit of their oil and gas industry over the years to come. This is not a voluntary exit; it is forced on the economy by the laws of oil depletion which governments are still in denial of.
The Brent oil field is the symbol of the decline:
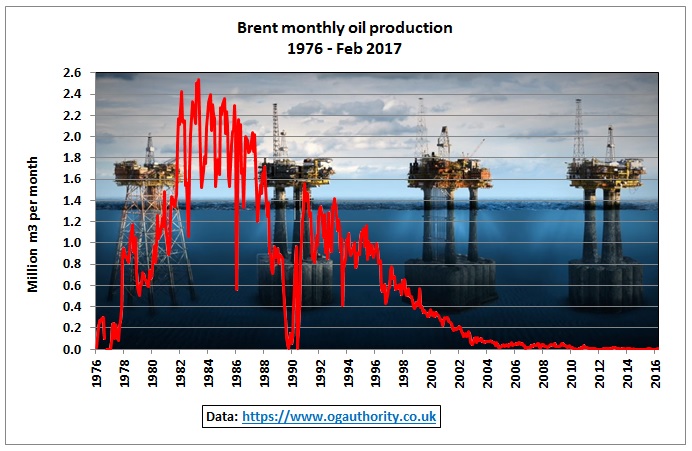
Fig 1: Brent oil production history
Brent’s 4 platforms Alpha, Bravo, Charlie and Delta (left to right in Fig 1) are now being decommissioned, a process taking 10 years, at huge, unavoidable cost to customers and shareholders of Shell as well as to taxpayers because decommissioning costs can be deducted from previous tax payments.
http://www.shell.co.uk/sustainability/decommissioning/brent-field-decommissioning.html
The following graphs show what has to be removed or decommissioned:
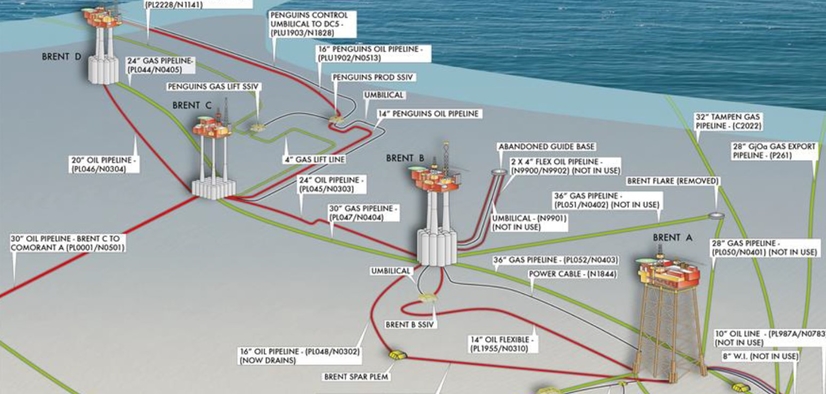 Fig 2: Brent platforms
https://www.desmog.uk/2017/02/16/Shell-Exxon-Brent-Decommission-Industry-Impact-Very-End
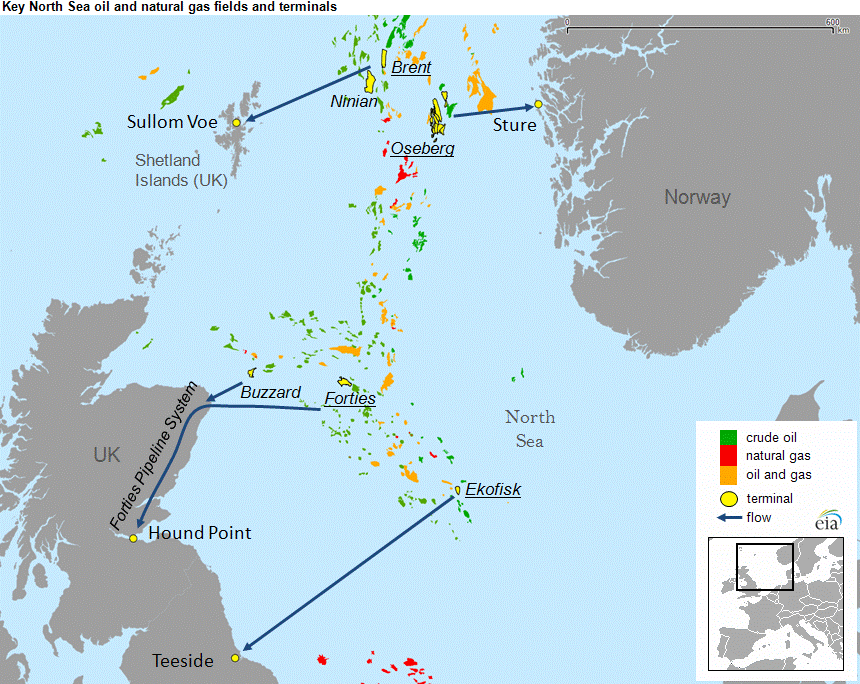 Fig 3: Location of Brent and other fields
https://www.eia.gov/todayinenergy/detail.php?id=12751
From the above map and the following graph with many oil fields we can see the gigantic task ahead.
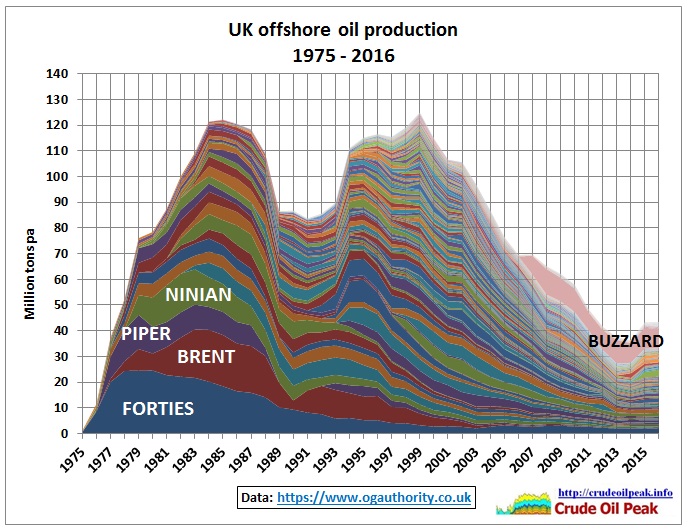 Fig 4: UK offshore oil production by field
https://www.ogauthority.co.uk/data-centre/data-downloads-and-publications/production-data/
There are 2 discovery phases which created 2 peaks (see also Fig 12). The first peak was the giant oil fields peak in 1985. In 1988 the Piper Alpha accident forced the redesign of many platforms resulting in a delay to bring oil fields of the 2nd phase into production. These created the second peak in 1999, just when the Irish oil geologist Colin Campbell warned about peak oil in an all parties committee of the House of Commons.
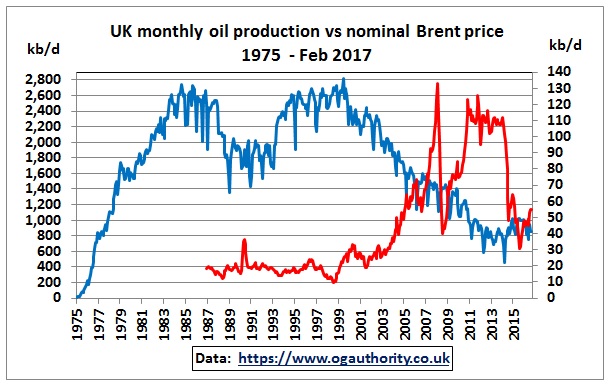 Fig 5: UK monthly oil production vs Brent oil price (nominal)
In 1975 UK production started to fight off the growing influence of OPEC after the embargo in 1973, triggered by the Jom Kippur war and exacerbated by the 1970 peak in US oil production. We can see that UK produced most of its oil when nominal oil prices were comparatively low. The decline after the 2nd peak was cushioned by increasing oil prices. The 2014 fall in oil prices (the world cannot afford $100 oil) is a double whammy.
The profitability of the oil and gas industry depends on price, production and costs. The industry body Oil and Gas UK has calculated in its 2016 report the post-tax cash flows since 1970:
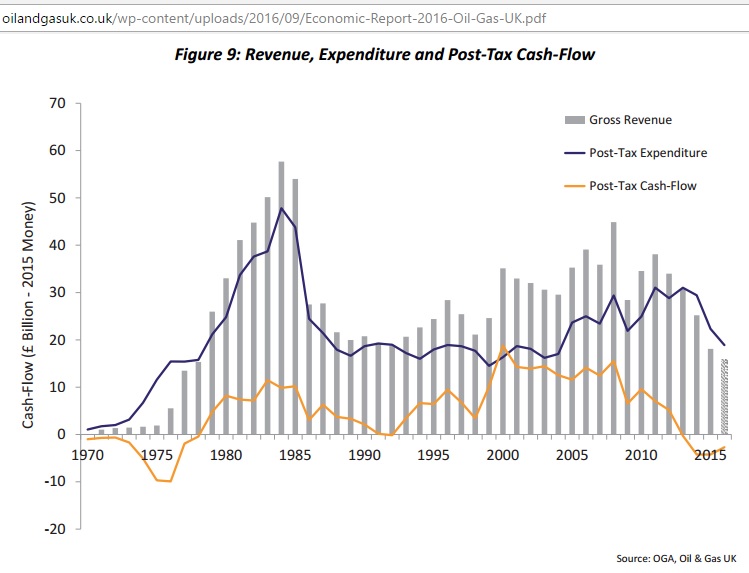 Fig 6: Profitability of UK oil and gas sector
http://oilandgasuk.co.uk/wp-content/uploads/2016/09/Economic-Report-2016-Oil-Gas-UK.pdf
Note the cash flow has gone negative in the last 2 years. The report explains:
“When existing operations are generating marginal, if any, returns for investors, the prospect of raising further capital to invest in new projects is extremely difficult, as shown by the lack of new commitments this year (see section 5.3). This has caused a knock-on effect on profitability throughout the supply chain as projects are postponed or cancelled”
Chapter 5.3 describes the following graph (Fig 7):
“With most potential new developments requiring a break-even oil price in excess of $50/bbl, companies are re-evaluating development concepts to achieve significant cost savings before committing to new projects. This project slippage may present some upside on the forecast towards the end of the decade but only if market conditions improve.”
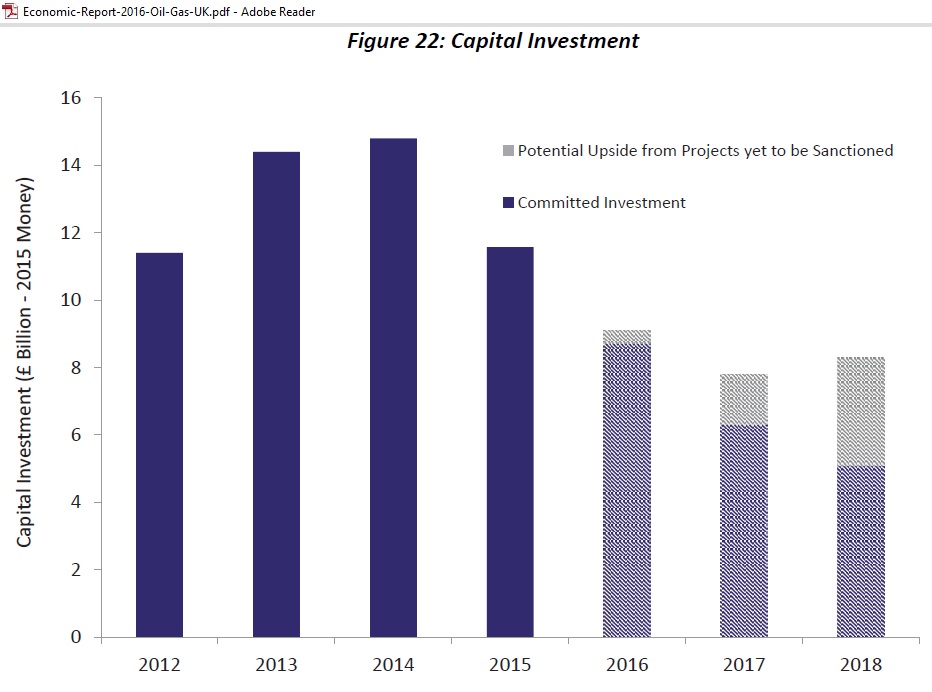 Fig 7: UK’s drop in CAPEX
…and concludes:
“The lack of discretionary capital investment being committed to the UK is perhaps the biggest threat to the long-term future of the basin, as it has the potential to accelerate abandonment of infrastructure and diminish the scale of the UK’s supply chain. If no new investments are secured over the next few years, investment will fall to as low as £2 billion per year by 2020.”
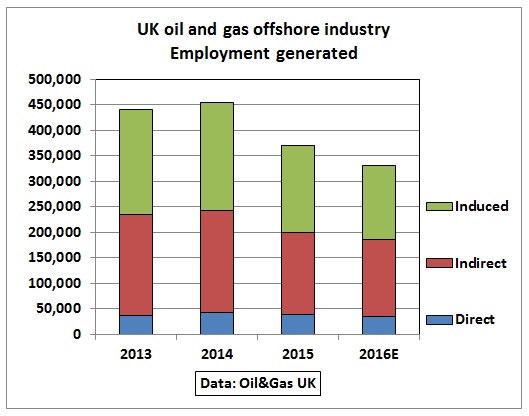 Fig 8: Drop in employment
The combination of low oil prices and declining CAPEX resulted in job losses, mainly by secondary flow-on effects in the economy. This of course contributes to the dissatisfaction of voters which has impacted on elections.
Financial impact of Brexit
No wonder that the oil and gas industry body has already calculated the cost of Brexit and asked the UK government to minimise the negative impact:
On trade costs, the data shows that:
- Around £73 billion worth of oil and gas related trade (fuel and non-fuel) flows between the UK and the rest of world
- Approximately £61 billion of this is related to traded goods, which may be subject to tariffs (services account for the remaining £12 billion)
- Under the current ‘status-quo’ scenario with the UK as part of the EU, the total cost of this trade in goods is around £600 million per annum (less than 2% of the total value of trade subject to tariffs)
- Under a worst-case scenario where the UK reverts to WTO rules with the EU and the rest of the world, the likely cost of trade will almost double to around £1.1 billion per annum; assuming trading behaviours remain unchanged
- If the UK can negotiate minimal tariffs with the EU and improved tariffs with the rest of the world, the total cost of trade could fall by around £100 million per annum to £500 million
On labour movement, the data shows:
- Of those directly employed by the oil and gas industry in the UK, 90% are UK national, 5% are EU workers from countries other than the UK and 5% are non-EU
- Around 70% of the EU workers in the industry are skilled, with one in two holding managerial roles
- Oil & Gas UK understands that these skilled roles filled by EU workers are often critical for projects and asks Government to consider these posts when developing domestic immigration policy.
http://oilandgasuk.co.uk/brexit-and-the-uk-oil-and-gas-industry/
The financial performance of oil companies has implications for government revenue:
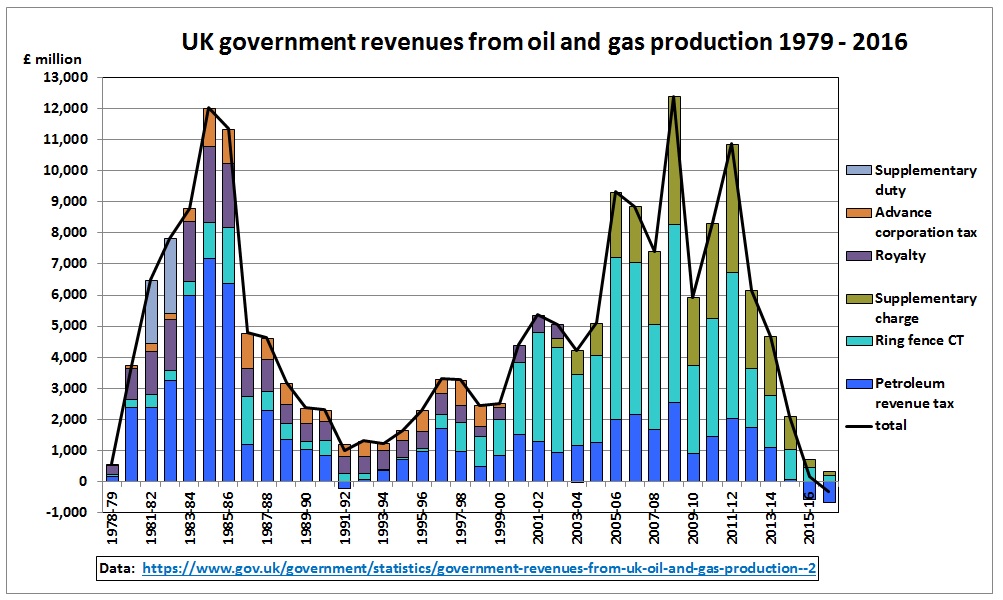 Fig 9: UK government tax revenue from oil and gas (table 11.11)
https://www.gov.uk/government/uploads/system/uploads/attachment_data/file/615519/Table_11.11__May_2017_.pdf
https://www.gov.uk/government/statistics/government-revenues-from-uk-oil-and-gas-production–2
We can see that the petroleum revenue tax declined rapidly after the mid 80s production peak. So other tax regimes had to be introduced. The ring fence prevents other activities and excessive interest payments being used to reduce tax from oil and gas activities. The increase in revenue after the 1999 production peak was caused by higher oil prices (see Fig 10). The 2014 oil price drop brought government revenues into negative territory (tax refund).
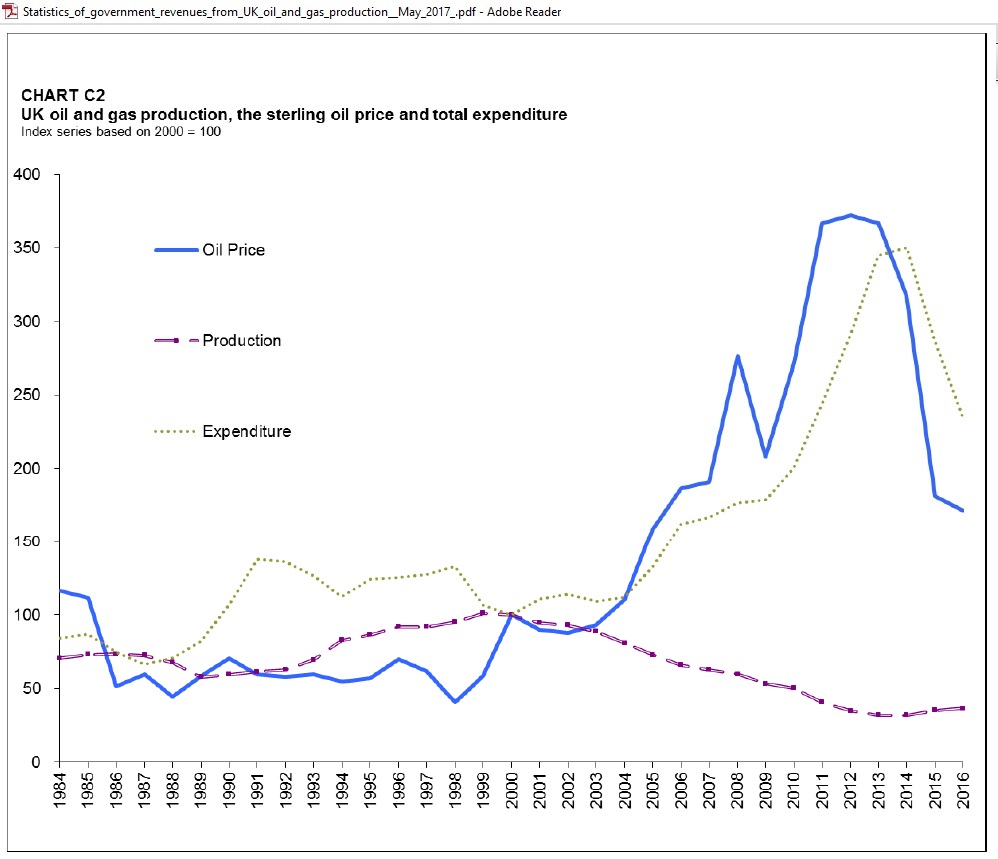 Fig 10: Expenditure and oil price correlation
Source: UK government statistics
The latest forecast of the Budget Responsibility Office (March 2017) has revenue slightly above zero (less than 01 % of GDP). The good times are over.
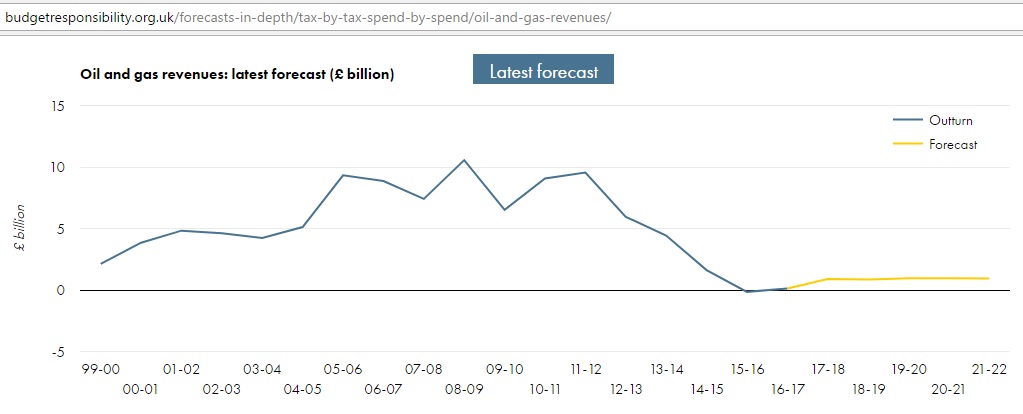
Fig 11: Revenue history and projections
http://budgetresponsibility.org.uk/forecasts-in-depth/tax-by-tax-spend-by-spend/oil-and-gas-revenues/
The above oil and gas revenues consist of offshore corporation tax – which includes ‘ring fence’ corporation tax (30%) and the supplementary charge (10 %) – and petroleum revenue tax (set to zero in Jan 2016).
Oil Reserves and Resources
French oil geologist Jean Laherrere from ASPO France responded to Michael Lynch’s book “The peak oil scare and the coming oil flood” by debunking his criticism in a paper titled “Michael Lynch on my estimates of UK oil fields” (April 2017).
UK production followed a discovery curve shifted by 12 years:
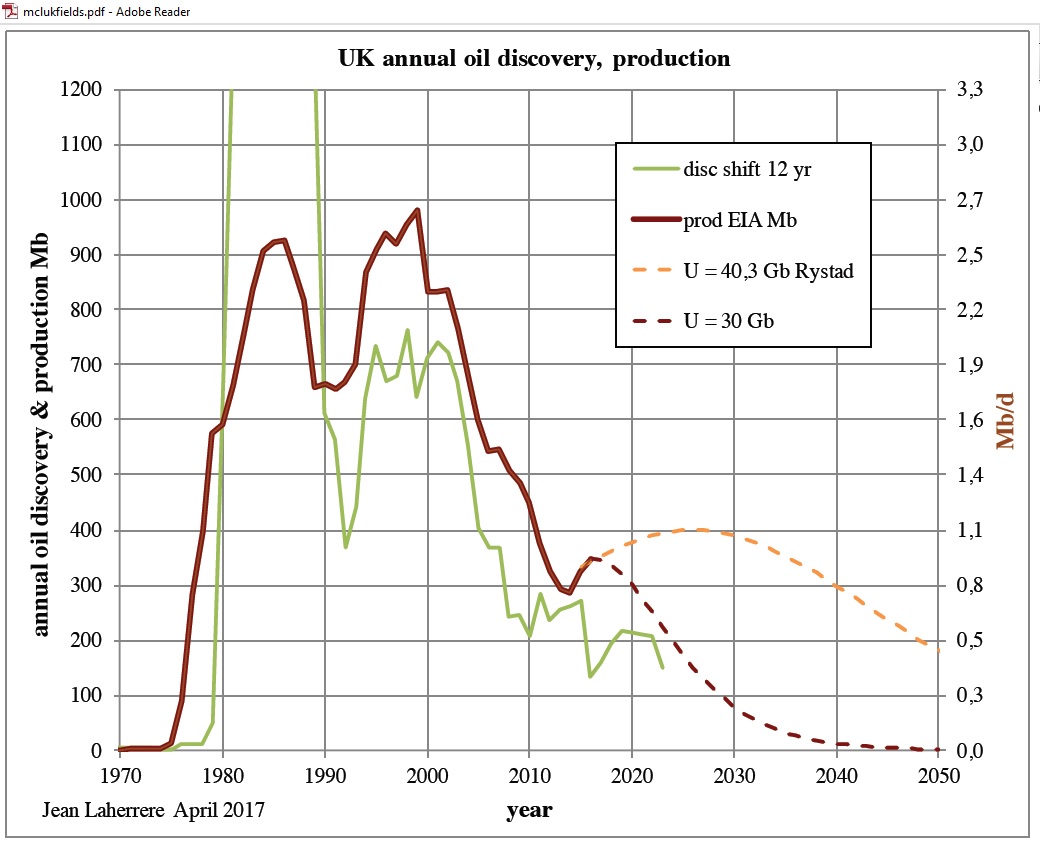 Fig 12: Laherrere’s production curves
https://aspofrance.files.wordpress.com/2017/04/mclukfields.pdf
Jean used a Hubbert linearization for the period 1999-2016 to calculate an ultimate of 30 Gb, giving a production decline curve as shown in Fig 12 (dark brown dashed curve). This number is in line with the proven ultimate in following table.
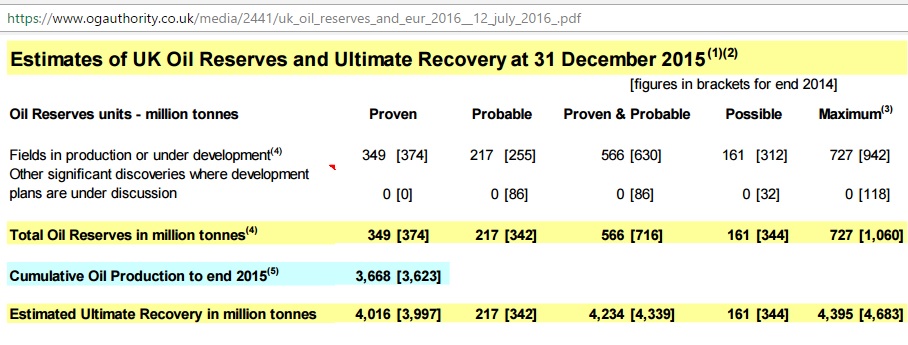
Fig 13: Oil reserves and resources from the Oil and Gas Authority
https://www.ogauthority.co.uk/data-centre/data-downloads-and-publications/reserves-and-resources/
https://www.ogauthority.co.uk/media/2441/uk_oil_reserves_and_eur_2016__12_july_2016_.pdf
Using a conversion factor of 1 t=7.5 barrels we get as ultimate of proven reserves 4,016 mt x 7.5 = 30.1 Gb. The conversion factor is not an exact science as different types of oil have different densities. So there is some plus and minus. Note the depletion level end 2015 was 3,668/4,016 = 91.3% for proven reserves and the possible maximum 3,668/4,395 = 83%.
The above Fig 12 also contains a production curve (light brown dashed) based on the assumption of an ultimate of 40.3 Gb by Rystad (26.3 Gb cumulative end 2015 plus 14 Gb of 2PCX – defined as “most likely estimate for existing fields, discoveries and undiscovered fields”). This will only materialize if oil prices are high enough. There is a big question mark about the affordability of such oil.
Let’s have a look at government projections:
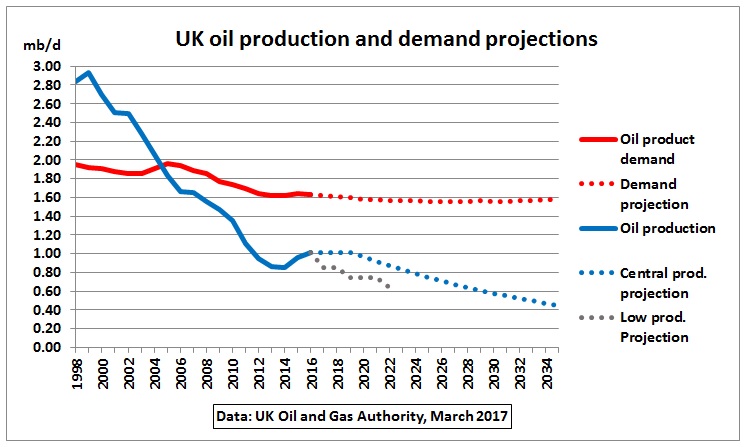
Fig 14: UK’s Oil and Gas Authority projections, 5% pa decline after 2020
https://www.ogauthority.co.uk/data-centre/data-downloads-and-publications/production-projections/
https://www.ogauthority.co.uk/media/3479/oga-production-projections-february-2017-v2.pdf
The area under the dotted blue line represents 5.4 Gb. This volume is higher than Laherrere’s estimate, higher than the proved reserves given in BP’s Statistical Review of 2.8 Gb and also higher than Rystad’s 2P reserves of 4 Gb.
UK oil imports
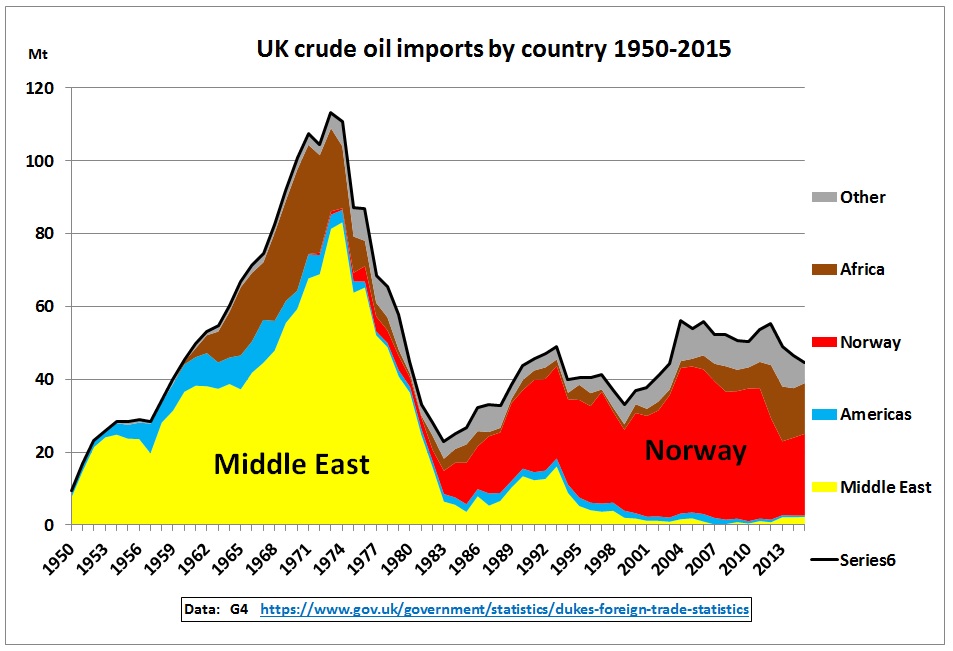 Fig 15: UK crude imports by country of origin
When UK oil production rose steeply in the 70s, imports from the Middle East decreased accordingly. Norway’s production has also peaked. UK is lucky that Norway’s population is small.
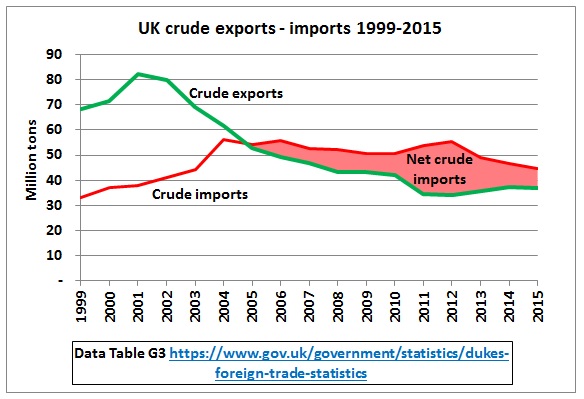 Fig 16: UK’s crude imports and exports
UK is a net importer of crude oil for 10 years now.
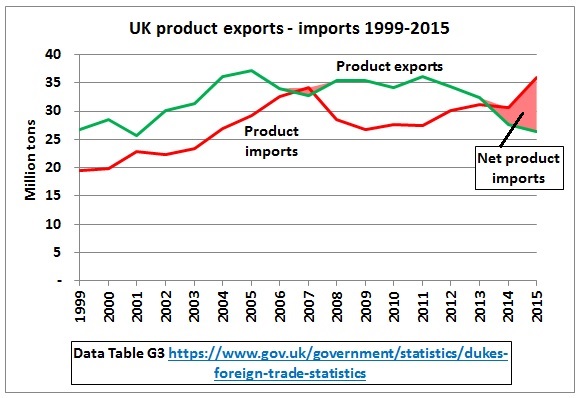 Fig 17: UK oil product imports and exports
https://www.gov.uk/government/statistics/dukes-foreign-trade-statistics#history
Product imports are also exceeding exports for the last 2 years.
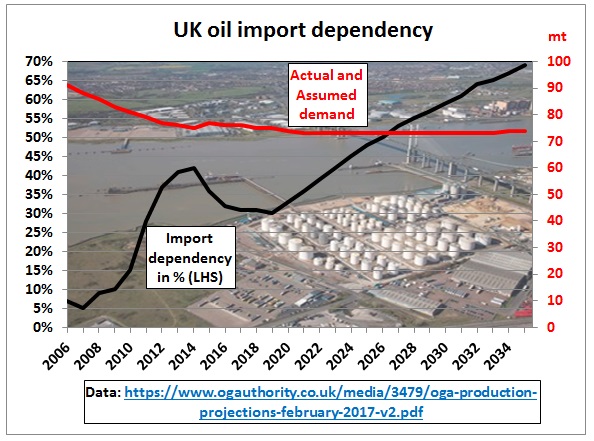 Fig 18: UK oil import dependency and demand assumption
The Oil and Gas Authority assumes in the above graph that oil demand will basically remain flat, i.e. it will not respond to increasing oil imports which puts pressure on the economy. If all net oil importers made the same assumption global production would have to substantially increase, leading to corresponding price rises.
Conclusion
UK is now a classical example for a country in an advanced post peak oil mode. Little research is done to analyse what changes are happening in the economy which are often subtle and covered up by other events. One country after the other will peak and go through similar processes, causing all sorts of country specific problems.
Related posts
26/9/2014 Scots lost out in UK oil and gas endgame
http://crudeoilpeak.info/scots-lost-out-in-uk-oil-and-gas-endgame
20/6/2011
UK government report in 2009 picked late peak oil scenario – and got it wrong
http://crudeoilpeak.info/uk-government-report-in-2009-picked-late-peak-oil-scenario-and-got-it-wrong