MSO =Minimum (Fuel) Stock Obligation
Summary list of questions
After last week’s MSO update a number of questions still remain open:
- An order of 3 cargos of jet fuel (100 ML) from China (19/5) has not been entered into the running total of EFA supported orders
- The running total of forward orders is not being reduced when orders become arrivals
- Continuing confusion about ships and shiploads
- Why is there no archive of weekly MSO related data including forward orders?
- Where are the fuel consumption data needed to understand days of stocks (cover)?
- Onshore/offshore data are missing
- Total onshore tank capacity for petrol and jet fuel
- Why are the numbers of arriving crude oil tankers not given?
Without these details no proper trend analysis can be done and therefore no estimate of tightening supplies.
Press conference, Fairfield West, New South Wales
[In front of the Minister’s electoral office, a low key event]
6 June 2026
Stocks
Energy Minister Bowen: “I’m very pleased to let Australians know that the situation continues to be that Australia has more fuel today, across all three major fuel types, than we did on the day Iran was bombed.”
https://minister.dcceew.gov.au/bowen/transcripts/press-conference-fairfield-west-new-south-wales-2
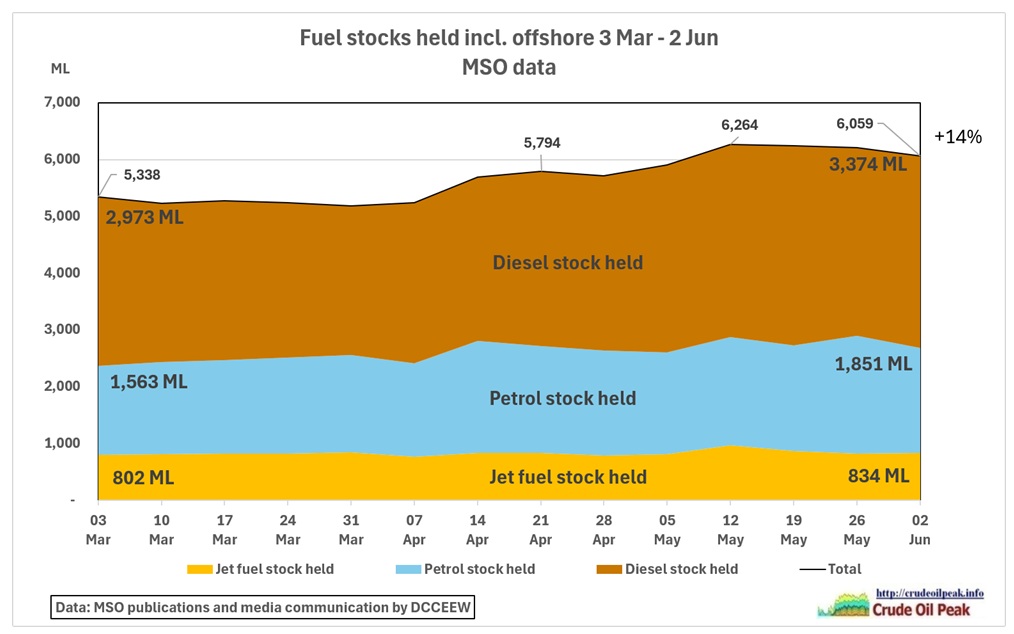 Fig 1: Fuel stocks have increased by 14% compared to 3 March
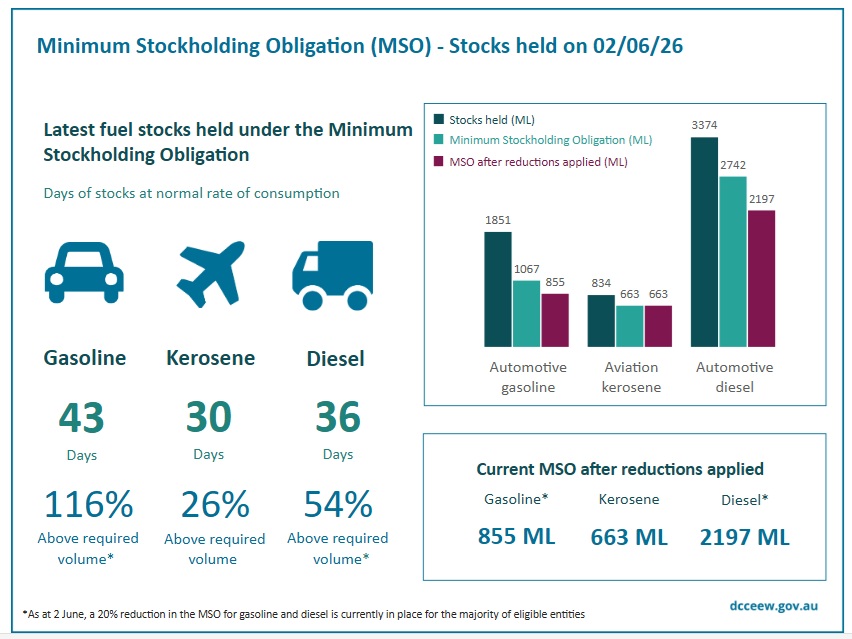 Fig 2: “Australia currently has 43 days’ worth of petrol, 36 days’ worth of diesel, and 30 days’ worth of jet fuel”
https://www.dcceew.gov.au/energy/security/australias-fuel-security/minimum-stockholding-obligation/statistics
The day counts don’t mean much because consumption is changing and is likely to change on a continuing basis depending on the oil price. The Minister did not mention how much of each fuel is in stock measured in ML but this of course is available on the above website, albeit for one week only, because this information will be overwritten next Saturday. There is also now an archive https://www.dcceew.gov.au/energy/security/australias-fuel-security/minimum-stockholding-obligation/statistics#download
but it is only on a quarterly basis, not even monthly like from the APS, so this is not suitable for finetuning and establishing trends over the coming weeks.
Crudeoilpeak maintains a time series:
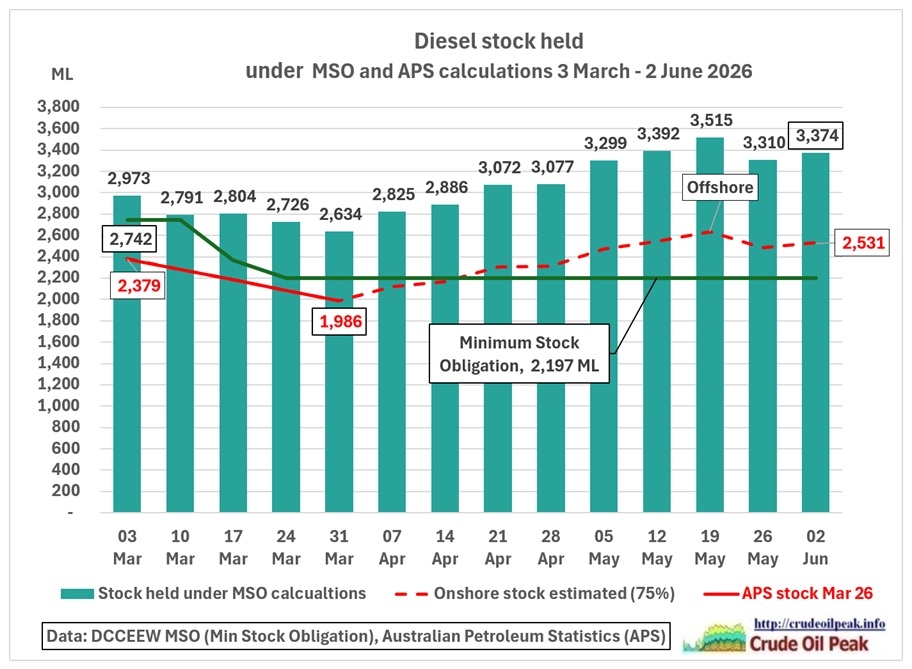 Fig 3: The stock includes offshore within the EEZ
The offshore share is estimated using APS data from February and March which do not include EEZ offshore. For diesel the offshore share is an estimated 25%.
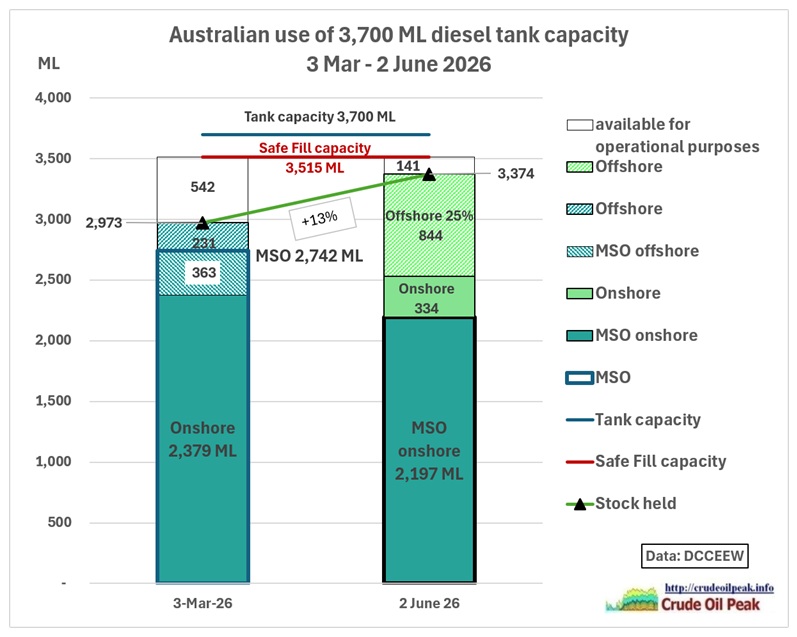 Fig 4: Graph showing the diesel changes between 3 Mar and 2 June
Note that onshore stock (readily pumpable) above MSO is 334 ML. If that were consumed (in about 3 days) and EEZ offshore diesel were still too far the MSO would have to be lowered again.
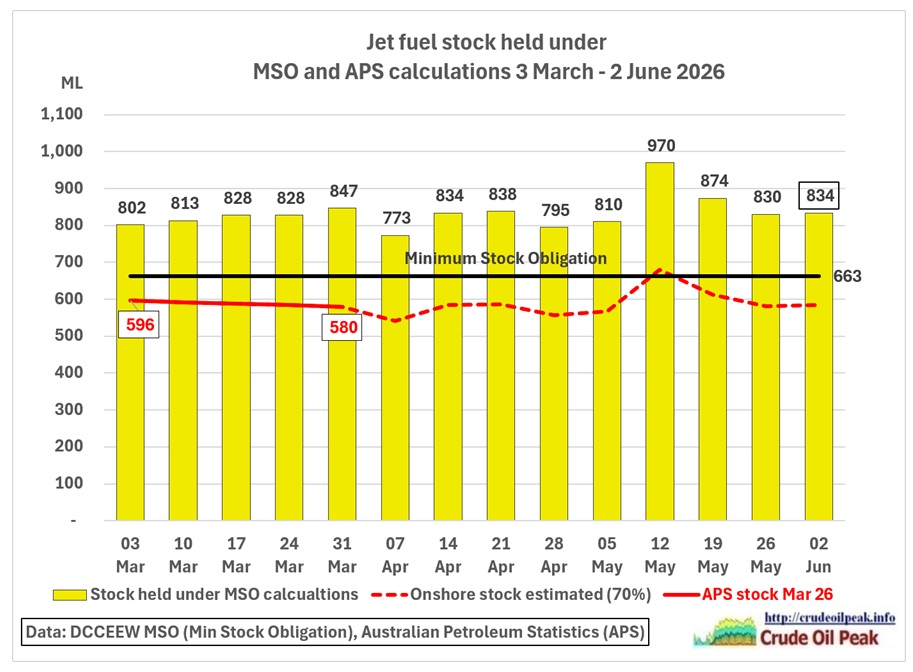 Fig 5: Jet fuel stock. The MSO requirement is above onshore stock (70%)
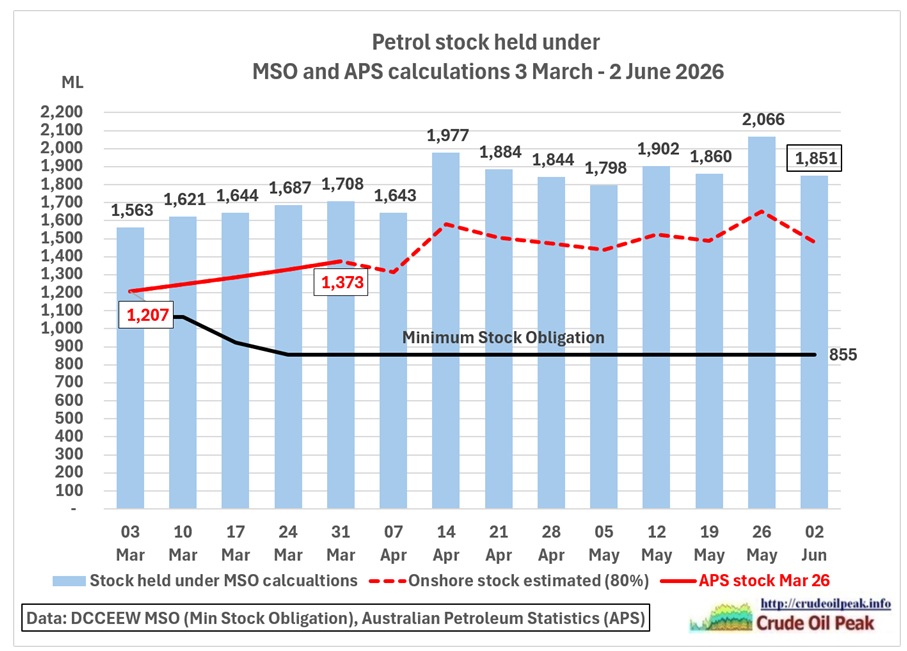 Fig 6: Petrol stock. The MSO requirement is below the onshore stock (80%)
Arrival of tankers
Bowen: “I’m also pleased to say, now that May is complete, that I can tell the Australian people that, while we have an average arrival number of ships of 81, over the course of May we had 92 ships arrive with fuel in Australia.
We have 50 ships on the water, on the way to Australia. This is pretty much in keeping with every update I’ve given now for several months. It’s roughly been between 46 and 53 ships or so on the way to Australia, and that is very much the case today.”
https://minister.dcceew.gov.au/bowen/transcripts/press-conference-fairfield-west-new-south-wales-2
 Fig 7: “Tankers on the way” vs “shiploads received”
The quote on what the ships on water mean is from a press conference dated 11 April.
Please note:
(a) Fig 7 is about fuels, not crude oil which is excluded here.
(b) The 2 sets of numbers are actually not directly comparable but the press releases put them into context. “Ships on the way” is a snapshot of the number of tankers carrying fuels – counted from leaving a port overseas to a berth at an Australian port. In contrast, “Shiploads received” is a cumulative number of past fuel discharge events over a month at Australian ports. One vessel can have 2 or more such off loadings (milk run along the coast), either with different fuels or the same fuel partially discharged at various ports. Each is counted separately, resulting in higher numbers for “shiploads received”
(c) The media briefings used “ships arrived“ and “shiploads received” interchangeably, thereby creating confusion
(d) It is strange that the number of discharge events is exactly the same for April and May. While this is possible it is highly unlikely. The number of tankers which produce these discharge events (with a changing time lag between 10 days and 4 weeks) varies from week to week and has gone down in May. Maybe the 92 number is an estimate or is a target to suggest to the public that everything is fine. Fig 7 considers the 92 number to be a rolling average of the last 4 weeks, the same period in which all ships on the way are expected to arrive.
Forward orders
Bowen: “We also have 3.5 billion litres of fuel locked in, contracted to be delivered over the next four weeks.
That consists of 1.8 billion litres of diesel, 512 million litres of petrol, 468 million litres of jet fuel, and 709 million litres of crude oil”
https://minister.dcceew.gov.au/bowen/transcripts/press-conference-fairfield-west-new-south-wales-2
Note that crude oil is included. We see here the lax use of words. Fuels are usually refined products, not crude oil. Let’s put these numbers into a timeline graph of forward orders:
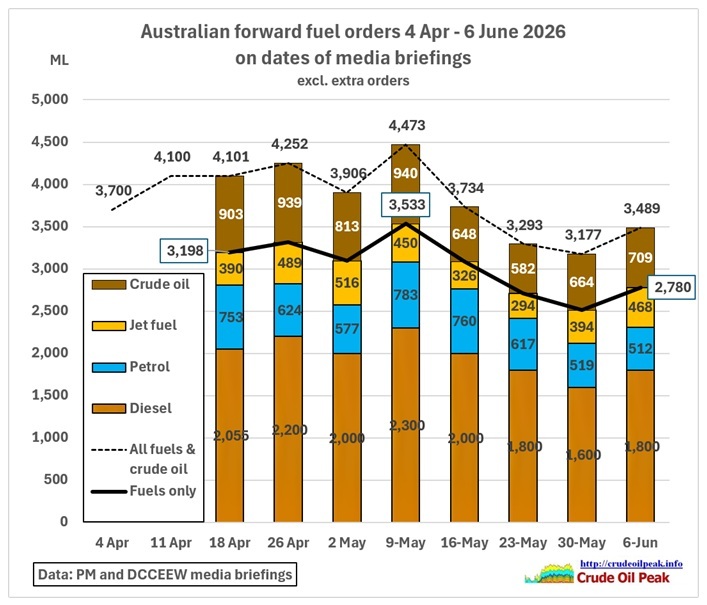 Fig 8: forward orders for fuels and crude oil
Note that fuels and crude oil are in the same graph. This has only been done so that the reader can see how the Minister’s 3.5 bn liters have been arrived at. The thick line adds the fuels and the order book stands at 2.8 bn liters. The correct way to add up these numbers would be to convert the crude oil into the refinery output (3 fuels) of the 2 remaining Australian refineries
We see that the forward orders have peaked on 9th of May. Although there was an uptick on 6 June, they are now lower than on 18th of April, when these statistics started.
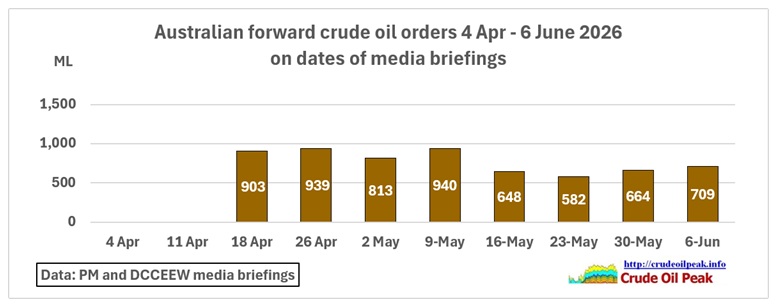 Fig 9: Forward crude oil orders
No new extra orders
No new extra orders were announced.
Crudeoilpeak has kept a record of these extra orders in a table (order book) and nothing has changed since 40 ML of diesel were ordered through Export Finance Australia on 30th of May
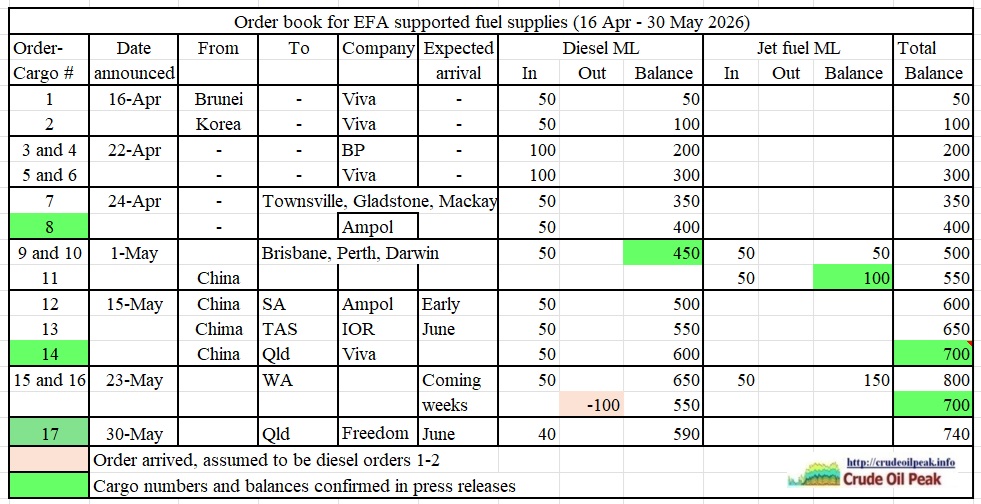 Fig 10: Order book of EFA supported orders remained unchanged
Note that the Minister deducted 100 ML of diesel from orders on 23 May because they had arrived. The Minister did not specify which orders exactly had arrived so it was assumed for this table that it was orders 1 and 2 from the 16th of April.
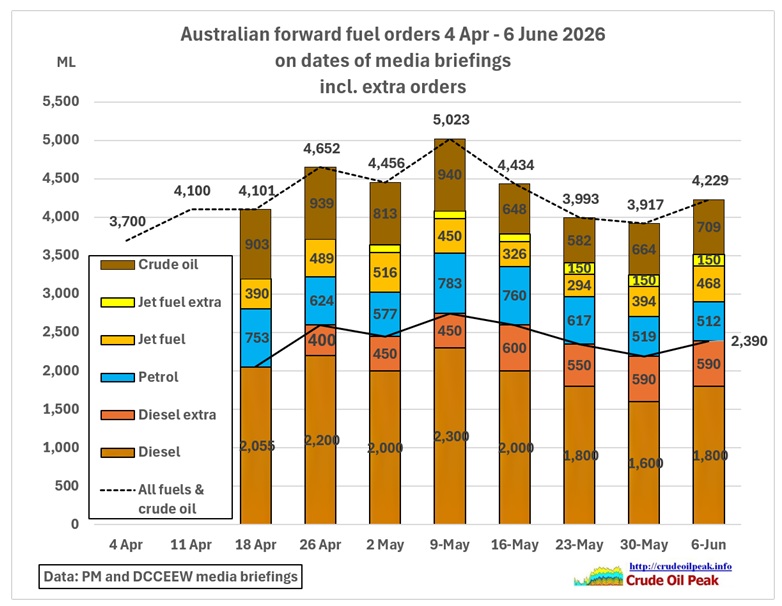 Fig 11: Forward orders including extra orders
That of course raises the question which other orders have arrived between May 23d and June 2nd. Has an extra order been disapproved by EFA in which case it would have to be reclassified as a normal order and the running total of extra orders to be reduced?
Conclusion:
Without an update of the cumulative total of forward extra orders (still assumed to be 150 ML jet fuel and 590 ML diesel = 740 ML) it is not possible to make a calculation of an expected difference to last year’s diesel imports.