28-29 November
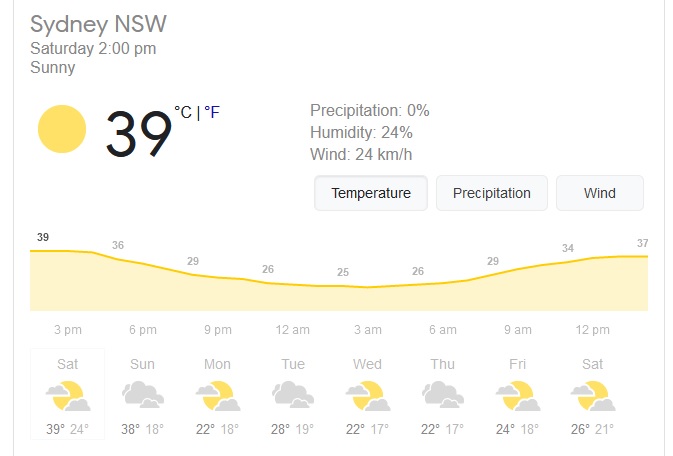 Fig 10: Temperatures in Sydney
(8) More Lack-of-reserve warnings
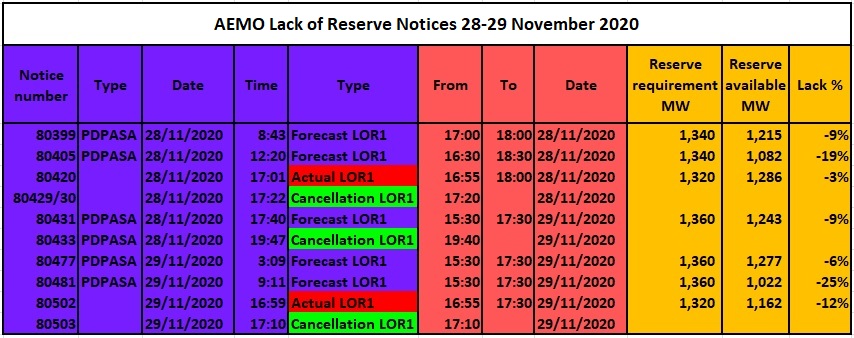 Fig 11: timeline of AEMO’s notices
The table shows the sequence of LOR notices for 28-29 Nov 2020 and their final cancellations without having gone to LOR2 levels. The lack of reserves ranged from -3% to -25%.
PDPASA: Pre-dispatch Projected Assessment of System Adequacy
STPASA: Sort term Projected Assessment of System Adequacy
(9) Price spike predictions 28 Nov 2020
In the following graph (3 panels) the price and demand on the top left relate to the vertical dotted line. The price and demand on the top right are for the next time period (+30 min)
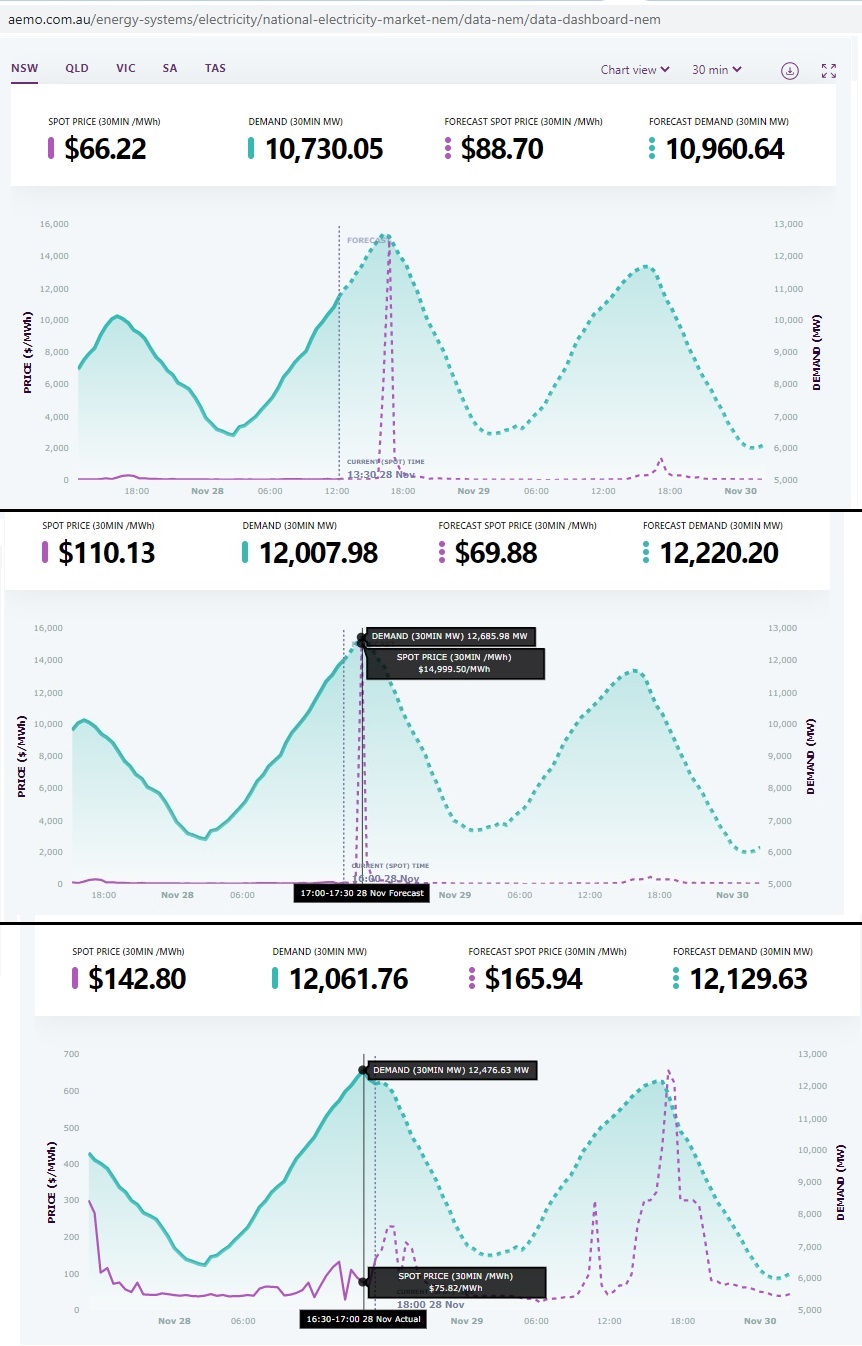 Fig 12: Price spike predictions 28 Nov 2020
Upper panel: at 13:30 a spot of $15,000/MWh was predicted for later in the afternoon with an estimated demand around 12,500 MW
Mid panel: that price was still estimated for a demand of 12,685 MW at 17:00,
Lower panel: spot price went down to $75/MWh for a maximum demand of 12,476 MW at 16:30
(10) NSW power supply peak 12.95 GW on 28 Nov 2020
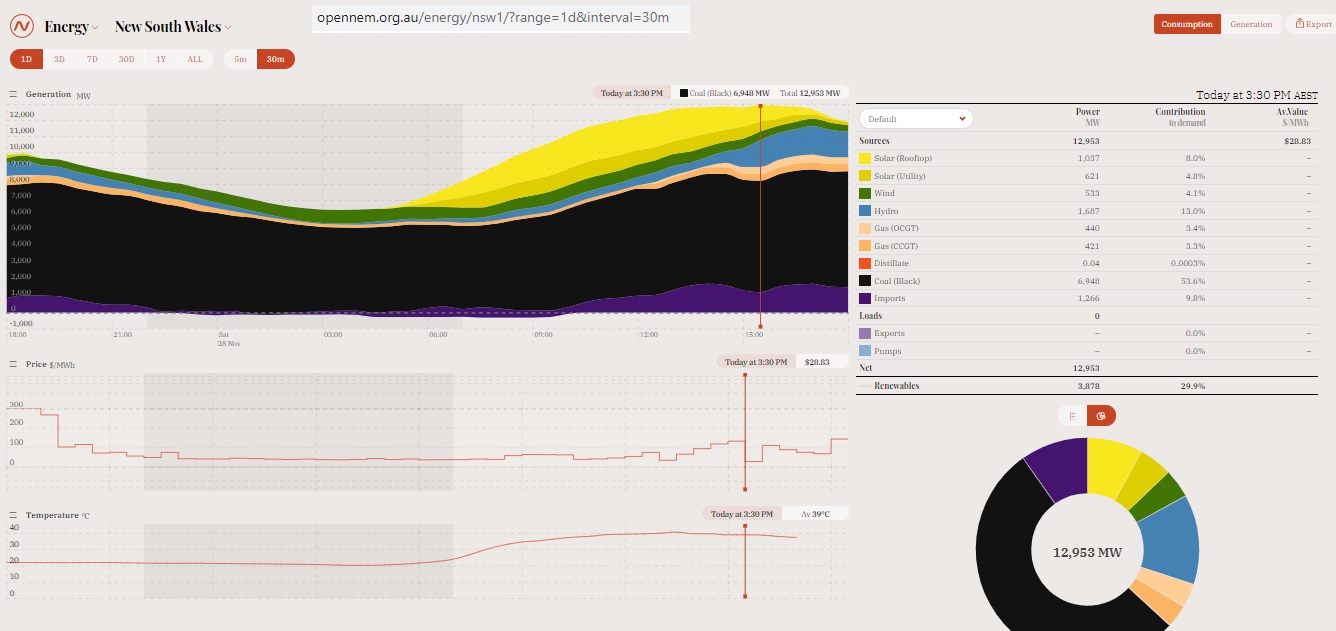 Fig 13: NSW power generation by fuel plus imports (from Queensland and/or Victoria)
The highest power supply for the day was 12,953 MW at 15:30. Note high imports (mostly from Queensland) of 1,266 MW at 15:00 and later in the evening as temperatures remained high even at night.
(11) Price spike predictions on 29 Nov 2020
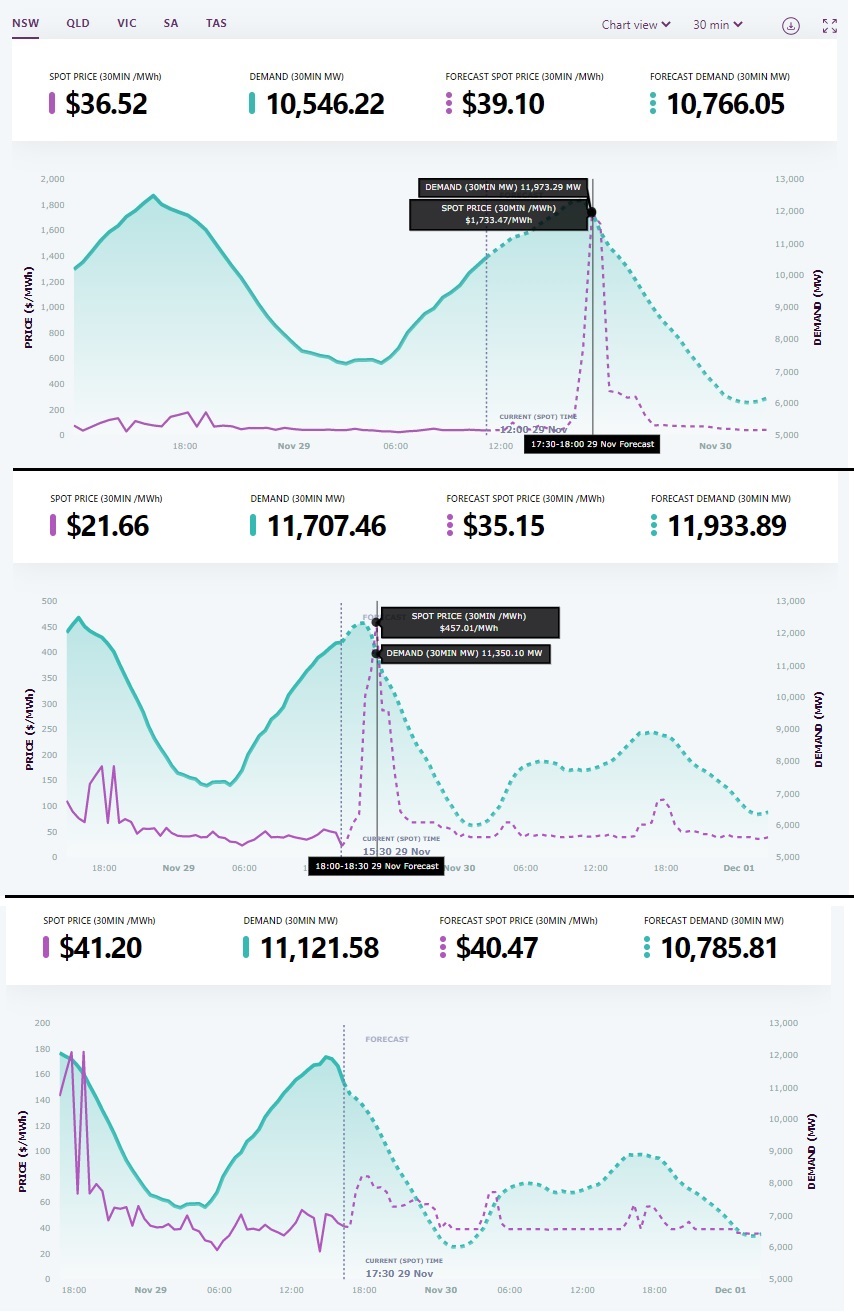 Fig 14: Price spike prediction 29 Nov 2020
Upper panel: At lunch time, a modest price spike of $1,733/MWh was predicted for 17:30 with a demand of 11,937 MW, lower than the previous day.
Mid panel: At 15:30, the expected spot price came down to $457/MWh for 18:00 with a demand of 11,350 MW
Lower panel: At 17:30 the price was back to the “normal range” of the last 24 hrs.
(12) NSW power supply peak 12.87 GW on 29 Nov 2020
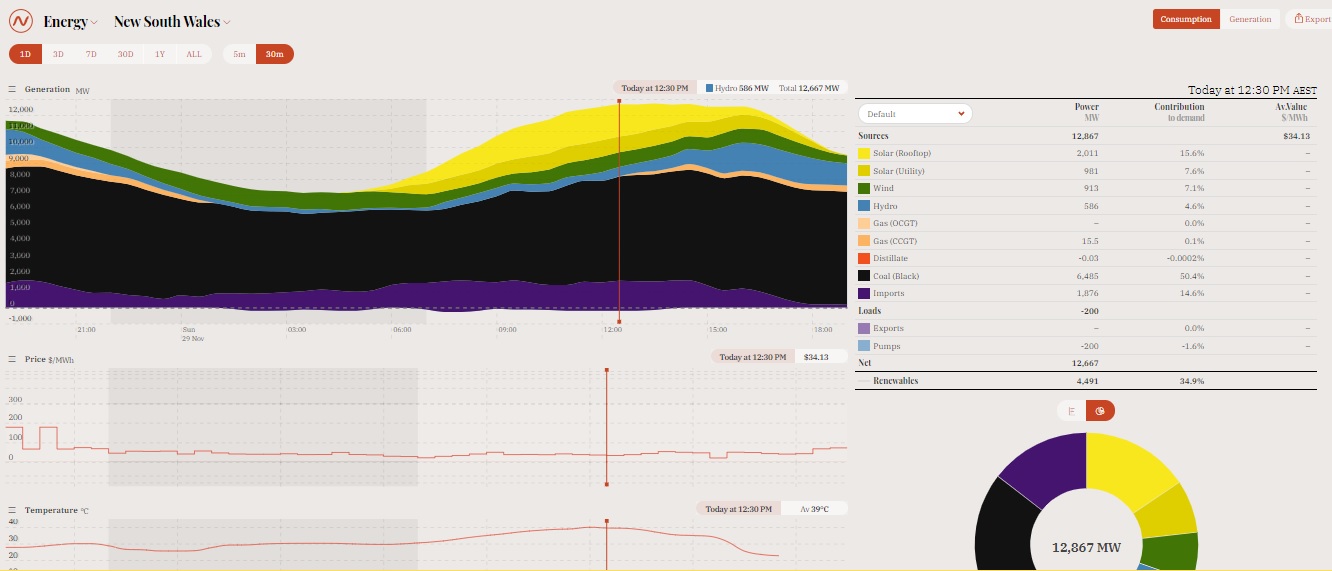 Fig 15: The highest demand for the day was 12,867 MW at 12:30.
Imports dropped after 15:00 as temperatures went down and hydro-power was ramped up.
(13) NSW Power imports
NSW is a #1 energy guzzler, living beyond its means. Look at this power hungry extravaganza in Barangaroo, a pet project of the CBD centric Berejiklian government:
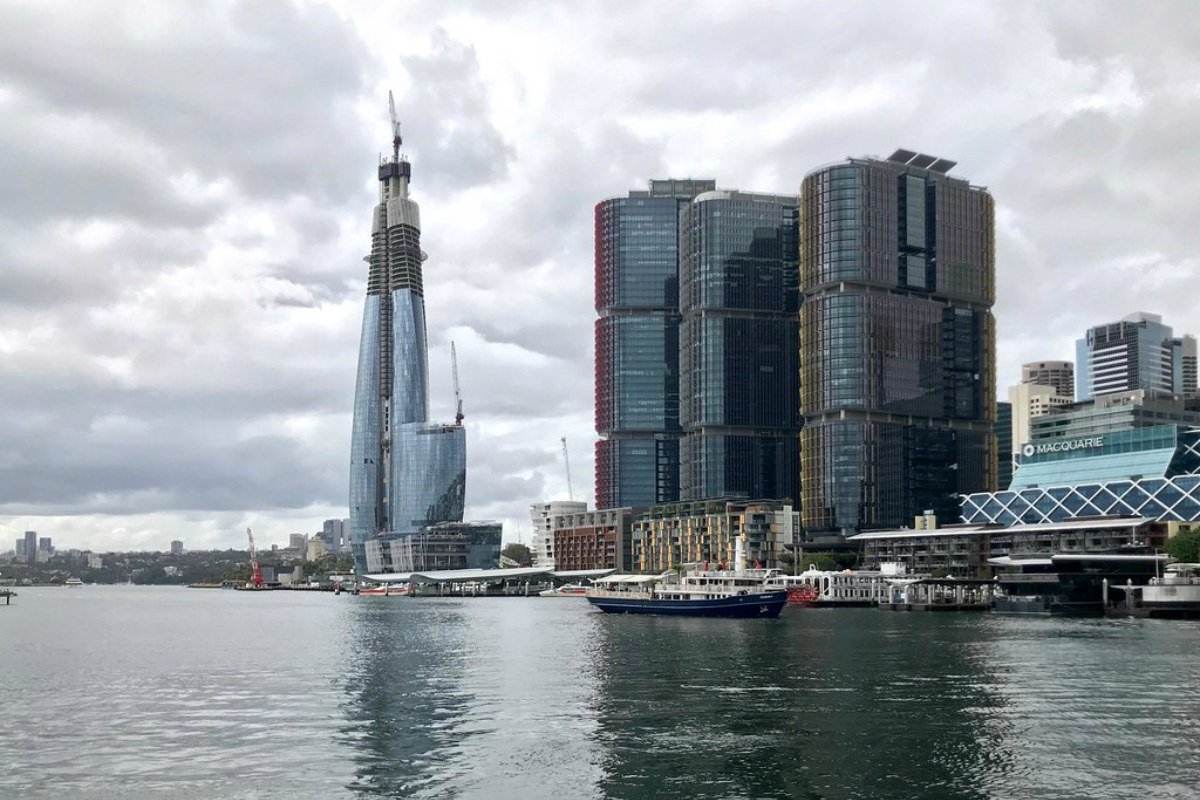 Fig 16: Towers 1-3 and Crown Casino in Barangaroo South
Generously endowed with awards and self-praise for energy efficiency – including unsolicited comments from former Prime Minister and wanna-be architect Paul Keating, the central air conditioning unit for towers 1-3 still adds 62 MW to Sydney’s power demand.
NSW could not survive without imports from neighbouring states Queensland and Victoria. We start with Queensland.
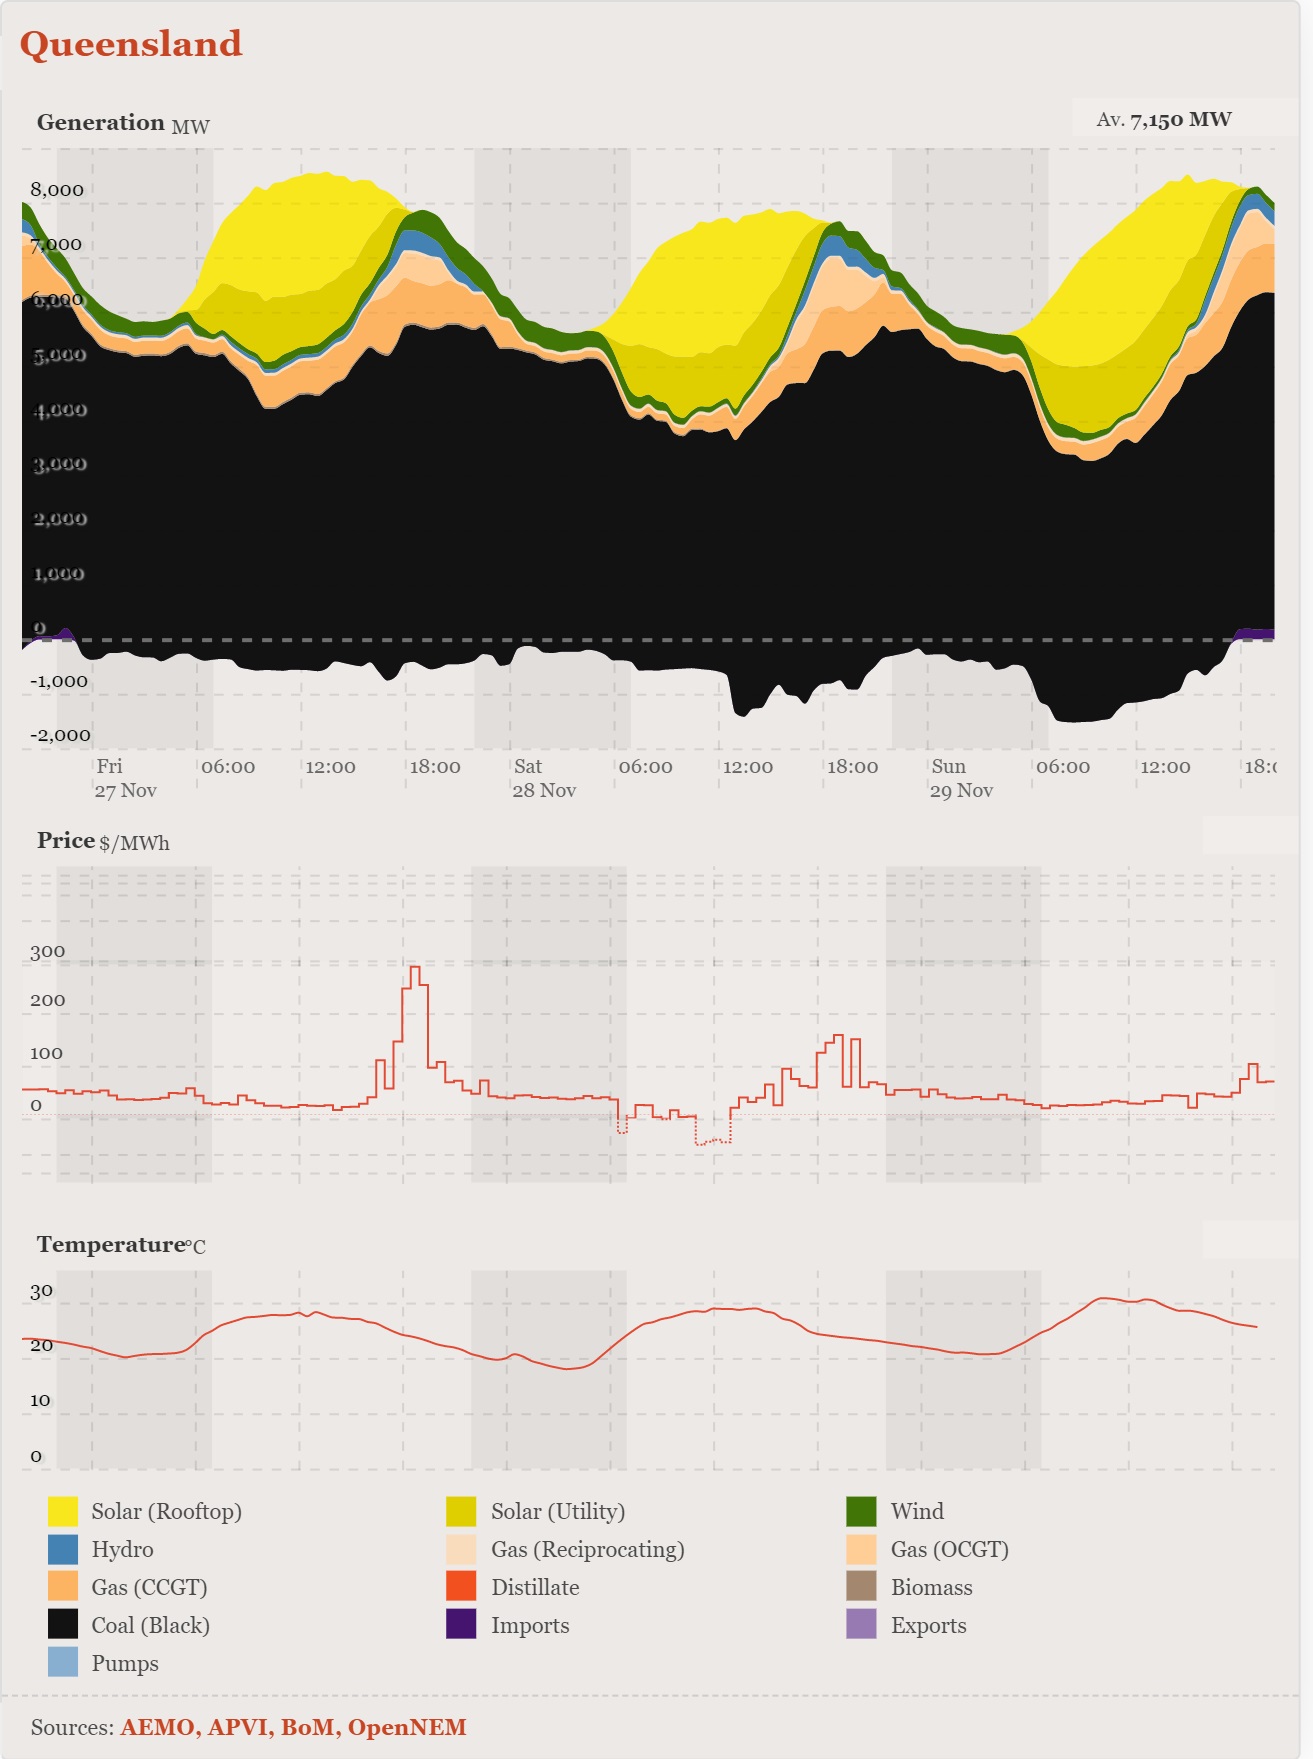 Fig 17: Queensland’s power supply and exports (area below zero) 27-29 Nov 2020
Where the power plants are located along the coast, Queensland’s temperatures were not particularly high (max around 30 degrees). Coal generated power varied between a maximum of 6.2 GW and a minimum of 4.3 GW.
Note that power exports increased on the 28th November between 12:30 and 13:30 just when coal fired power was ramped up and on 29th November between 6:00 and 7:30 when solar utility took off. Queensland’s exports show up as imports in NSW:
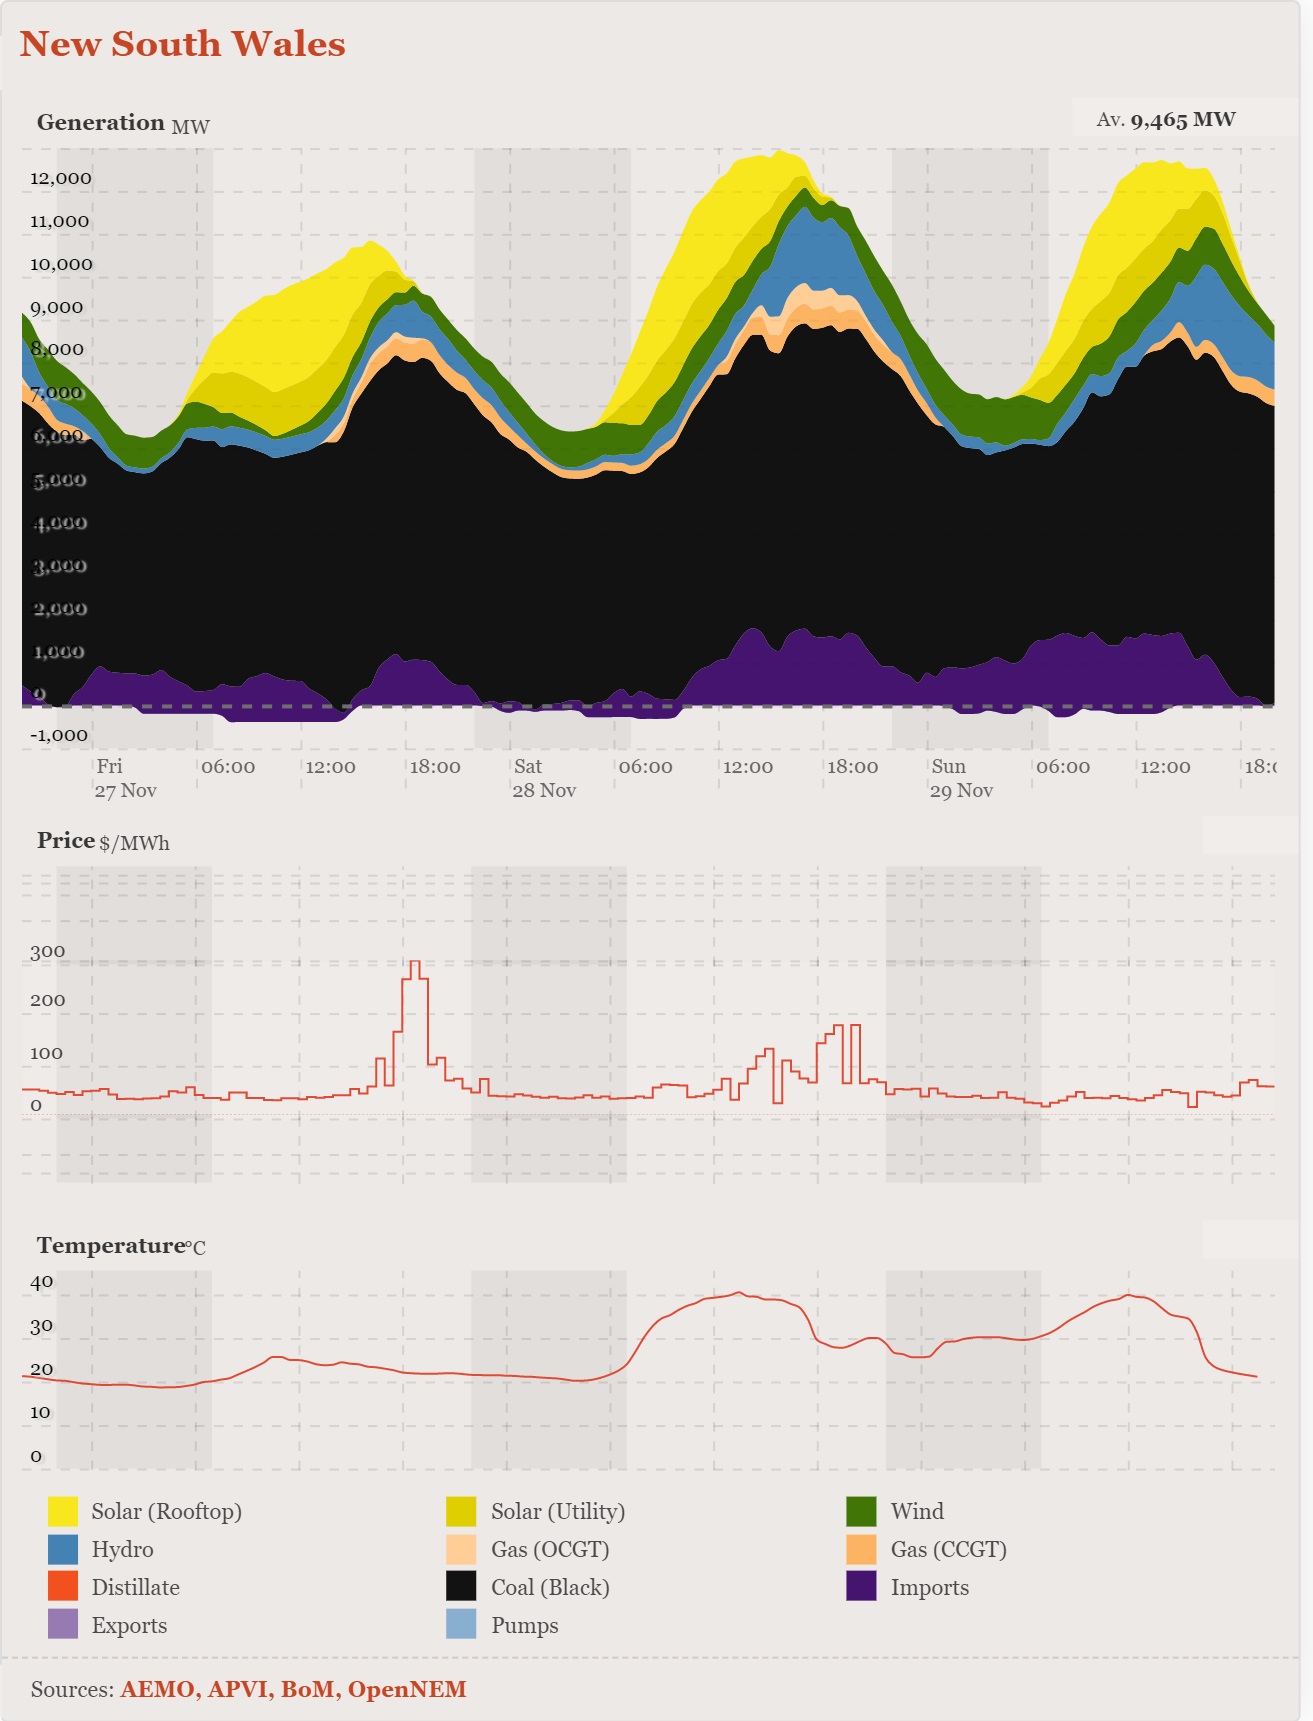 Fig 18: NSW power supply and imports (purple area) on 27-29 Nov 2020
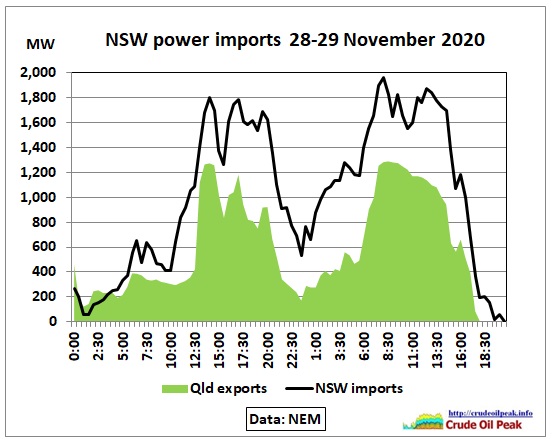 Fig 19: NSW power imports, around 60% from Queensland (green area)
The difference between the black curve and the green area should be imports from Victoria.
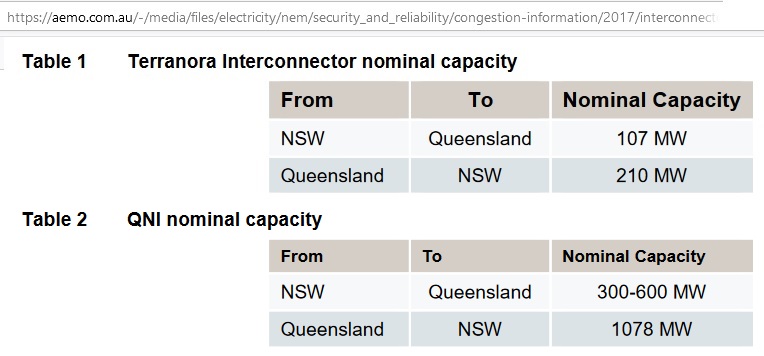 Fig 20: NSW-Queensland interconnector capacity 2017
“Transfer from Queensland to New South Wales is mainly limited by the transient stability limits for fault on either a Bulli Creek to Dumaresq or an Armidale to Dumaresq line(Q:N_NIL_AR_2L-G). This is approximately 1050-1078 MW.”
https://aemo.com.au/-/media/files/electricity/nem/security_and_reliability/congestion-information/2017/interconnector-capabilities.pdf
So Queensland’s exports can’t go beyond around 1,200 MW (Fig 19) reflecting the interconnector limits in Fig 20.
We continue with Victoria where power exports are less peaky but a bit more complicated because they go to 3 neighbouring States with different requirements at any given time.
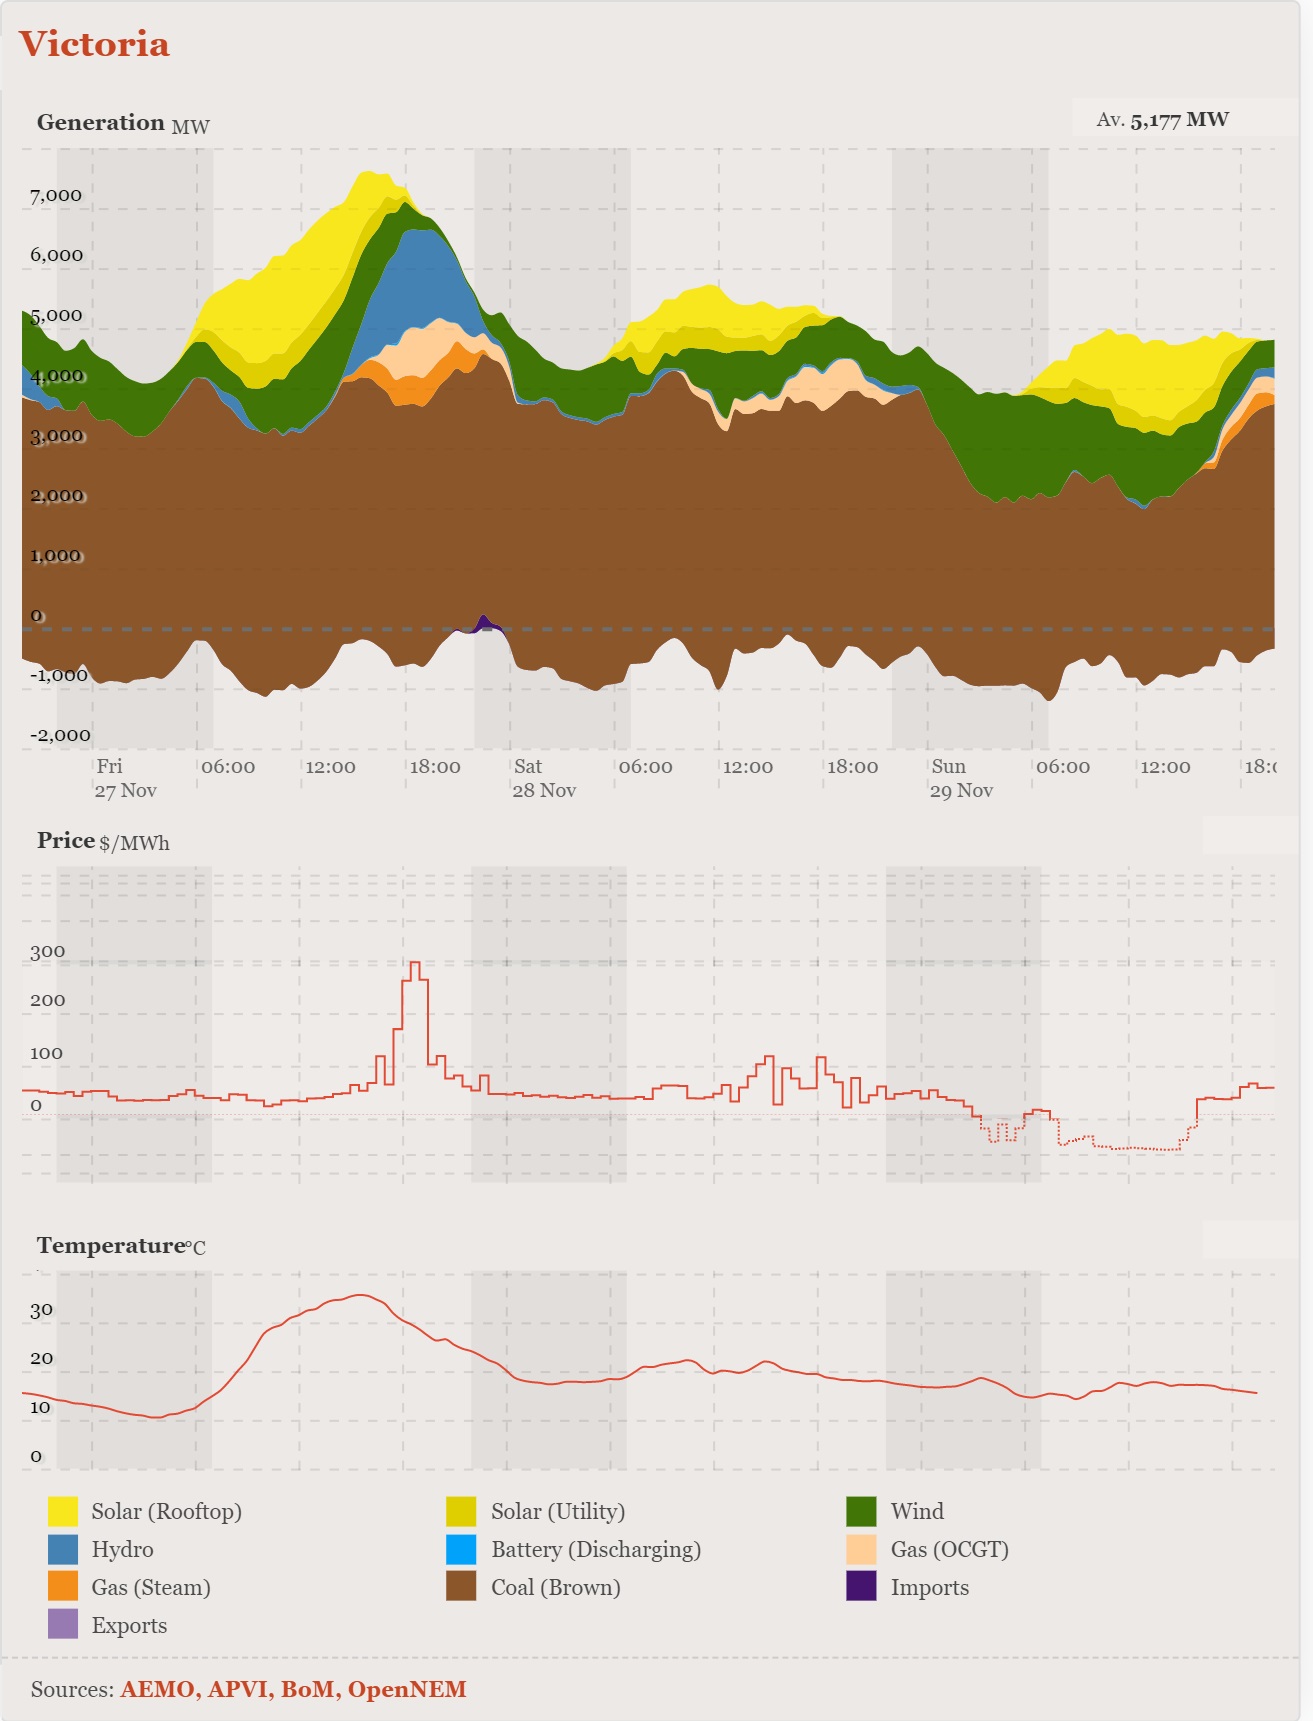 Fig 21: Victoria’s power supply and exports (area below zero) 27-29 Nov 2020
We see that, luckily, temperatures and therefore power demand in Victoria dropped for the 2 hot days in NSW (28/29 Nov). Yet, power exports remained on a similar bumpy plateau. We can also see: on 28 Nov. Victoria saved hydro power because there is no pumped storage there yet. Such projects are only in the stage of pre-feasibility studies https://www.energy.vic.gov.au/renewable-energy/pumped-hydro
And on 29th November, brown coal power was reduced in favour of power from wind.
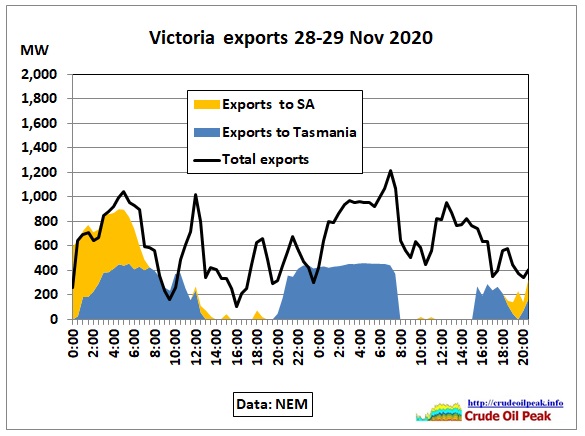 Fig 22: Power exports from Victoria
South Australia did not need any imports from Victoria because temps were cool and there were enough wind and sun power which actually allowed moderate exports:
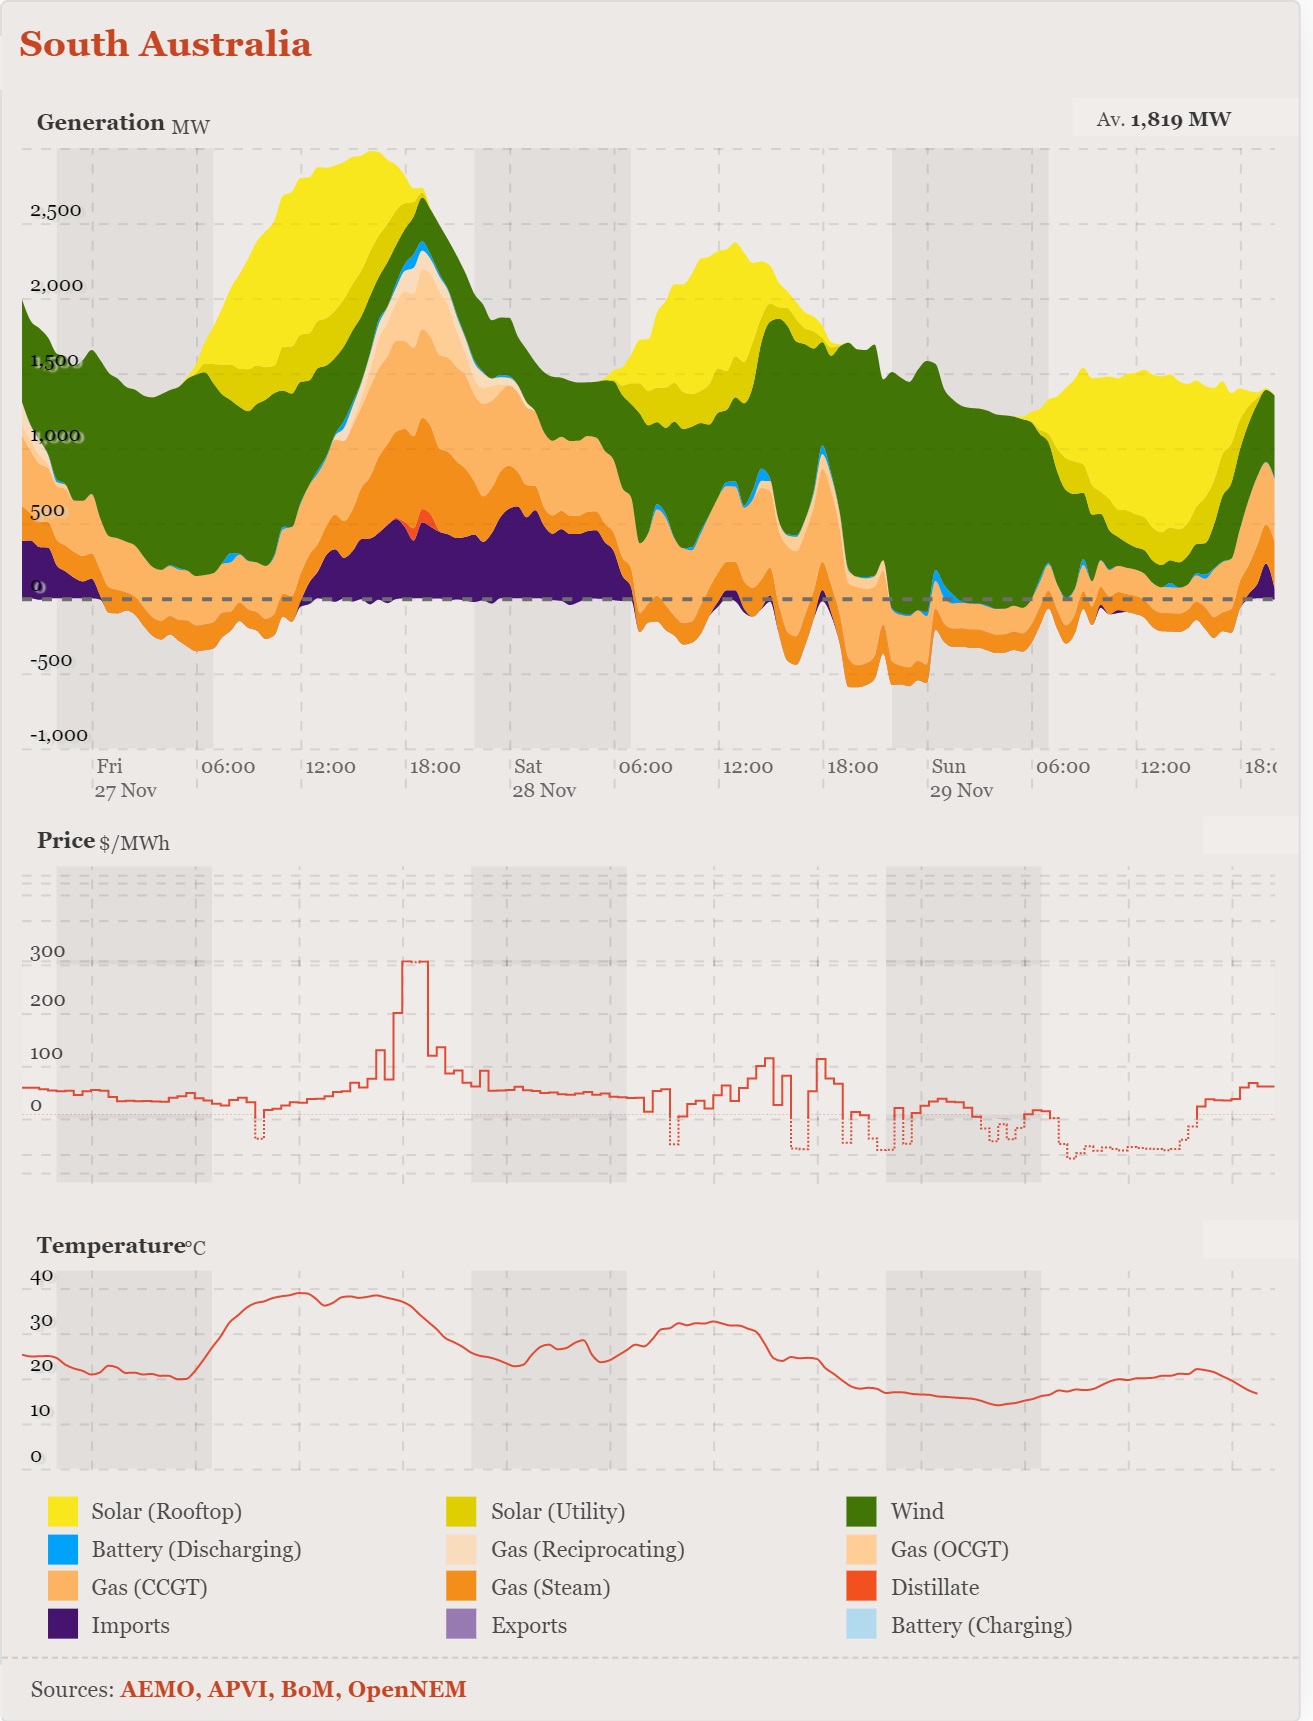 Fig 23: South Australia power generation and imports/exports
Tasmania imports power from Victoria to save on hydropower and when wind output is low. It exports hydropower when Victoria needs it.
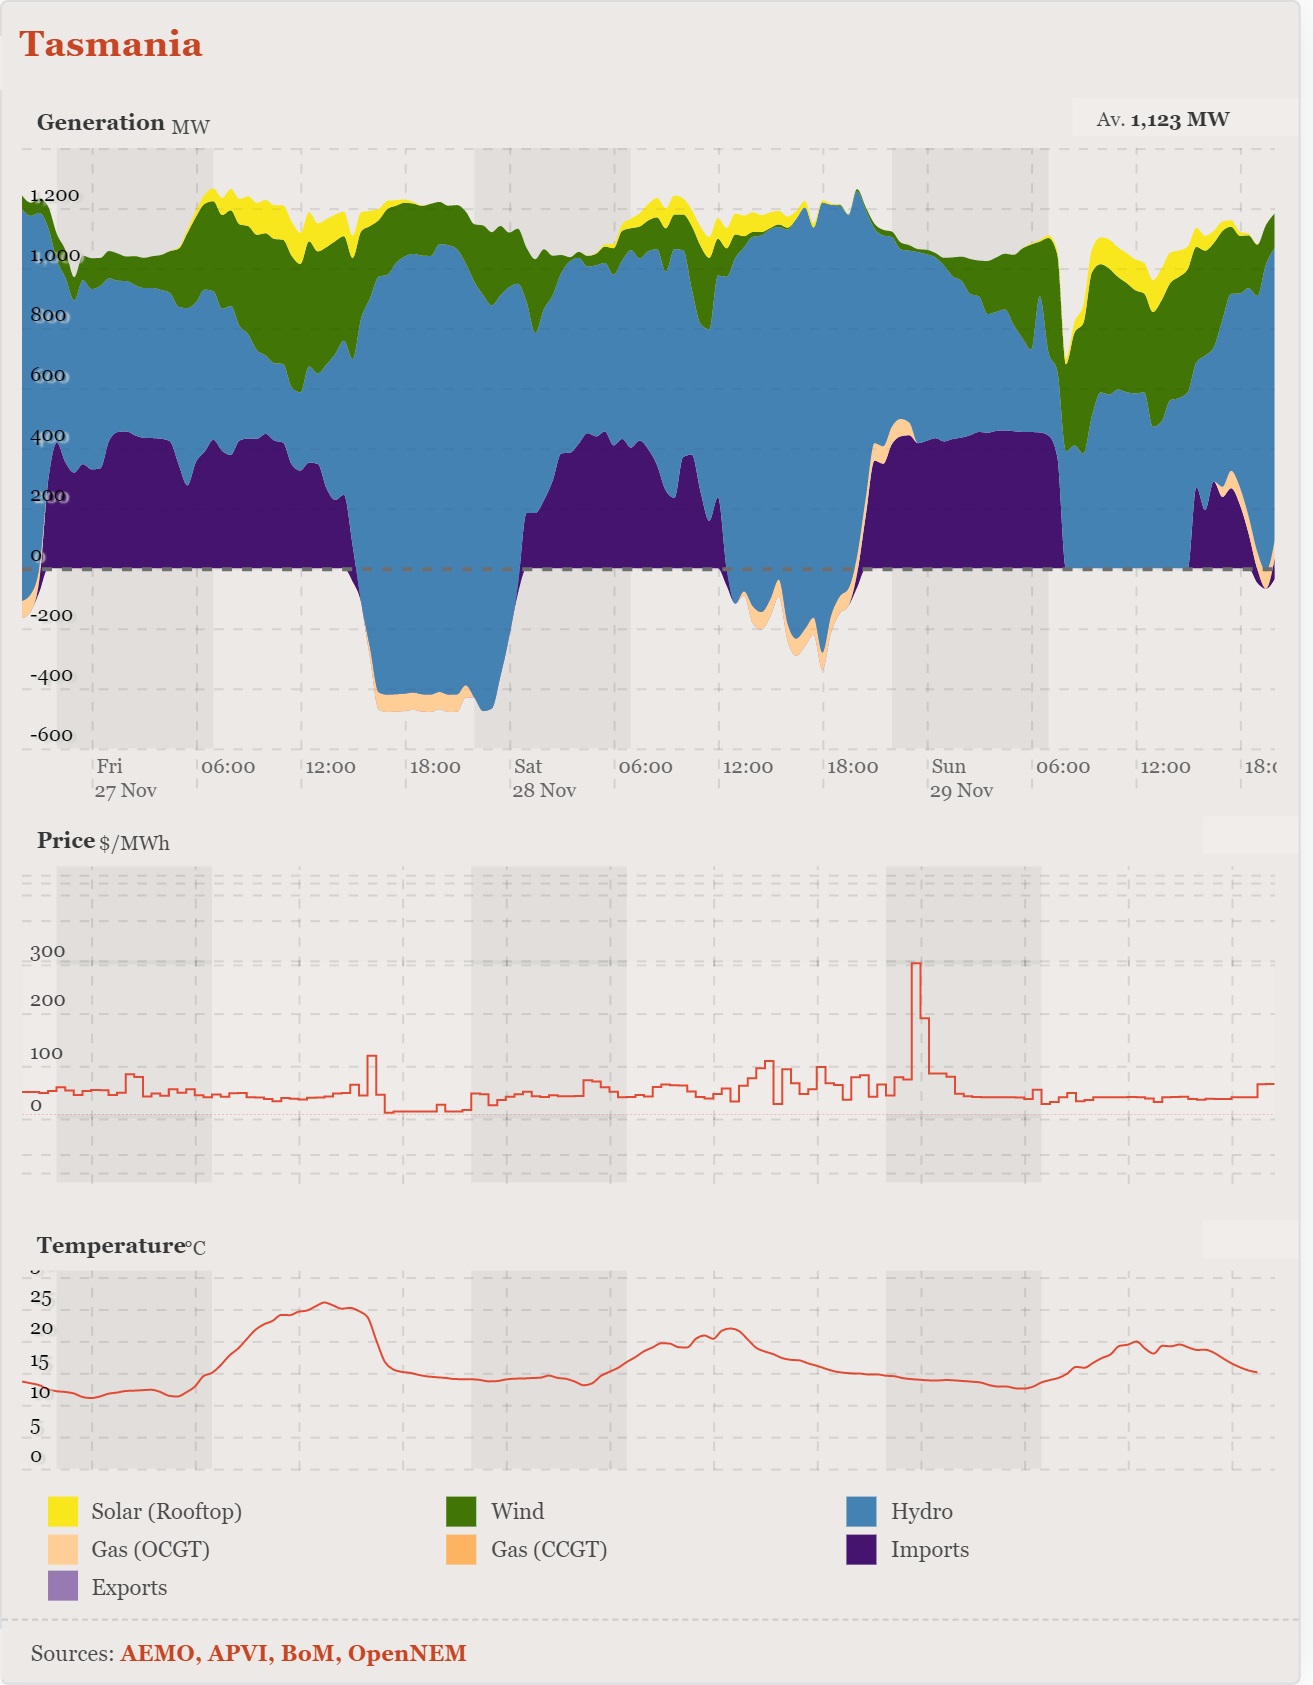
Fig 24: Tasmanian power generation and imports/exports
The difference between the black curve and the yellow/blue areas in Fig 22 would be exports to NSW. They are limited (thermal, voltage stability, and transient stability) according to this table:
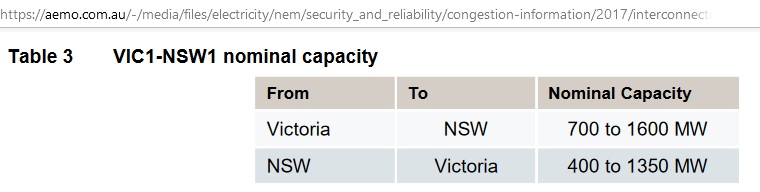 Fig 25: NSW –Victoria interconnector capacity 2017
Steps are being taken to increase the above capacities by 170 MW (Feb 2020 report). https://aemo.com.au/-/media/files/electricity/nem/planning_and_forecasting/victorian_transmission/2020/vni-rit-t/victoria-to-new-south-wales-interconnector-upgrade-rit-t-pacr.pdf
14 Weather and climate
We see that NSW’s power imports depend on many factors in the East Coast grid. Above all it’s the shape of heatwaves moving across the continent and hitting the States on different days
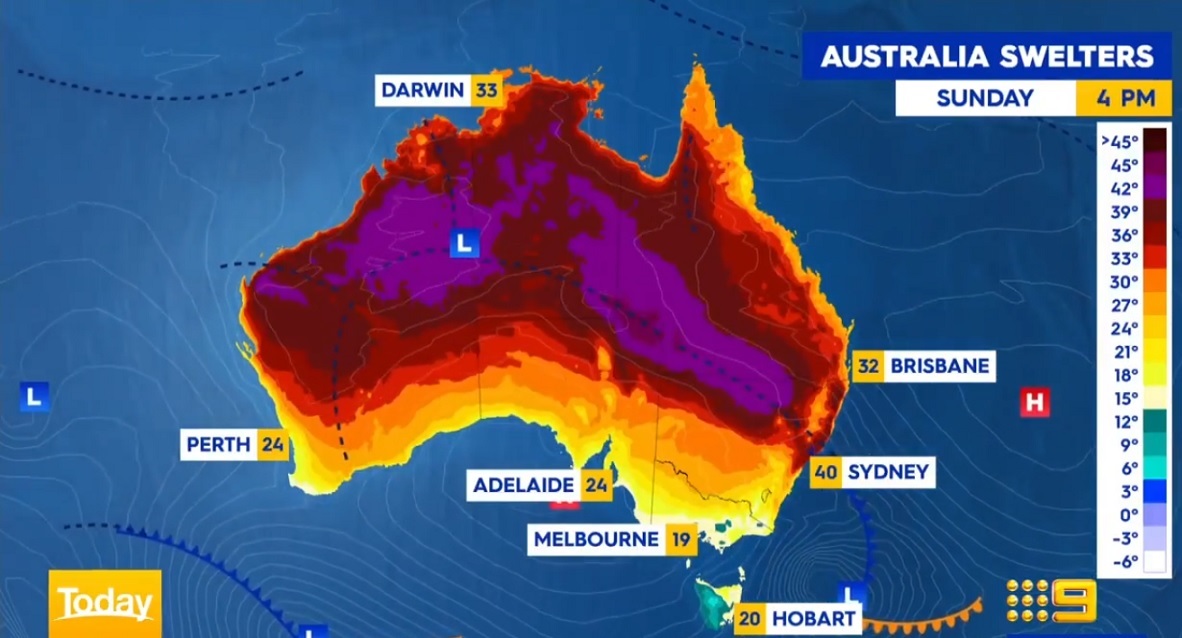
Fig 26: Temperatures on 29th November 2020
On the 2nd hot day in NSW, a southerly change had already cooled down Victoria. Note that the winds around high pressure systems on the Southern hemisphere move in anticlockwise direction. Over Adelaide, a High system brought cool air from the South into Victoria, while a High system east of Northern New South Wales pulled warm air from the North down the coast. The clockwise Low in the North West pushed tropical air across the continent towards the East.
NSW was lucky that 29/29th Nov. was a weekend when power demand is usually lower than during weekdays.
Climate change means max. daily weekday demand will go up. AEMO has already calculated the impact.
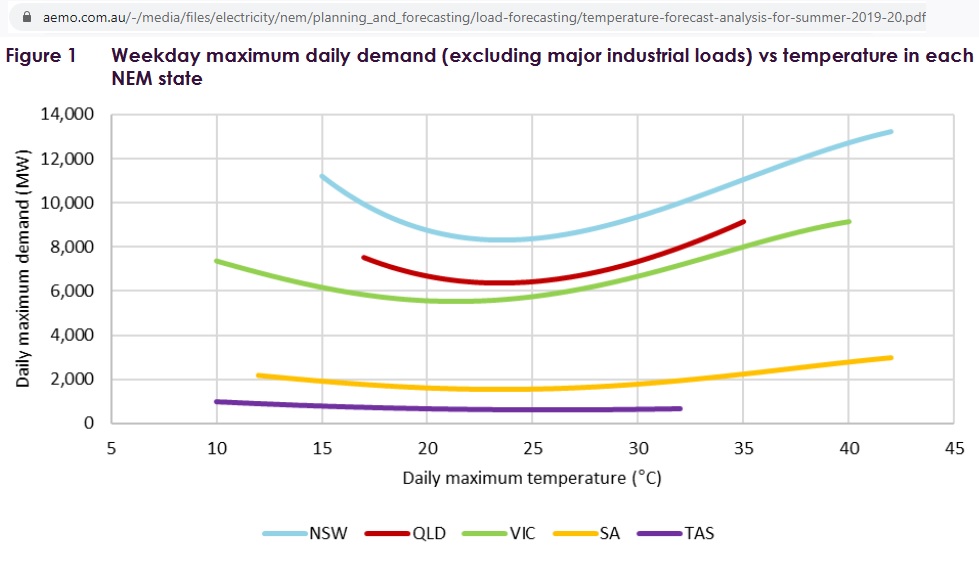 Fig 27: Max power demand as a function of temperature
For example, if temperatures increase from 30° to 35° then demand is higher by:
+1,800 MW in Queensland
+1,700 MW in New South Wales
+1,300 MW in Victoria
+500 MW in South Australia
https://aemo.com.au/-/media/files/electricity/nem/planning_and_forecasting/load-forecasting/temperature-forecast-analysis-for-summer-2019-20.pdf
Note that NSW demand at 40 degrees was already 13 GW. 1 year ago, in November 2019, max temperature was 35.7 degrees on 12 November, with a max demand which was much less, around 10.5 GW.
Conclusion: NSW must stop adding new energy hungry power consumers. It all adds up: skyscrapers and apartment towers, metros designed to connect these towers, a new airport, even lighting for a myriad of road tunnels now growing like a spider web across Sydney. There is also the (untested) assumption that Australia can easily transition to electric vehicles in order to replace oil. But that is currently not feasible. That is why there are power supply articles on this website on oil.
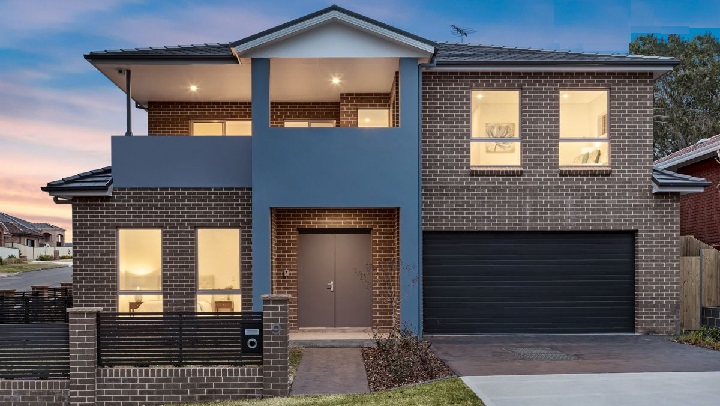
Above all, immigration of rich Asians must be curbed because they tend to build luxurious mansions (black roof tiles and drive-ways and dark bricks creating new heat islands) with all trappings and without compulsory solar water heaters and PV panels (replacing old, modest houses)
COVID-19 has created a breathing space but it is to be feared that governments will return to business-as usual ASAP. In any case, an outdated BASIX must prescribe mandatory solar water heaters and PV panels and no natural gas in residential housing. The Greater Sydney Commission must calculate future power demand of projects, enter them into a database and make approvals dependent on a future carbon free power supply.
Previous post:
26/11/2020
NSW power supply problems November 2020
https://crudeoilpeak.info/nsw-power-supply-problems-november-2020