Continued from part 1
But there is another metric explaining China’s oil consumption growth: debt. The following graph is from an article by the Institute of International Finance in its weekly insight of 14 May 2020:
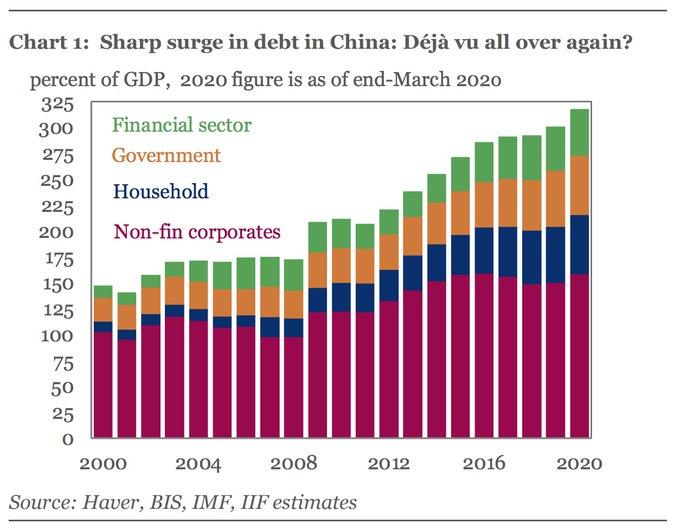
Fig 9: China’s growing debt by sector
“The rise in China’s total debt in the years since the 2008 global financial crisis has been unprecedented, from around 172% of GDP to over 300% in 2019.This rapidly escalating leverage has been a major engine of global growth—but has also accounted for more than 40% of the rise in global debt since 2007.”
https://www.iif.com/Portals/0/Files/content/1_200514%20Weekly%20Insight.pdf
Let’s superimpose China’s oil consumption on the above debt graph
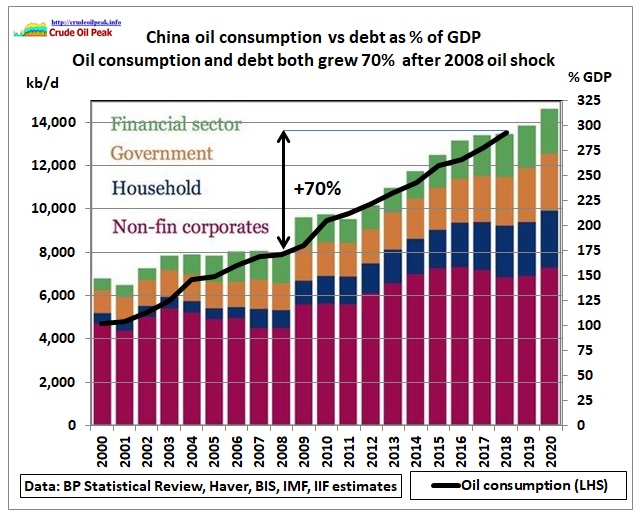 Fig 10: Oil consumption superimposed on debt in % of GDP
We see here – like in many other financial graphs – the impact of the 1st phase of peak oil: a sudden jump and a directional change: an increase in debt after the 2008 oil price shock.
Both debt and oil consumption grew 70% over 10 years after 2008. This means that oil consumption growth was driven by increasing debt.
The BP Energy Outlook of March 2019 had an idea how to bring China’s oil demand growth down:
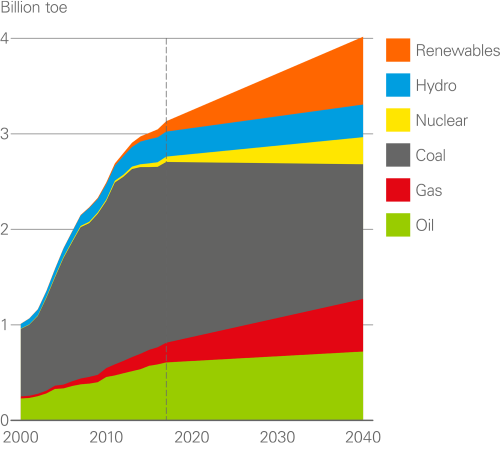 Fig 11: BP’s view of China’s future primary energy mix
https://www.bp.com/en/global/corporate/energy-economics/energy-outlook/demand-by-region.html
Let’s put the oil wedge into a more detailed graph (using the data provided in an XLS file on the above BP website)
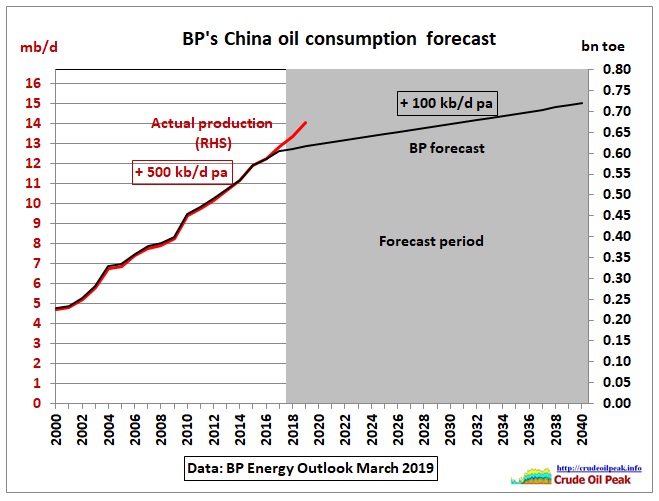 Fig 12: A kink in China’s oil consumption trend?
Hasn’t happened yet. Maybe COVID19 will do it.
We continue with other Asian countries.
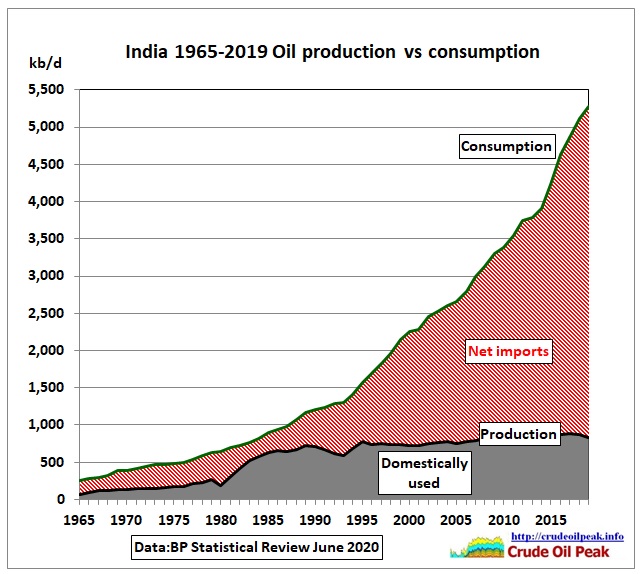 Fig 13: India’s oil consumption vs stagnating production
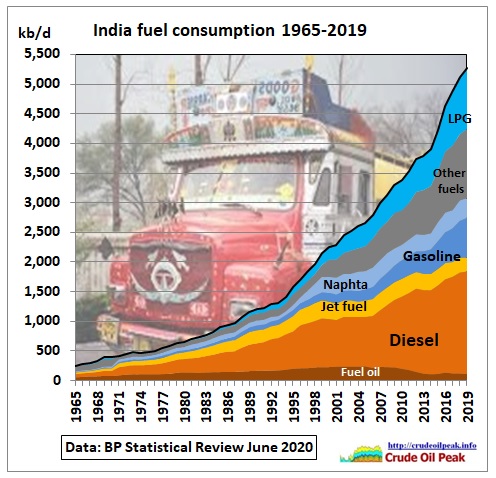 Fig 14: India’s oil consumption by fuel
Let’s have another try to link GDP with oil consumption:
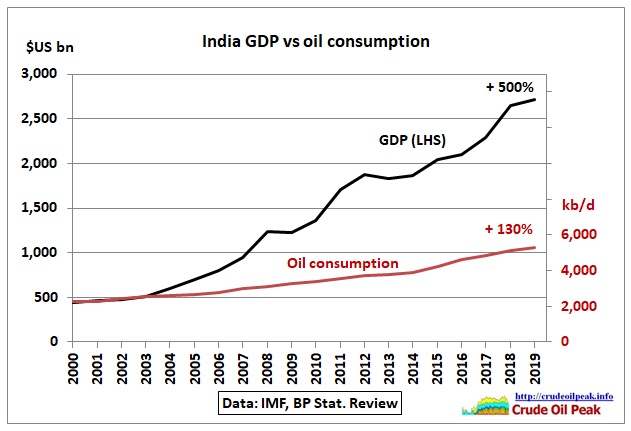 Fig 15: Trends in GDP and oil consumption
For the 20 year trend, the correlation factor is 98%. For every % of GDP growth, there is 0.26% growth in oil consumption. For the annual changes y-o-y the picture is more complex:
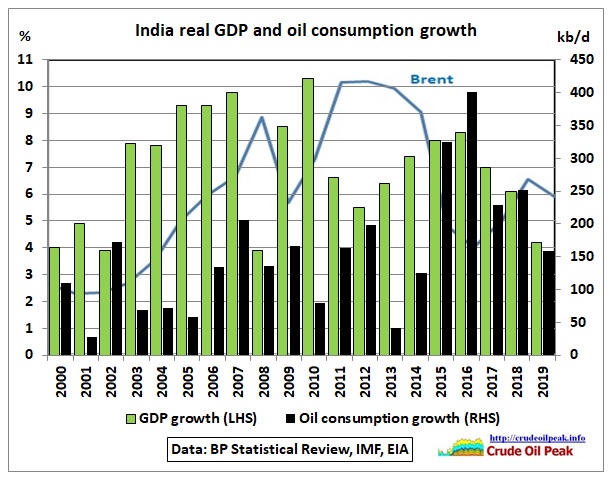 Fig 16: India’s GDP and oil consumption growth
Data are from the IMF World Economic Outlook April 2020 data mapper (XLS file) “Real GDP Growth – annual percent change”
https://www.imf.org/external/datamapper/NGDP_RPCH@WEO/IND?year=2020
The correlation was not very high except for the last 5 years when it was 90%.
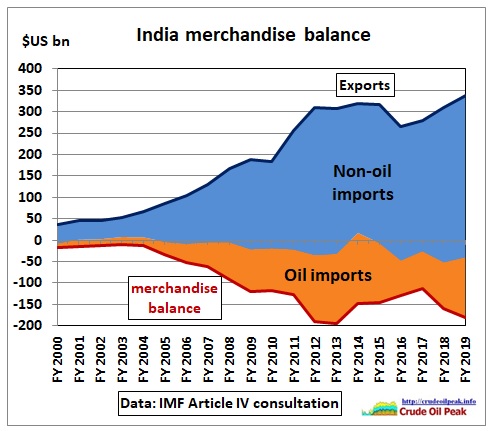 Fig 17: India’s merchandise balance
India’s merchandise balance is pulled into the negative by oil imports. IMF 2019 directory
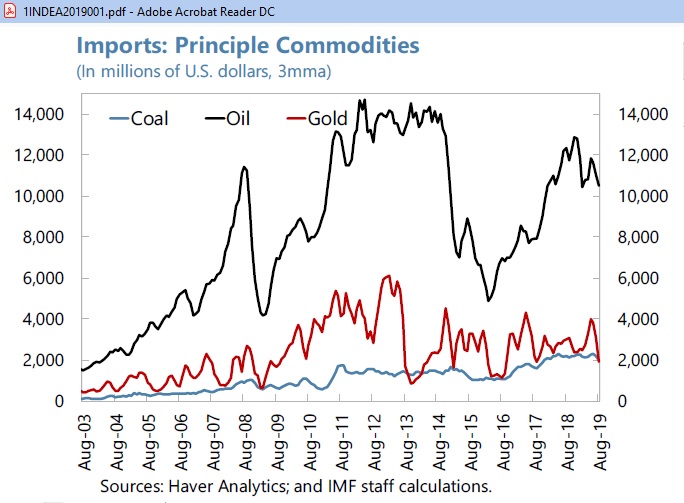 Fig 18: India’s imports of oil, coal and gold (p31)
The oil import bill above is a product of import volumes and oil price
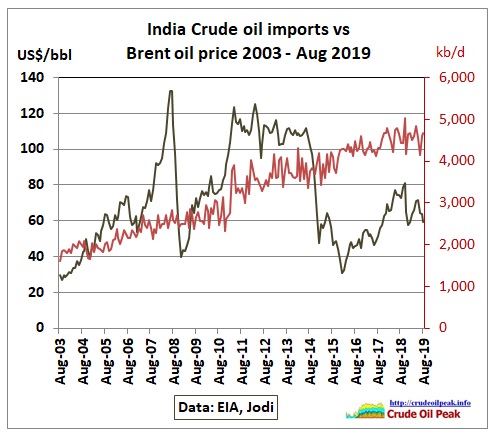 Fig 19: India’s crude imports and Brent oil price
The IMF writes:
“Variations in macroeconomic vulnerabilities drive financial flows and growth prospects.
In particular, the Indian economy depends heavily on imported oil. The net oil import bill amounted to about US$94 billion in FY2018/19, equivalent to about 3½ percent of GDP or a fifth of merchandise imports. An increase in international oil prices, therefore, directly affects the economic outlook, with a widening current account deficit raising concerns over external financing and rising inflation affecting real disposable income and private consumption, and ultimately growth.
The macroeconomic vulnerability index constructed by extracting the first principal component from a collection of four variables appears to capture the level of systemic risk in India as it is closely correlated with growth outcomes. Importantly, the international oil price is identified as a factor that strongly influences India’s future growth with higher prices exacerbating vulnerabilities (Figure 2). (p 71)
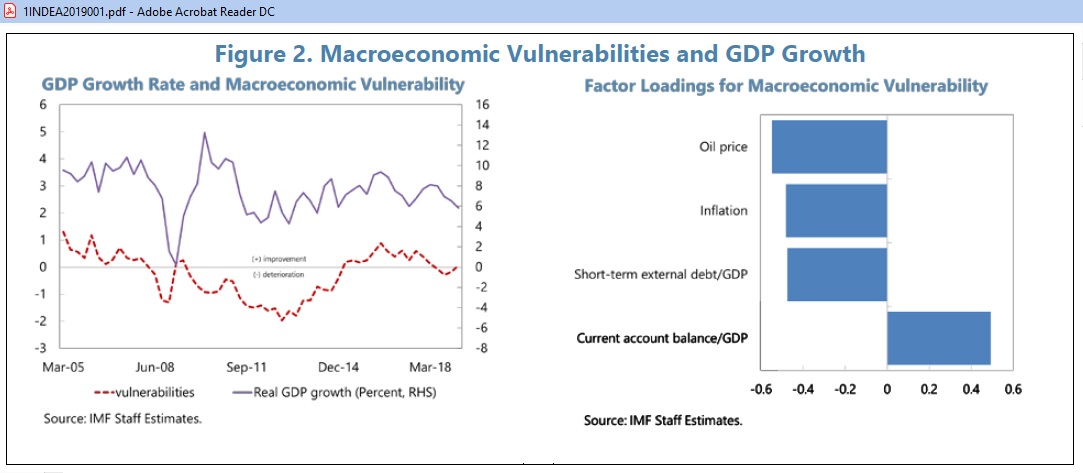 Fig 20: India’s macroeconomic vulnerabilities (p 72)
The IMF recommends to “improve targeting of transfers to shelter the most vulnerable; accelerate reform of remaining fuel subsidies; intervene to prevent disorderly currency movements”.
Only 4 months later, in April 2020, GDP growth has plummeted to 1.9%
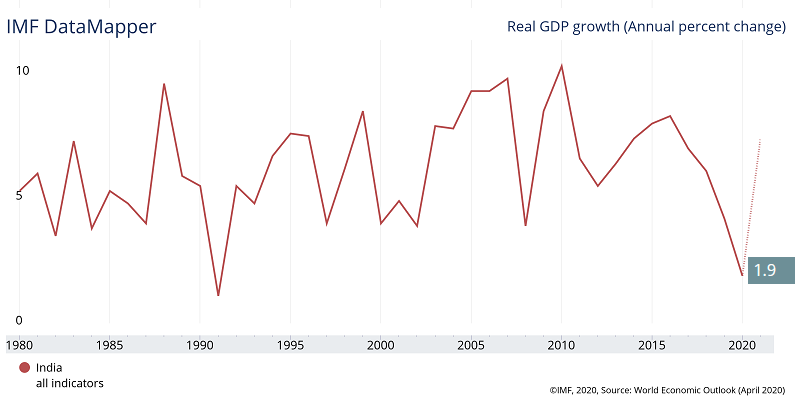 Fig 21: Impact on India’s GDP as a result of COVID19, a new vulnerability
Related links:
Peak oil in Asia Update June 2020 (part3)
https://crudeoilpeak.info/peak-oil-in-asia-update-june-2020-part-3
Previous link:
Peak oil in Asia Update June 2020 (part 1)
https://crudeoilpeak.info/peak-oil-in-asia-update-june-2020-part-1