In the previous posts we have shown that the peak oil problem in Asia is mainly a problem of skyrocketing consumption at an additional 1 mb/d (2.8%) each year. Whereas in Europe there was a distinctive production peak 1995-2003 followed by a decline of 50% over 10 years with consumption on a bumpy plateau since the oil crises in the 1970s.
In this post, we’ll continue to look at Asian oil consumption and resulting imports.
Oil consumption in Japan
Japanese oil consumption peaked in 1996 at 5.8 mb/d. It was down in 2019 to 3.8 mb/d. In the last 5 years decline rates moderated from -3% to -1% pa.
Note consumption increased again in 2011/2012 when direct crude oil burn in power plants was needed following the Fukushima nuclear plant meltdown (see spike in following graph).
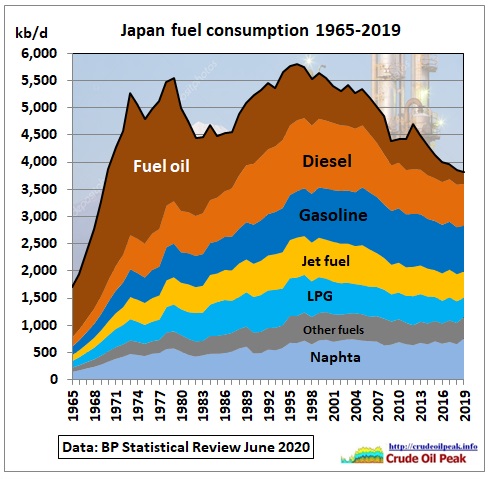 Fig 31: Oil consumption in Japan
Imports (inter area movements)
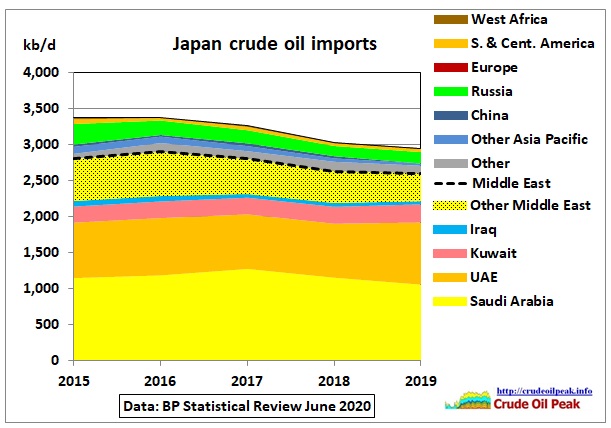 Fig 32: Japanese crude oil imports by country/region
Among the big Asian importers Japan is the most dependent on the Middle East (88% in 2019)
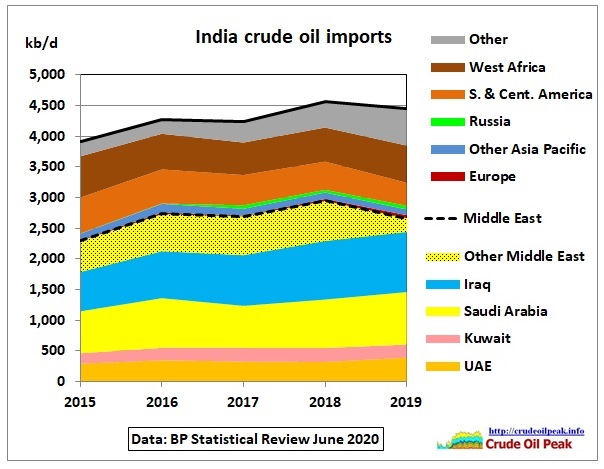 Fig 33: India’s crude imports by country/region
The 2nd largest Asian importer of crude is India with a Middle East dependency of 60% as around 1 mb/d comes from West Africa and South America.
#1 crude importer is of course China.
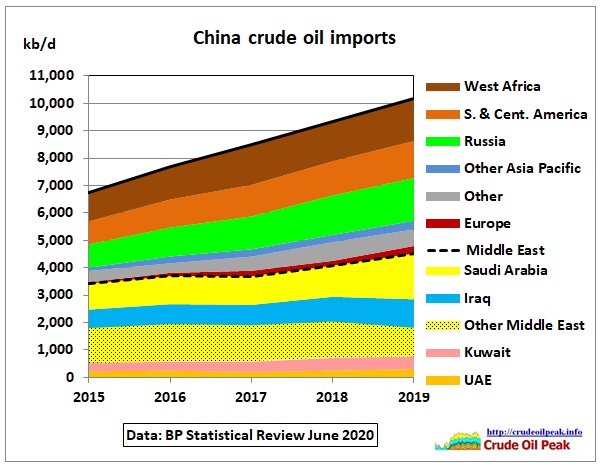 Fig 34: China’s crude imports by country/region
China’s dependence on the Middle East is “only” 44%. The diversification to West Africa and Brazil comes at a price: the distance and therefore the time at sea is almost doubled. It requires a fleet of VLCCs so this supply route is best used by the 2 large importers India and China. Note the imports from Russia.
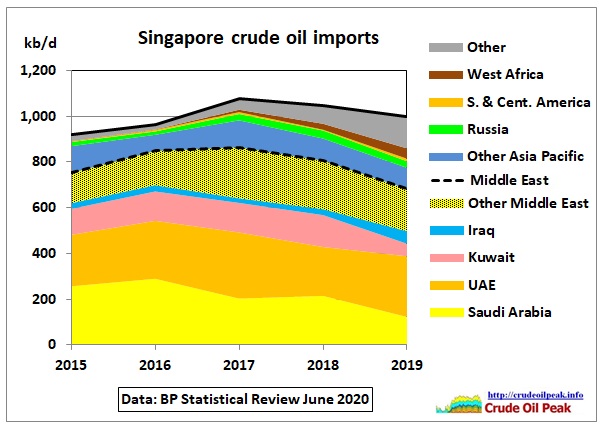 Fig 35: Singapore’s crude imports (68% dependency on ME)
All other smaller Asian importers are put together in the following graph:
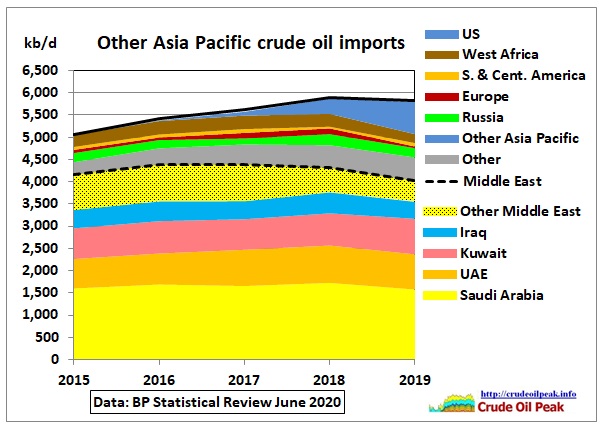 Fig 36: Other Asia Pacific crude imports (70% ME dependence)
All together now. Note that the imports in the next graph also include product imports.
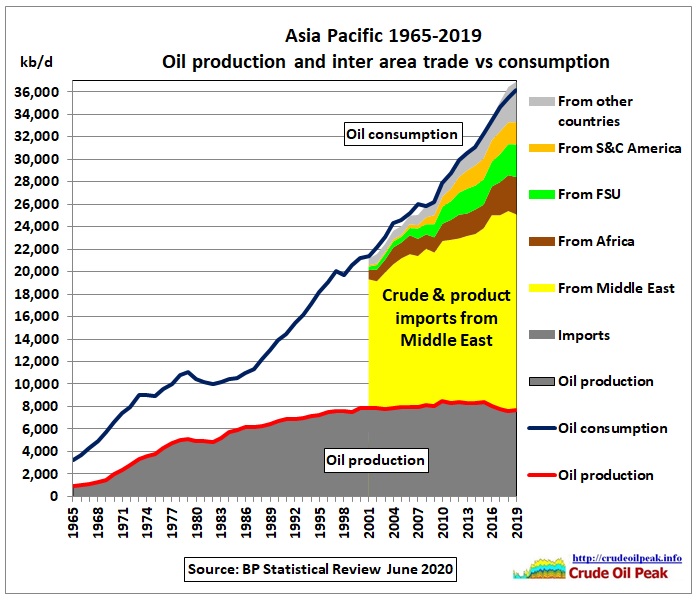 Fig 37: Asia Pacific oil imports stacked on production
Oil reserves
In the BP Statistical Review, oil reserves include gas condensate and natural gas liquids (NGLs) as well as crude oil with following definition:
“Reserves are generally taken to be those quantities that geological and engineering information indicates with reasonable certainty can be recovered in the future from known reservoirs under existing economic and operating conditions. The data series for total proved oil reserves does not necessarily meet the definitions, guidelines and practices used for determining proved reserves at company level, for instance as published by the US Securities and Exchange Commission, nor does it necessarily represent BP’s view of proved reserves by country. Source of data – The estimates in this table have been compiled using a combination of primary official sources, third-party data from the OPEC Secretariat, World Oil, Oil & Gas Journal and Chinese reserves based on official data and information in the public domain.”
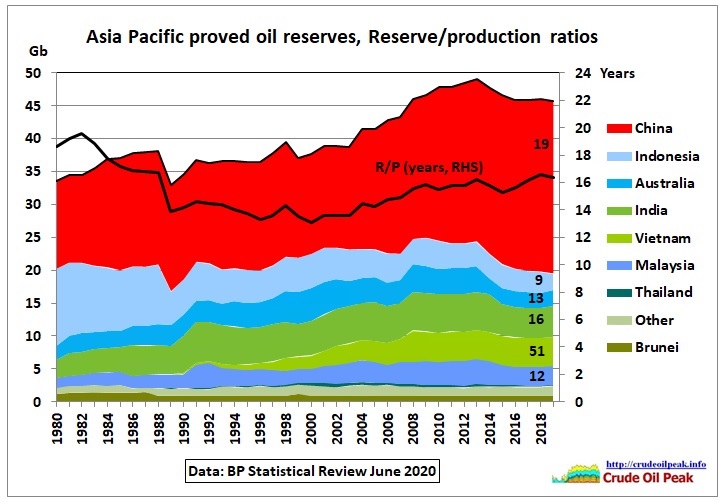 Fig 38: Asian oil reserve history
Asian reserves have peaked in 2013 mainly due to reserves declining in Australia, Indonesia, Malaysia and India. Chinese reserves (now 57% of the total) have been increasing since 2004 but have now stagnated in the last 4 years at around 26 Gb.
For all of Asia, the R/P ratio is 16 years, equal to a reserve depletion at 6% pa. There are big differences between countries as indicated on the graph above. These R/P ratios are theoretical numbers just giving an idea about the size of reserves which can be produced in the next decade or so. They don’t mean that production will continue at current rates and then drop to zero after 16 years. There are always new discoveries. The USGS estimated that there are 21.6 Gb undiscovered resources (not proved and probable reserves) but that assessment was done in 2010
https://pubs.er.usgs.gov/publication/fs20103015
In the meantime, the Norwegian oil consultant Rystad found in 2018 in this article:
Southeast and East Asia production to decline by nearly 3 million boe/d by 2025
https://www.rystadenergy.com/newsevents/news/newsletters/EandP/eandp-newsletter-february-2018/
that discoveries have declined since 2012, but these include gas and cannot be directly compared with oil in Fig 38.
China is the most important country. Oil geologist Jean Laherrere from ASPO France did a Hubbert linearization in June 2020:
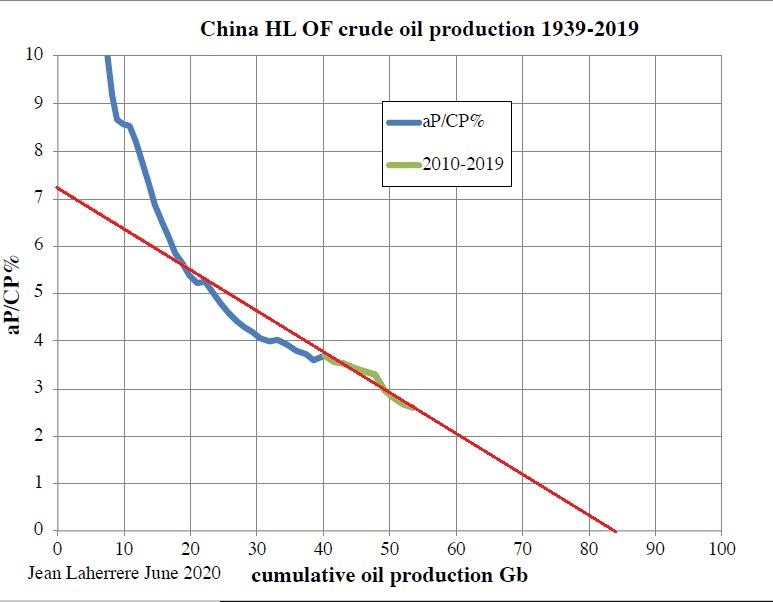 Fig 39: China Crude production as % of cumulative
The red trend line (using 2010-2019 data) points towards 85 Gb as ultimate. Cumulative production in 2019 was 53 Gb. This means depletion stood at 62%. Peak production in 2015 happened when depletion was 56%.
Countries with the reserves in Fig 38 are consuming 3.5 times more oil than they can produce:
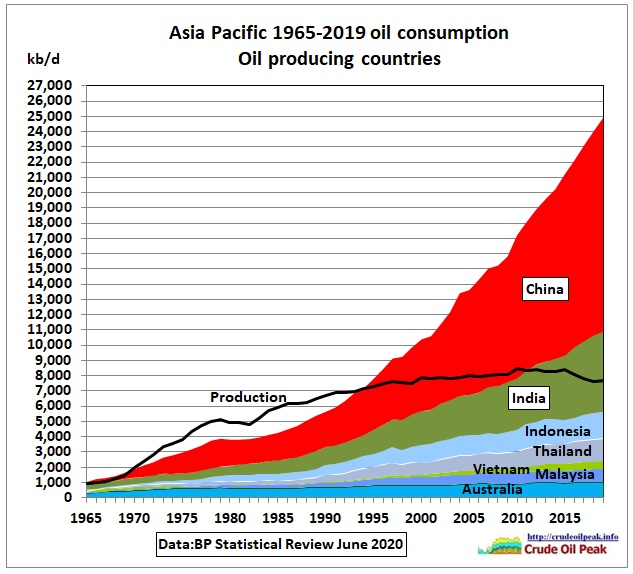 Fig 40: Oil consumption of oil producing Asian countries
Summary
Asia is clearly in peak oil mode. The main problem in future will be to rein in skyrocketing consumption. Maybe the Corona virus which escaped from China will help. Asia’s oil import problem will continue irrespective of what the virus does
Previous articles in this series:
17/8/2020
Peak oil in Asia Update June 2020 (part 3)
https://crudeoilpeak.info/peak-oil-in-asia-update-june-2020-part-3
15/7/2020
Peak oil in Asia Update June 2020 (part 2)
https://crudeoilpeak.info/peak-oil-in-asia-update-june-2020-part-2
30/6/2020
Peak oil in Asia Update June 2020 (part 1)
https://crudeoilpeak.info/peak-oil-in-asia-update-june-2020-part-1