Continued from previous post
Non-OPEC 10 oil production plateau ended 2019
20 Oct 2024
https://crudeoilpeak.info/non-opec-10-oil-production-plateau-ended-2019
Now let’s check how actual production compares to OPEC quotas. The focus here is on the period starting with 2019 (the last ‘normal’ year). The quotas are contained in PDF files attached to OPEC press releases
https://www.opec.org/opec_web/en/press_room/28.htm
of conference meetings, OPEC and Non-OPEC Ministerial meetings and JMMC (Joint Ministerial Monitoring Committee) meetings
The starting point is a production table published on 18th Jan 2019 by the JMMC
https://www.opec.org/opec_web/en/press_room/5357.htm
with the reference production and the first -1.2 mb/d adjustment for Jan 2019:
 Fig 1: OPEC production table dated January 2019
https://www.opec.org/opec_web/static_files_project/media/downloads/press_room/Voluntary%20production%20adjustments%20table%20att%20PR12019.pdf
This (historic) table is important because all production cuts are based on the reference production in column 1, updated from time to time. The latest reference production table was published in the 19th ONOMM dated 18th July 2021, valid for May 2022 and later.
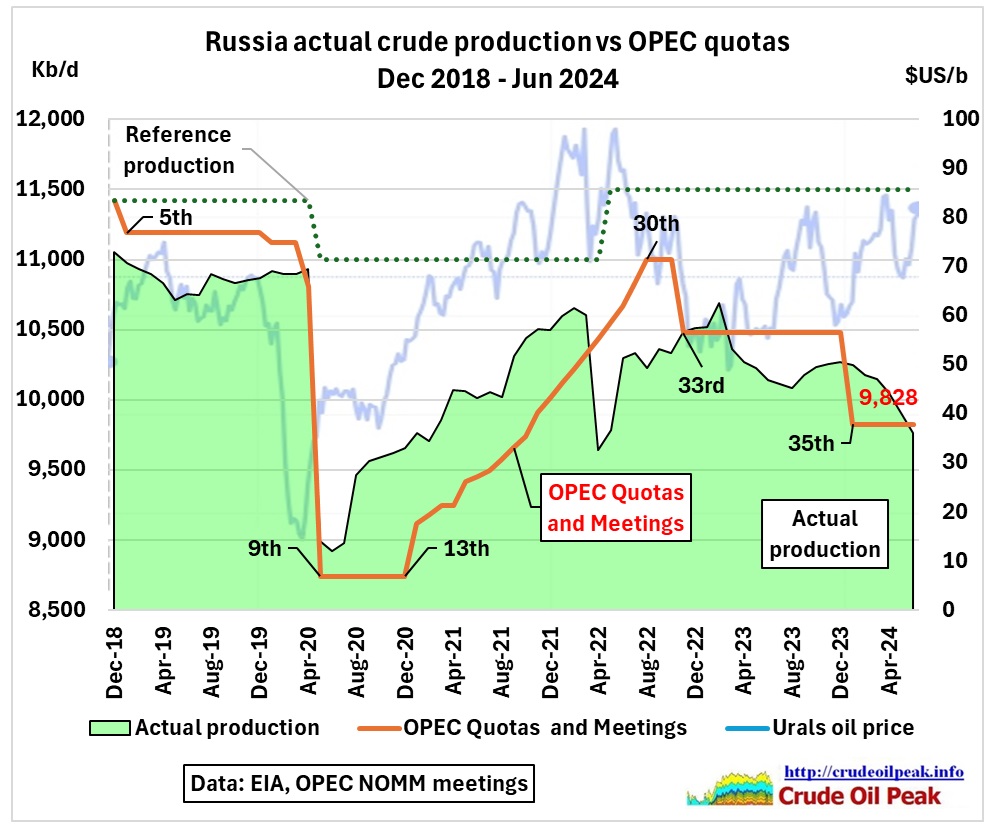 Fig 2: Russian crude oil production (excl. gas liquids) vs OPEC quotas
Urals oil prices are from:
https://tradingeconomics.com/commodity/urals-oil
In 2019, Russia produced less than the quota. When Covid hit in the first months of 2020 with falling oil demand, a price war between Saudi Arabia and Russia broke out
https://en.wikipedia.org/wiki/2020_Russia%E2%80%93Saudi_Arabia_oil_price_war
Oil plunges 10% after OPEC deal collapses
7 March 2020
https://www.bbc.com/news/business-51774622
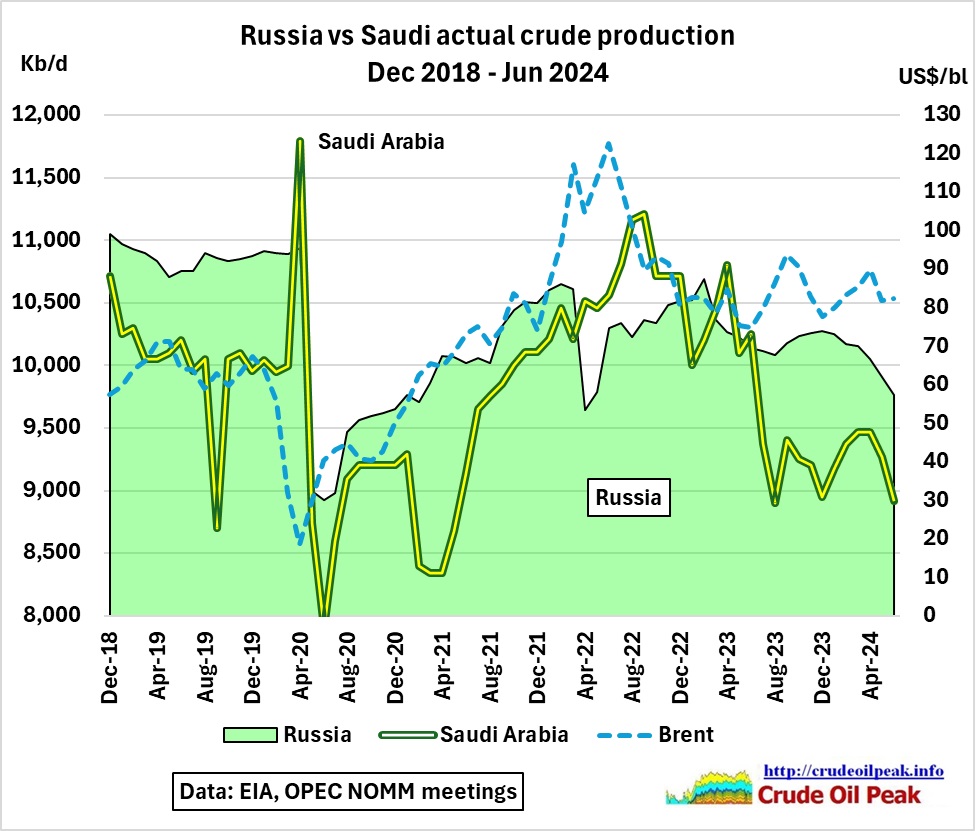 Fig 3: Comparison Russian – Saudi crude production
At the 9th OPEC meeting on 9/4/2020 it was decided to cut OPEC+ production by 10 mb/d for 2 months, then by 8 mb/d and 6 mb/d from Jan 2021. Russian reference production was reduced to 11,000 kb/d (equal to Saudi Arabia’s).
https://www.opec.org/opec_web/en/press_room/5882.htm
No detailed production table was provided but usually any general cut is shared between OPEC and Non-OPEC at the ratio of 2:1 and within these 2 groups proportional to individual reference production. This implies a Russian production cut of 2 mb/d
The 1st proper production table was released at the 13th ONOMM on 5 Jan 2021
https://www.opec.org/opec_web/en/press_room/6310.htm
From May 2020 throughout 2021 Russia produced more than the quota as the price of oil increased incl. Urals.
Just when the world started to get out of the acute phase of Covid in the 2nd half of 2021, Russia invaded Ukraine in February 2022, upsetting oil markets as sanctions and embargos were imposed. After March 2022, Russian oil production had little to do with quotas.
The IEA Oil Market Report of Feb 2022 notes on p 19
“And 2022 kicks off with Russia approaching capacity limits” (at 10,230 kb/d according to a table on the same page)
https://www.iea.org/reports/oil-market-report-february-2022
The EU ban on Russian crude imports and a G7 price cap on Russian seaborne crude exports at $60/bbl came into effect on 5 December 2022. However, this ban which reduced flows in the Druzhba pipeline, resulted in a redirection of crude exports to India and China.
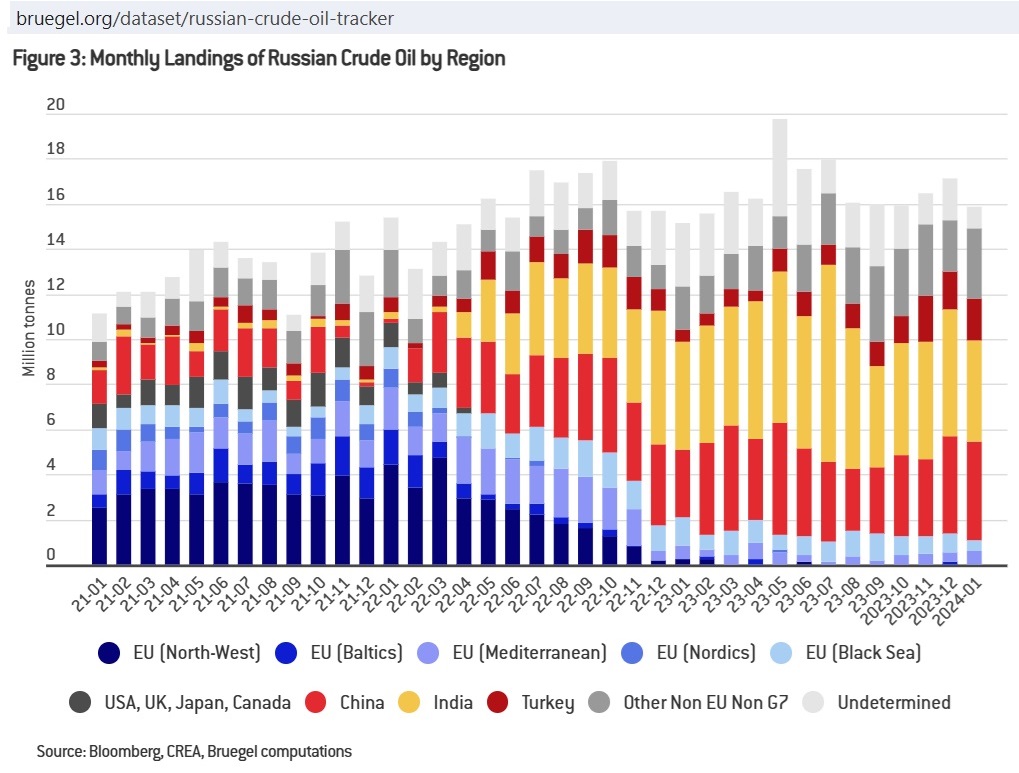 Fig 4: Change in destination of Russian crude exports (16 mt/month = 3.9 mb/d)
https://www.bruegel.org/dataset/russian-crude-oil-tracker
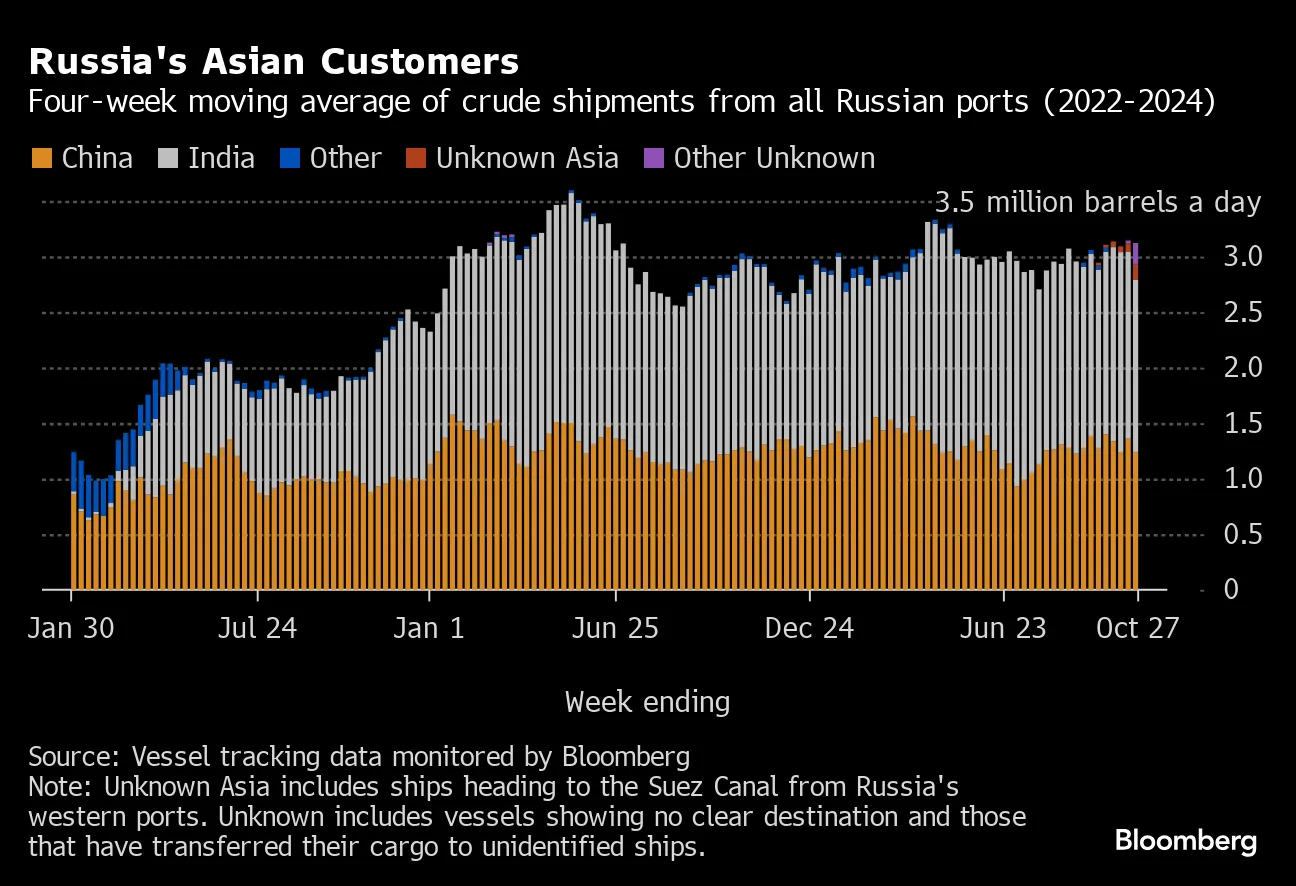
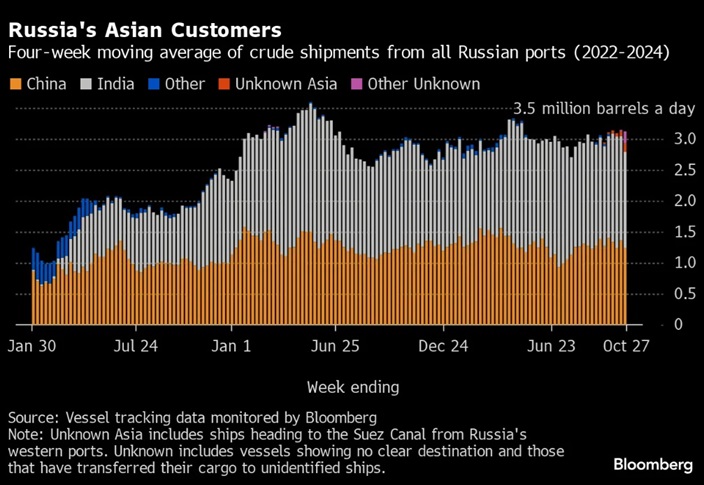 Fig 5: Russian seaborne crude exports to Asia
https://assets.bwbx.io/images/users/iqjWHBFdfxIU/iVcs1zzUNXNg/v0/-1x-1.webp
https://www.bloomberg.com/news/articles/2024-10-29/russia-s-oil-exports-advance-for-second-consecutive-week
And while we are at it, let’s have a look at 2 neighbouring CIS countries.
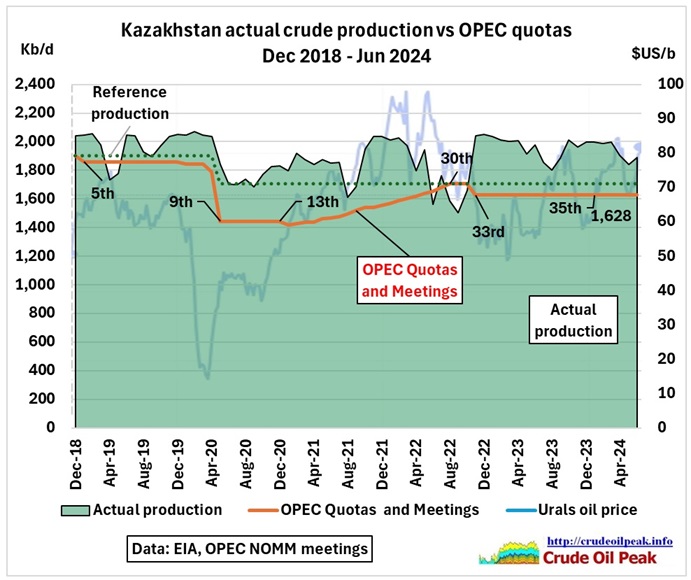 Fig 6: Kazakhstan crude production vs OPEC quota
Kazakhstan produced above quota for most of the time, up to +400 kb/d. Kazakh exports are highly dependent on the 1,500 km long CPC pipeline (Caspian Pipeline Consortium) to the Russian port of Novorossiysk (capacity 1.4 mb/d)
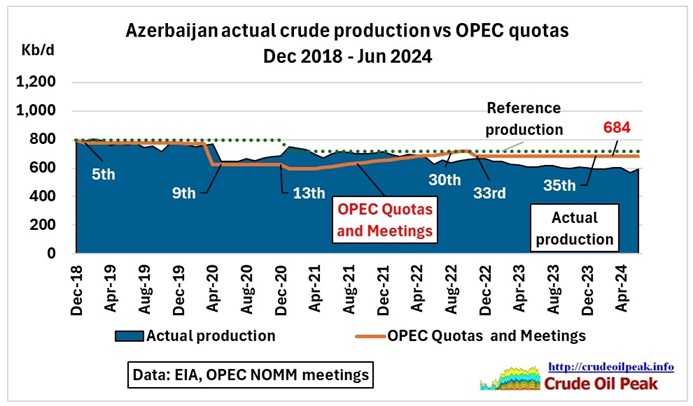 Fig 7: Azeri crude production vs OPEC quota
Actual production was lower than the quota by 100 kb/d
All together now.
Non OPEC 10 had a reference production of 18,320 kb/d in October 2018. The latest is 17,670 kb/d since May 2022 (19th ONOMM)
Using the information in all production tables we arrive at following graph:
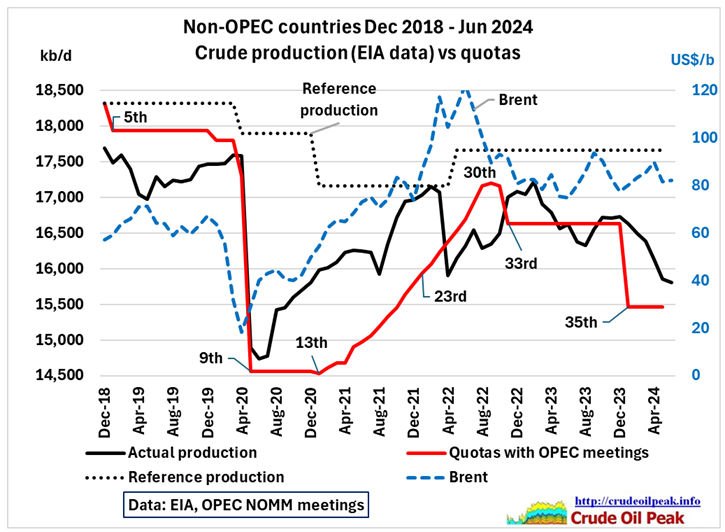 Fig 8: Non OPEC 10 actual crude & condensate production compared to OPEC quotas
We see that actual production is meandering around the quotas, sometimes higher, sometimes lower. Of course it was difficult to set quotas during the Covid19 period 2020-21. In the last year, production was again higher than quotas.
The required production levels for 2025 were set at the 37th ONOMM
https://www.opec.org/opec_web/en/press_room/7337.htm
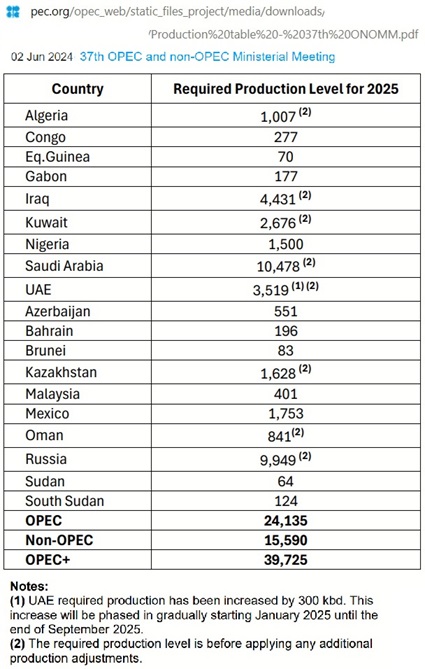 Fig 9: OPEC production table for 2025
So these graphs and tables will help us to understand the historical context for the next OPEC meetings with Russia, a country where the war economy is a new factor which will determine crude oil production and exports.