Here we go again. Another US President asks Saudi Arabia to pump more oil, despite the so-called US shale oil revolution.
 Fig 1: Is a tweet enough to make Saudi Arabia open its spigots?
We have to dig a little bit into history to see the context of this remarkable tweet whereby we have to switch between events and later, delayed analysis with the benefit of hindsight.
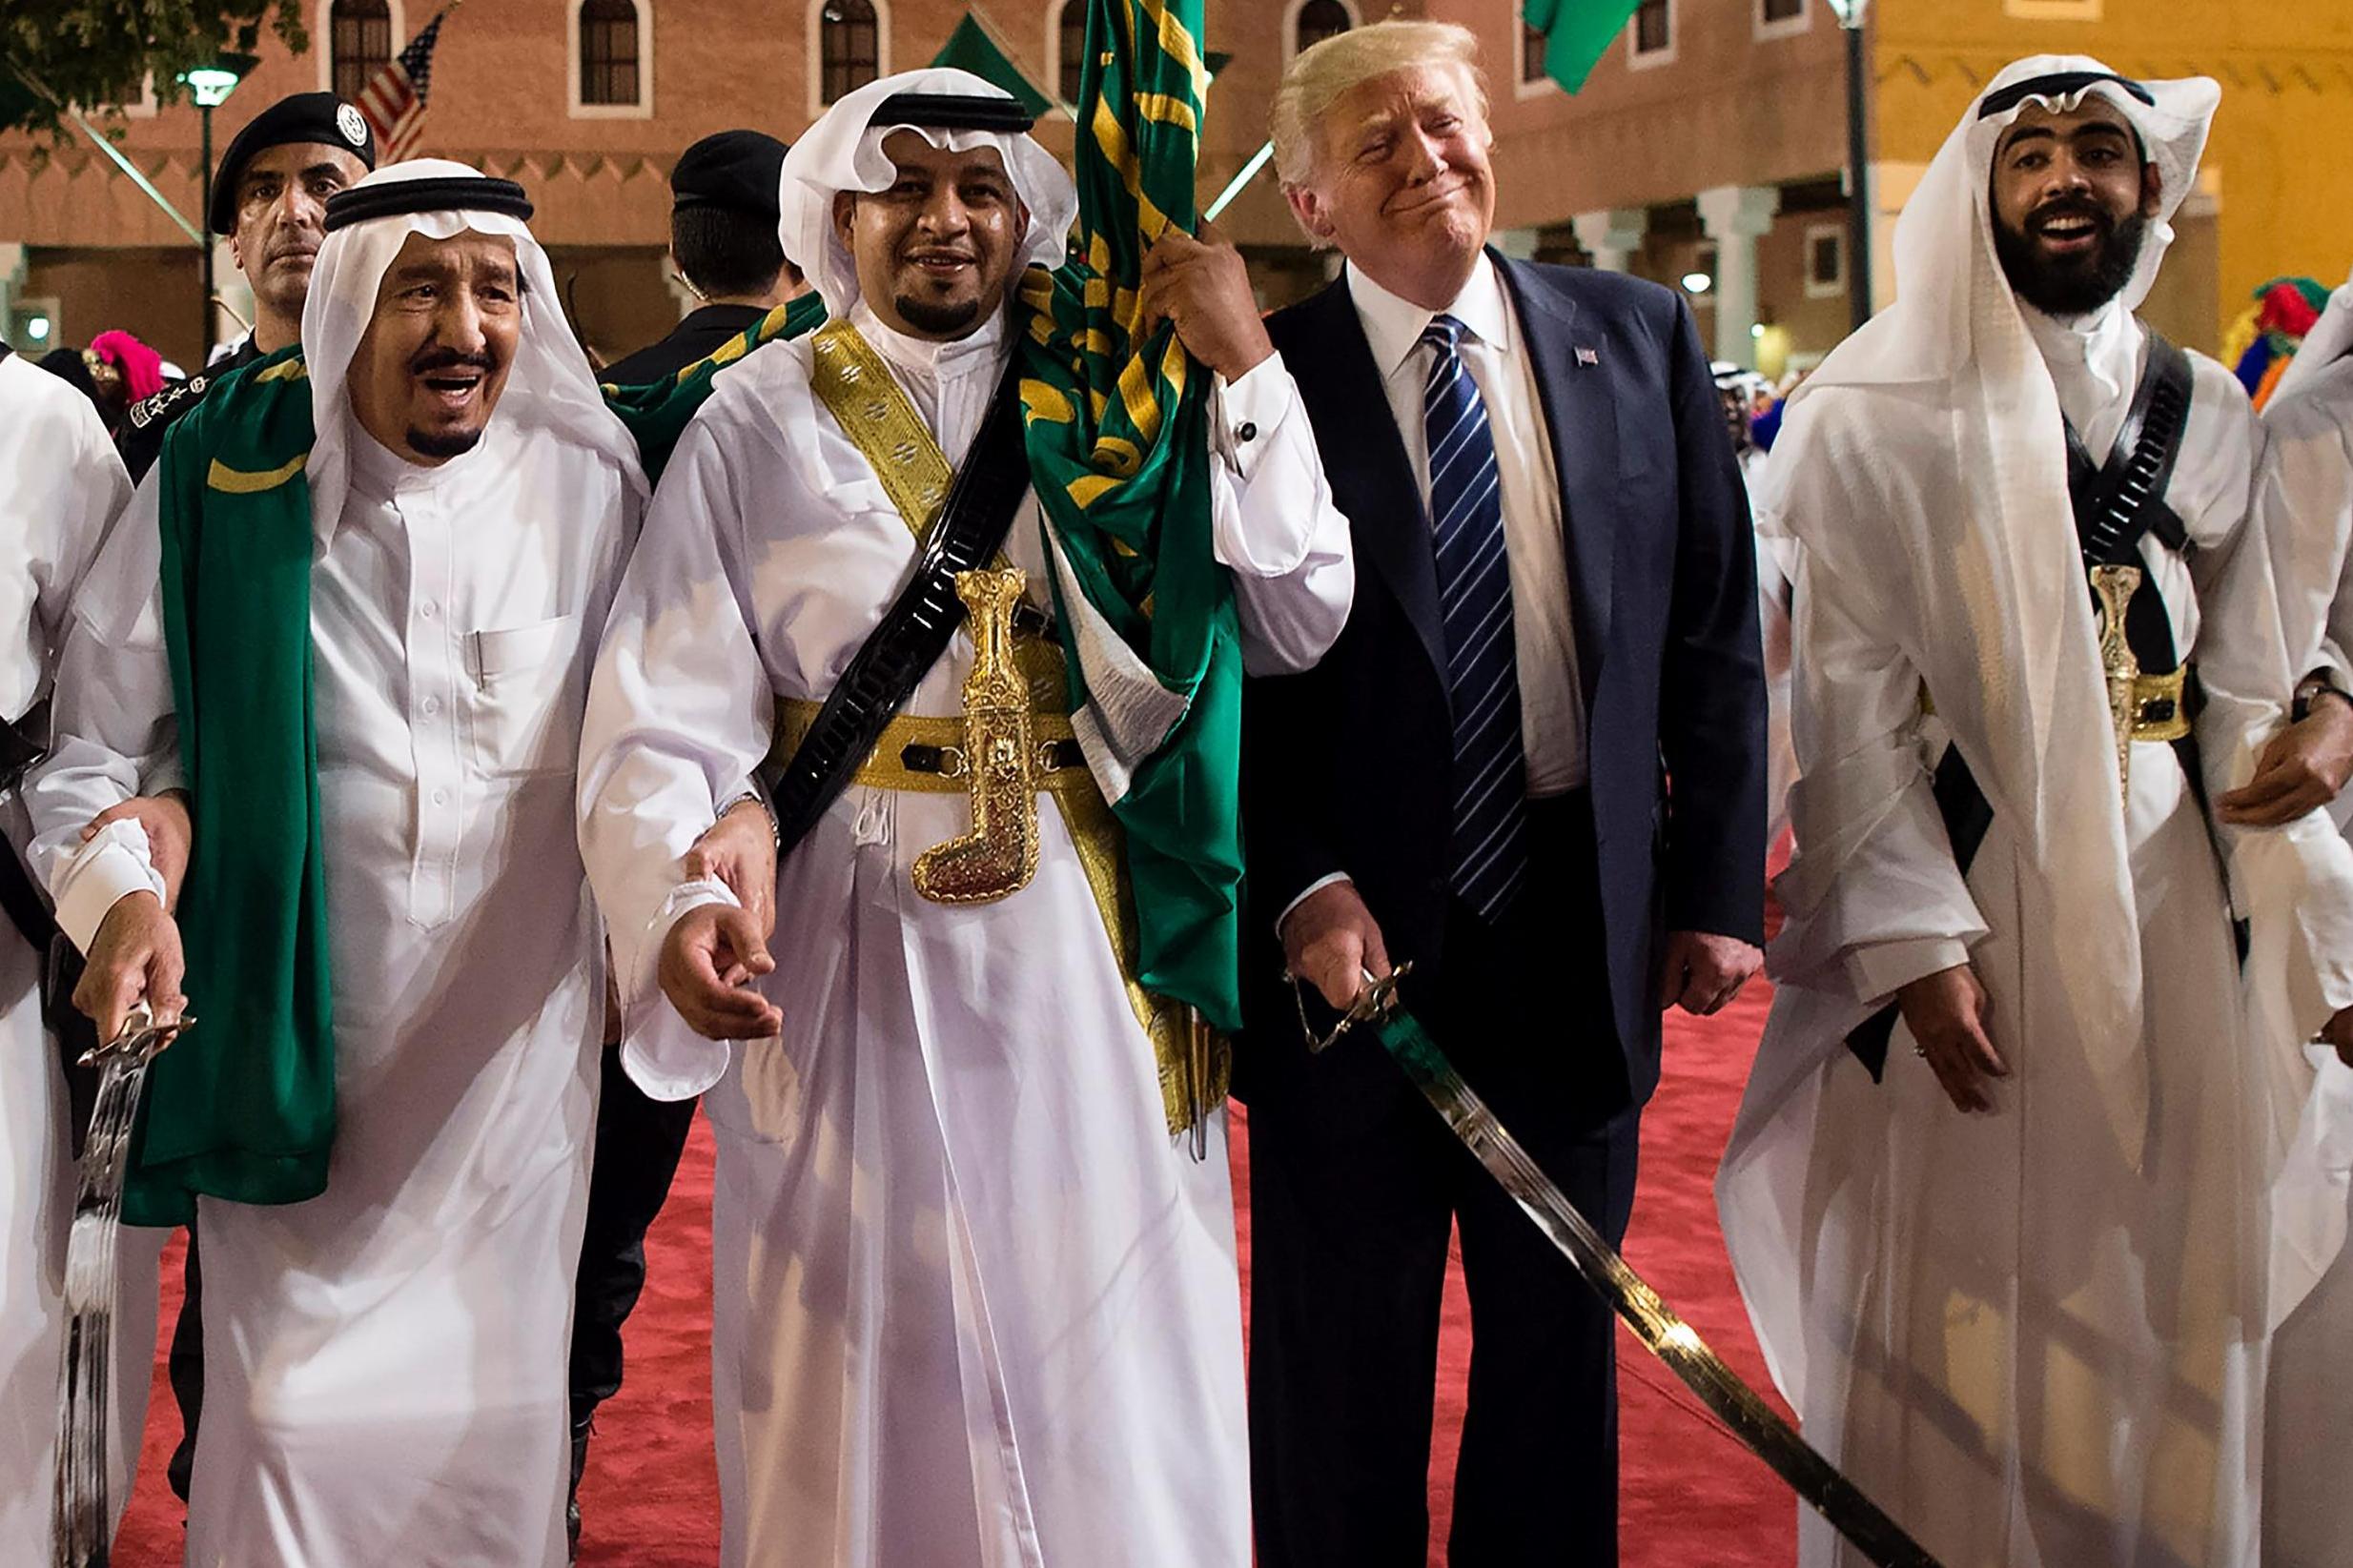
10 years ago GW Bush visited Saudi Arabia:
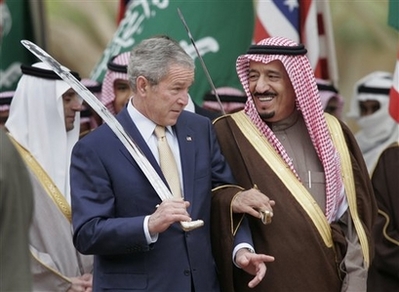
Fig 2: Sword dance in January 2008
https://www.huffingtonpost.com/bob-cesca/president-bush-shouldnt-p_b_81998.html
15 Jan 2008
“I will say to him [King Abdullah] that, ‘If it’s possible, your majesty, consider what high prices is doing to one of your largest customers,'” Bush said. “In other words, the worst thing that can happen to an oil-producing nation is that the price of oil causes the economy to slow down, because that will inevitably lead to fewer purchases [of oil].”
https://abcnews.go.com/Nightline/Politics/story?id=4136209&page=1
The above ABC News story includes a reference to an interview which co-anchor Terry Moran had with Bush who noted: “If they don’t have a lot of additional oil to put on the market, it is hard to ask somebody to do something they may not be able to do.”
The original video link is broken but the wording has been documented by Gail the Actuary (Atlanta, Georgia) in this Oildrum post.
Obviously, Bush had realized what was going on. 3 years earlier he had already tried it, when oil prices went through the $50 mark.
26 Apr 2005
CRAWFORD, Tex., April 25 – President Bush discussed the surge in oil prices with Crown Prince Abdullah of Saudi Arabia on Monday, but focused on a plan by the Saudis to increase their oil-pumping capacity over the next decade rather than on any short-term efforts to bring prices down.
Saudi Arabia’s plan, which it began discussing publicly weeks ago, calls for spending up to $50 billion to increase its maximum sustainable production capacity to 12.5 million barrels a day by 2009, and to 15 million in the subsequent decade, from about 10.8 million barrels now. The Saudis are currently pumping about 9.5 million barrels a day.
This was the plan:
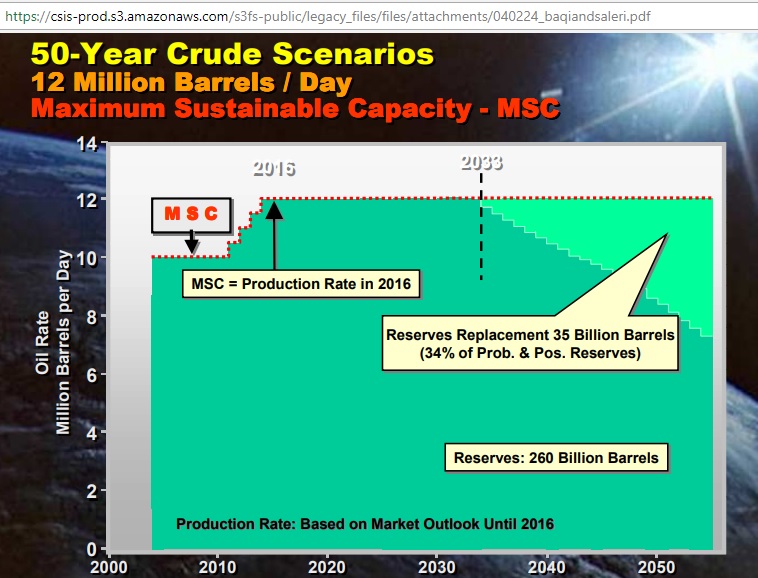
Fig 3: Saudi Aramco’s production scenario in February 2004 for 12 mb/d
https://csis-prod.s3.amazonaws.com/s3fs-public/legacy_files/files/attachments/040224_baqiandsaleri.pdf
This Saudi Aramco slide show was presented at the Centre for Strategic and Internatiaonl Studies (CSIS) right in Washington, by Mahmoud Abdul Baqi, vice president for exploration and Nansen Saleri, reservoir manager. The Synopsis even refers to 15 mb/d.
In the above graph, the dark green area is around 200 Gb and the decline in production from “proven reserves” after 2033 is 1.8% pa. Note that after 2033 probable and possible reserves are needed to continue at 12 mb/d. For a production level of 10 mb/d that point would move to 2042.
Plotting actual production into Fig 3 we get:
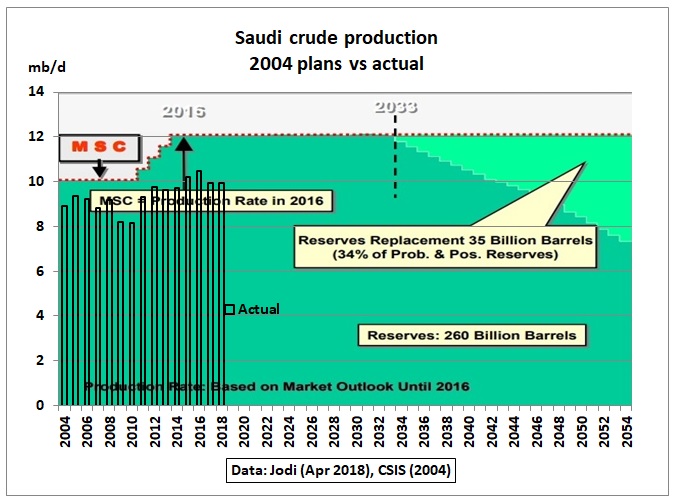
Fig 4: Comparison Saudi Aramco plans in 2004 with actual production
In July 2005, the Energy Information Administration of the US Department of Energy, published this table in its International Energy Outlook:
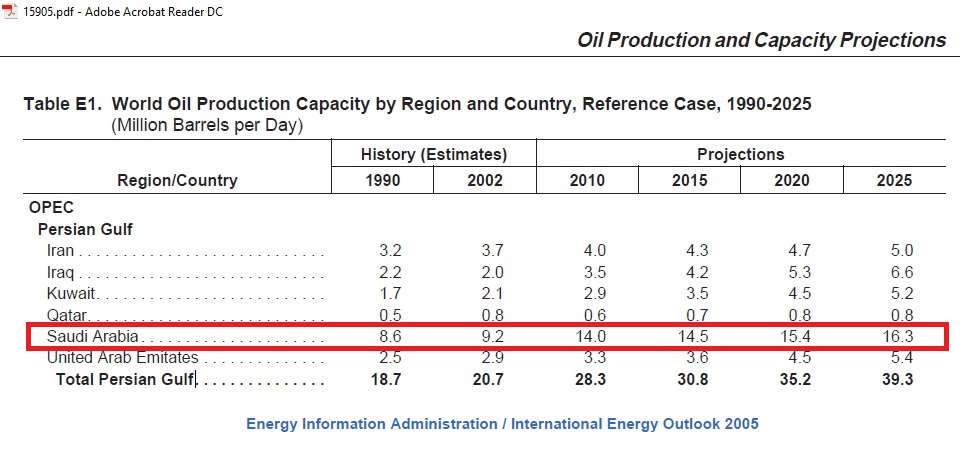
Fig 5: US Department of Energy’s 2005 reference case for the Persian Gulf
https://www.hsdl.org/?view&did=15905
The oil in the above table includes NGLs. Crude oil would be around 85% of the total. So 14 mb/d in 2010 were some 12 mb/d of crude oil when the MSC was still 2 mb/d less.
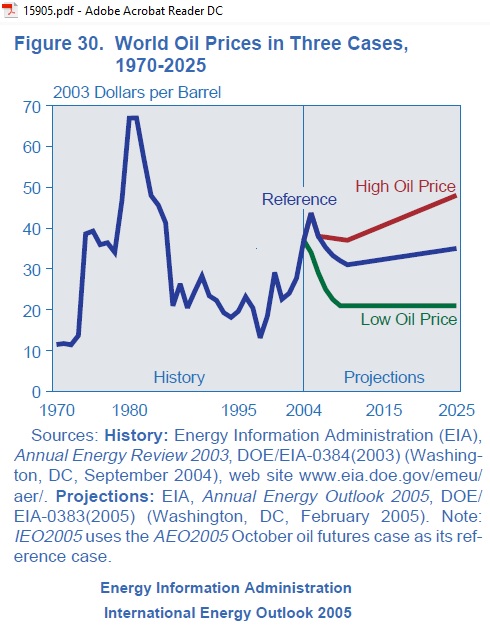 Fig 6: EIA oil price scenarios in 2005
The matching oil price for the reference Saudi production in 2025 was assumed to be $35/barrel in $2003 and $60/barrel in nominal dollars.
The International Energy Agency (Paris), not to be out-done in its WEO 2005, came up with a linear growth path for another 5 years until 2030:
 Fig 7: IEA projection in WEO 2005
https://www.iea.org/media/weowebsite/2008-1994/WEO2005.pdf
Almost 1 year before Bush’s 2008 Canossa walk to Riyadh, in February 2007, Dr. Nansen Saleri did another slide show for the annual conference CERAWeek of Cambridge Energy Research Associates in Houston, Texas, entitled “Peaks and Valleys: How assumptions shape the future of peak oil”.
https://www.aramcoexpats.com/articles/ceraweek-stresses-techs-role-in-supply/
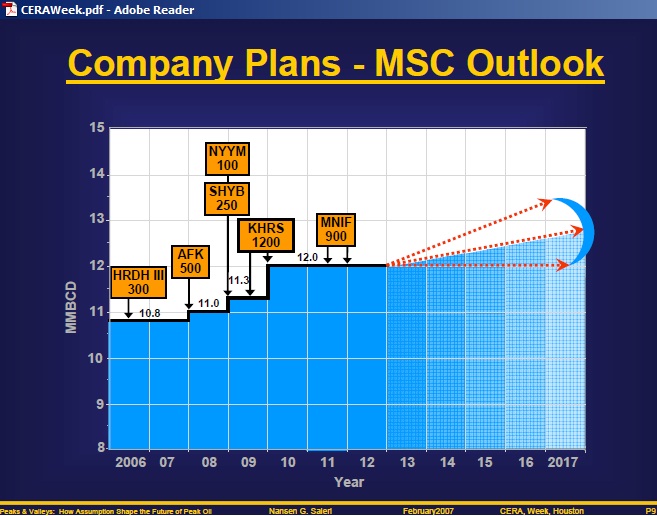 Fig 8: Saudi Aramco’s 2007 company plans
The above chart is a bit more detailed than the earlier 2004 version, showing the contributions in kb/d from various additional projects adding up to 3.25 mb/d while the maximum sustainable capacity increases by only 1.2 mb/d. The implied decline in existing fields is 2 mb/d over 6 years or around 300 kb/d pa.(3% pa). Note the aspirational trend toward 14 mb/d.
HRDH III – Haradh 3 – Southern flank of Ghawar (Arab Light, API 34)
AFK – Abu Hadriyah, Fadhili and Khursaniyah (Arab Light, API 34.7, 39, 30)
NYYM – Nuayyim (Arab Super Light)
SHYB – Shaybah (Arab Extra Light, API 42.5)
KHRS – Khurais (Arab Light, API 36)
MNIF – Manifa (Arab Heavy, API 29)
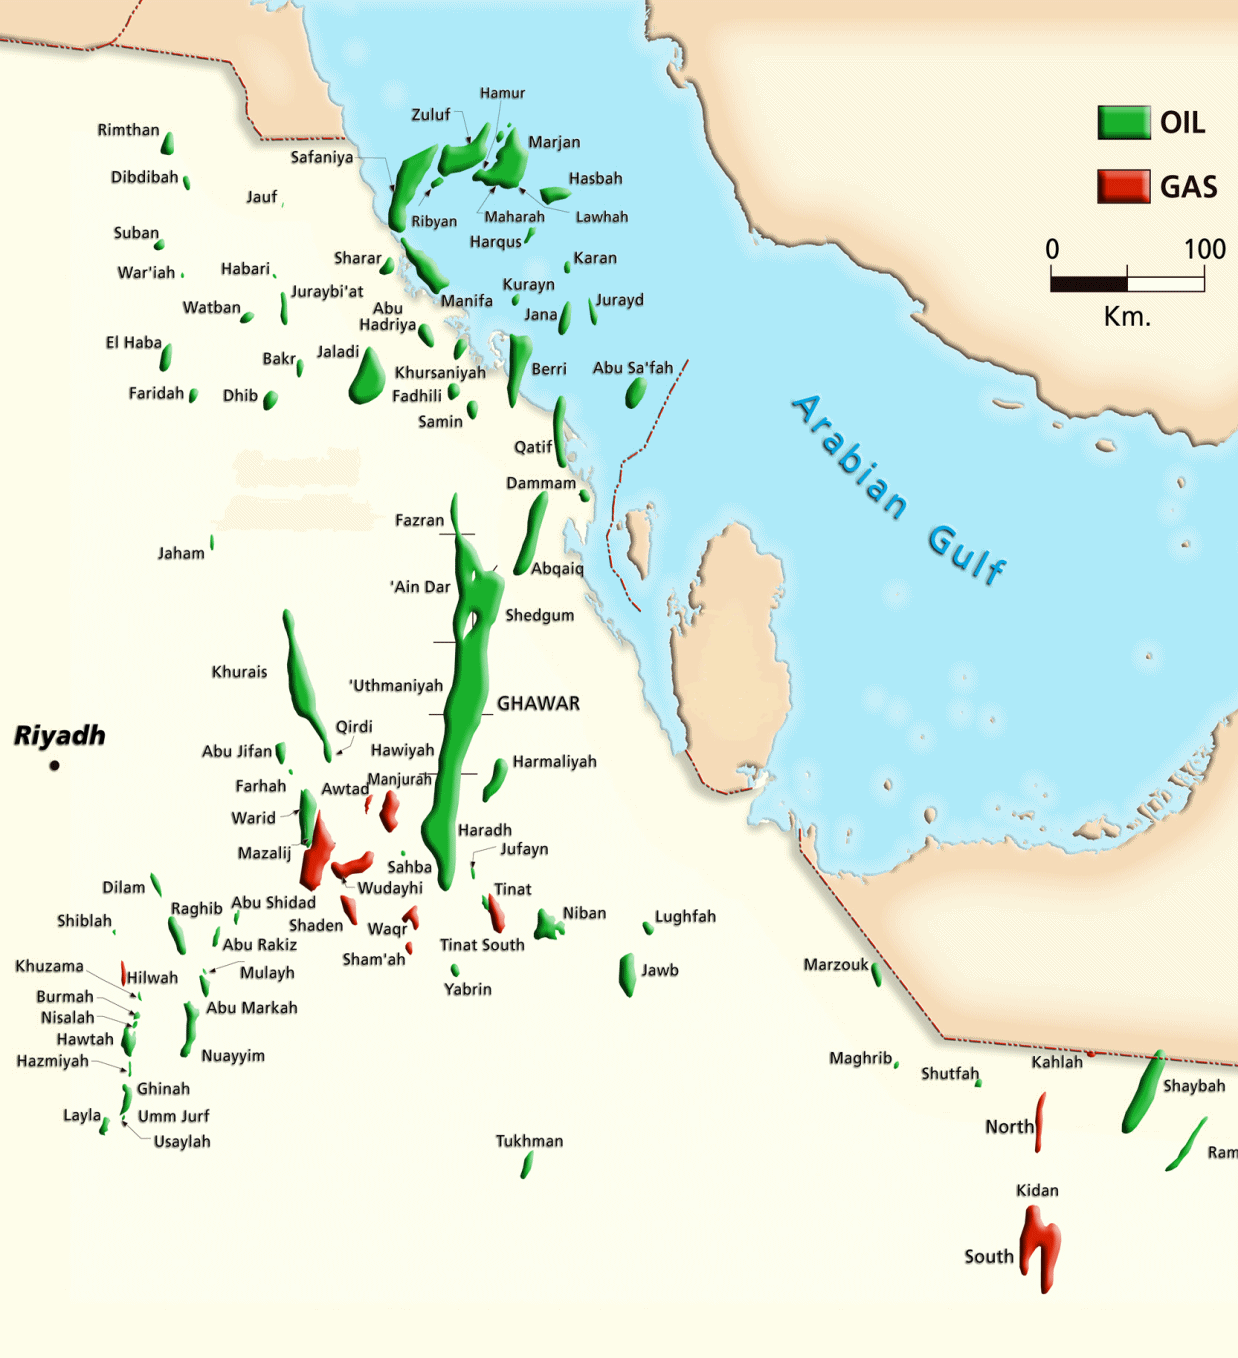 Fig 9: Saudi oil fields
So let’s compare the 2007 plan with actual production:
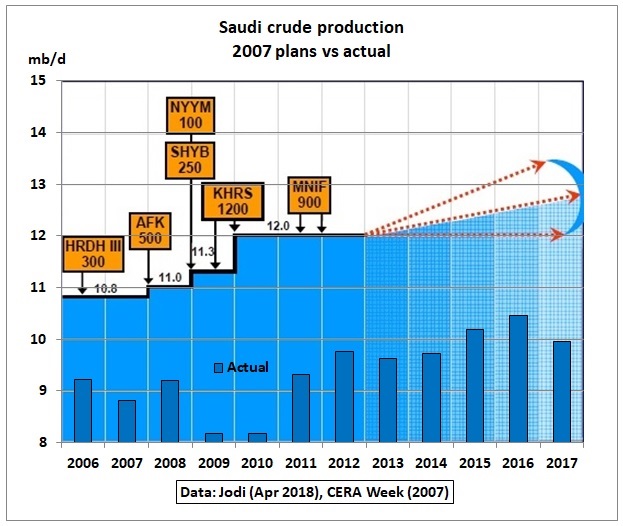 Fig 10: Comparison Saudi Aramco plans in 2007 with actual production
So the reality was much different from the 2004 and 2007 plans. Saudi crude production declined between 2005 and 2007, resulting in oil prices to increase. That caused the US recession end 2007. The following graph is a historical graph I posted in the Oildrum blog in October 2007, together with Gail The Actuary who is now running https://ourfiniteworld.com/
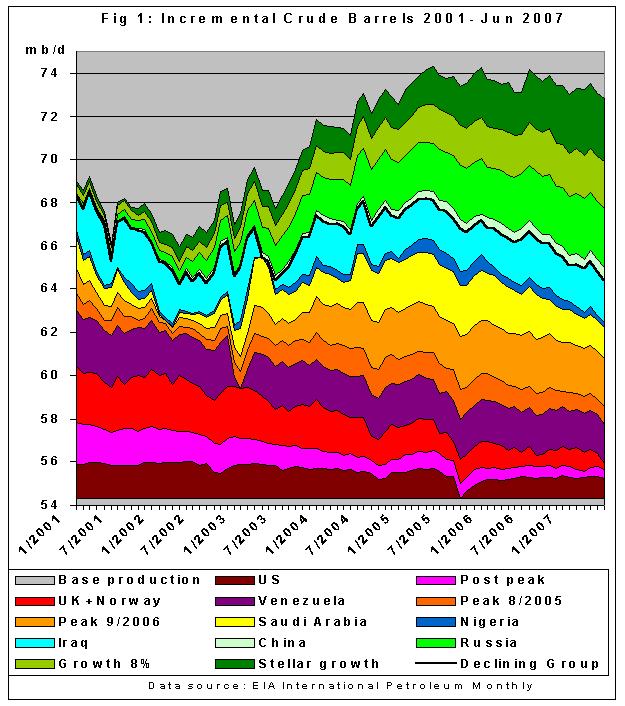 Fig 11: Impact of Saudi crude oil drop on global production 2001 – Jun 2007
http://www.theoildrum.com/node/3052
In the same year, in November 2007, US Embassy staff in Riyadh sent an important cable to Washington:
SUBJECT: FORMER ARAMCO INSIDER SPECULATES SAUDIS WILL MISS 12.5 MBD IN 2009
SUMMARY: On November 20, 2007, Consul General and Econoff met with Dr. Sadad al-Husseini, former Executive Vice President for Exploration and Production at Saudi Aramco. Al-Husseini, who maintains close ties to Aramco executives, believes that the Saudi oil company has oversold its ability to increase production and will be unable to reach the stated goal of 12.5 million b/d of sustainable capacity by 2009….
The former EVP added that sustaining 12 million b/d output will only be possible for a limited period of time, and even then, only with a massive investment program
https://www.theguardian.com/business/2011/feb/08/oil-saudiarabia?intcmp=239
Interesting that the Embassy interpretation was that of a speculation.
In an Oil&Money conference in London in October 2007 Sadad al-Husseini had reclassified 300 Gb of OPEC oil reserves as resources:
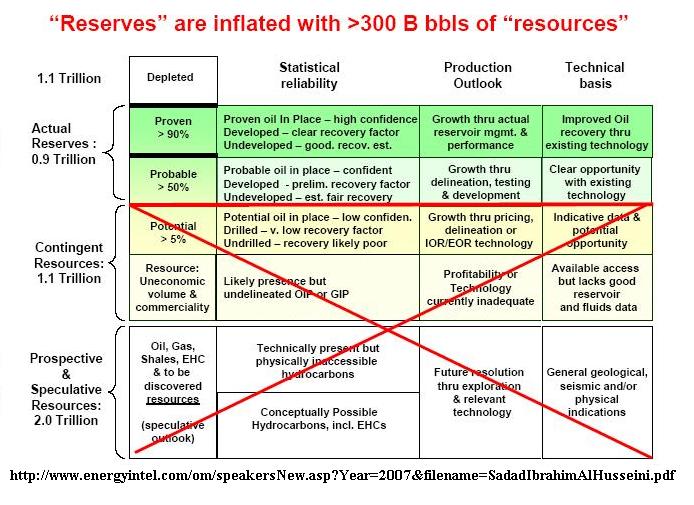 Fig 12: OPEC’s paper barrels from the 1980s quota wars
The warning, however, came too late. The US recession had already started. James Hamilton, Professor of Economics, University of California did this analysis:
Causes and Consequences of the Oil Shock of 2007-08
“Whereas historical oil price shocks were primarily caused by physical disruptions of supply, the price run-up of 2007-08 was caused by strong demand confronting stagnating world production….. Eventually, the declines in income and house prices set mortgage delinquency rates beyond a threshold at which the overall solvency of the financial system itself came to be questioned, and the modest recession of 2007:Q4-2008:Q3 turned into a ferocious downturn in 2008:Q4.”
http://econweb.ucsd.edu/~jhamilto/Hamilton_oil_shock_08.pdf
While Matt Simmons’ oil production estimates in his 2005 book “The Coming Saudi Oil shock and the World Economy” were much too pessimistic his warning was justified.
Additional Chinese oil demand for the Olympic games in August 2008 was also a contributing factor for the 2008 oil price shock.
In February 2011, when the civil war broke out in Libya and Saudi Arabia was asked to offset Libyan oil production losses the above Wiki Leaks cable was published by the Guardian. Prof. Kjell Aleklett describes this in his book “Peaking at Peak Oil”, chapter 13, p 184.
The following post done at the time shows how declines in Saudi oil fields fit into Saudi Aramco’s 2007 plan (Fig 8), together with incremental production increases and theoretical capacities.
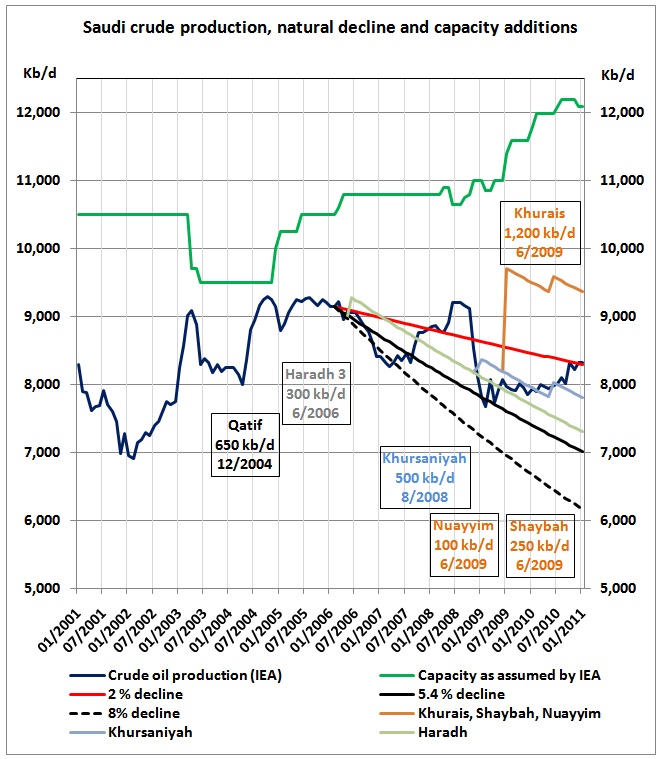 Fig 13: Saudi decline trends and additional projects vs max capacity
More details are here:
2/3/2011 WikiLeaks cable from Riyadh implied Saudis could pump only 9.8 mb/d in 2011
http://crudeoilpeak.info/wikileaks-cable-from-riyadh-implied-saudis-could-pump-only-9-8-mbd-in-2011
An updated (+Manifa) and simplified graph of Fig 13 can be found in this recent article:
Can Saudi Arabia Prevent The Next Oil Shock?
11 June 2018
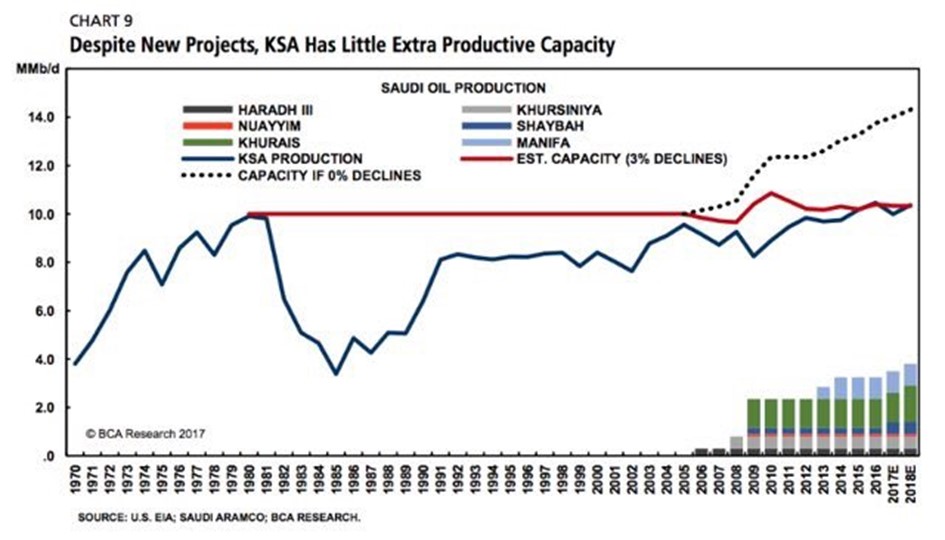 Fig 14: Saudi Arabia’s production capacity and additional projects
https://oilprice.com/Geopolitics/International/Can-Saudi-Arabia-Prevent-The-Next-Oil-Shock.html
The above graph shows that Saudi production capacity has basically remained flat as additional projects have just offset decline in existing fields.
Fighting over oil terminals in Libya has started again.
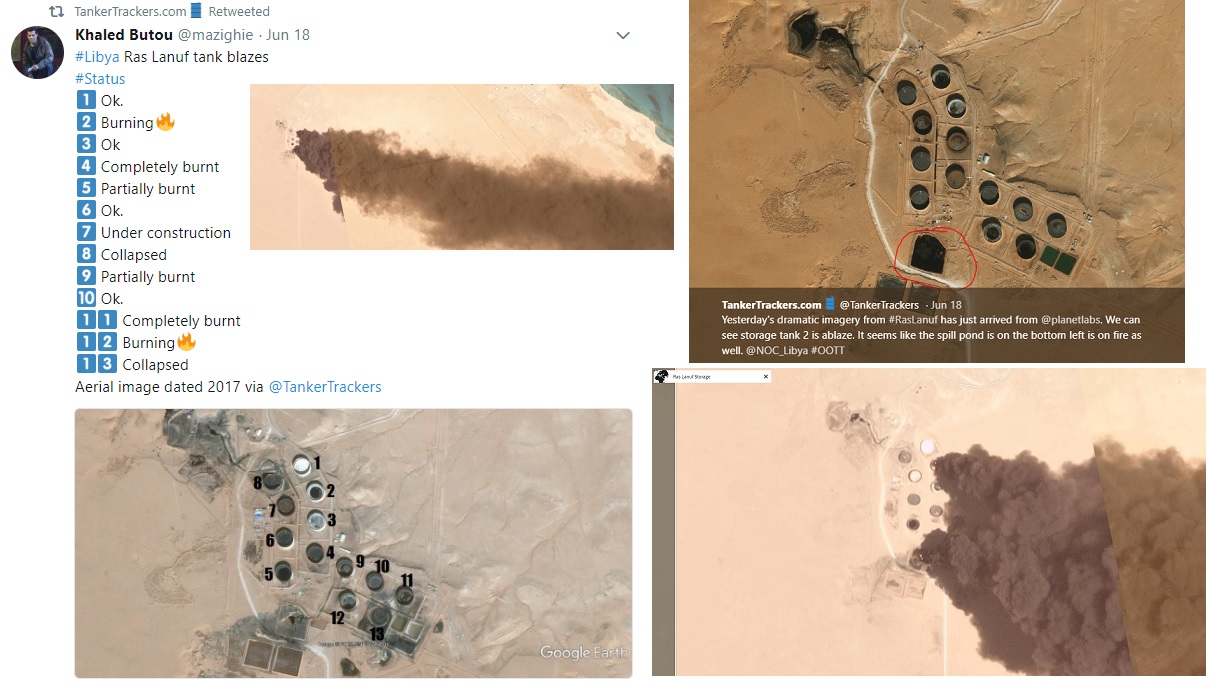 Fig 15: Tanker trackers assessment of damage to Ras Lanuf oil storage tanks
https://twitter.com/TankerTrackers
Back to square one.
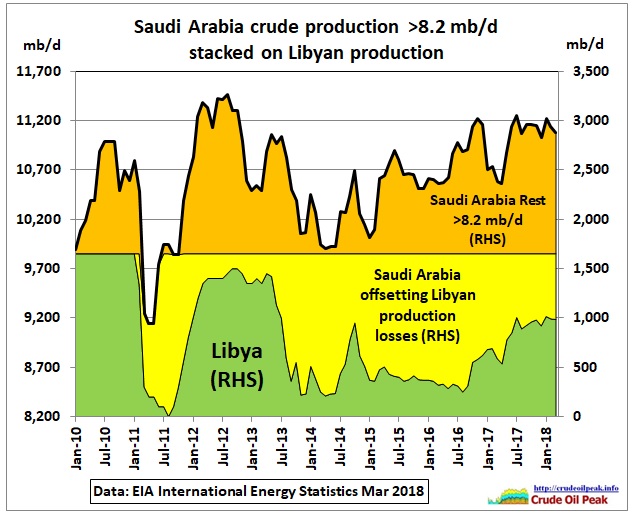 Fig 16: Saudi and Libyan crude production
Starting with Saudi crude production of 8.2 mb/d in January 2010, the yellow area depicts Saudi production nominally (that is without considering oil grades) replacing Libyan production losses. The orange area represents production exceeding 8.2 mb/d and additionally available (6 year average around 900 kb/d). So if Libyan oil production drops again over several months, the same 2011 problem comes back, only at a higher Saudi production level, closer to an uncertain production capacity.
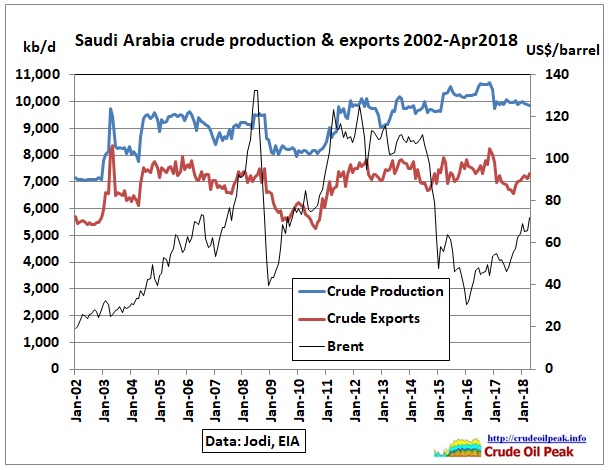 Fig 17: Saudi crude production and exports vs oil prices
Conclusion:
President Trump (or any other future US President) will have to attend several more sword dances to get the Saudis to sustainably pump more oil.
 May 2017