In the year 2005, the global crude production curve shows a definitive kink, going horizontal for several years. This caused the 2008 oil price shock and the following financial crisis which permanently damaged the world economy. It was the first phase of peaking oil production, a foretaste of what is to come.
 Fig 1: World crude and condensate production
There are many ways one can stack production from all these countries. The order chosen here is – from bottom to top:
A. Steadily declining after 2005 (group Mexico – Ecuador)
B. Growing after 2005 but then peaking and declining
C. Production in 2018 higher than in 2005
D. Middle East – Persian Gulf
E. Iraq
F. United States
(A) Group steadily declining after 2005
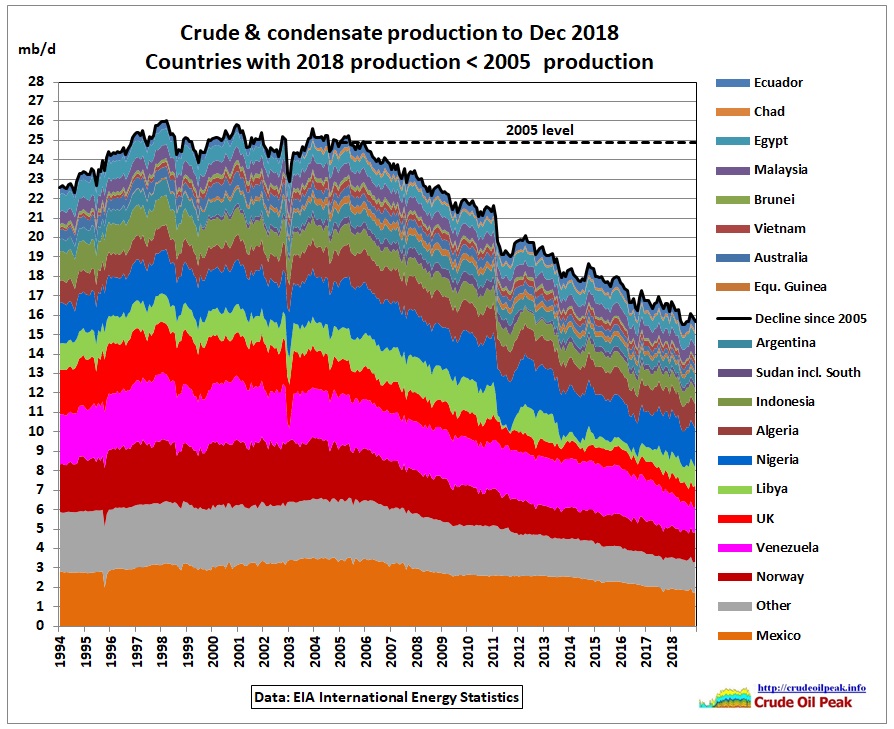 Fig 2: Declining group
Production has fallen now to 15.7 mb/d (last 6 months of 2018) compared to 24.9 mb/d in 2005. Some of the decline is a result of ethnic and/or geopolitical confrontations which are often related to oil. Sudan is a typical example:
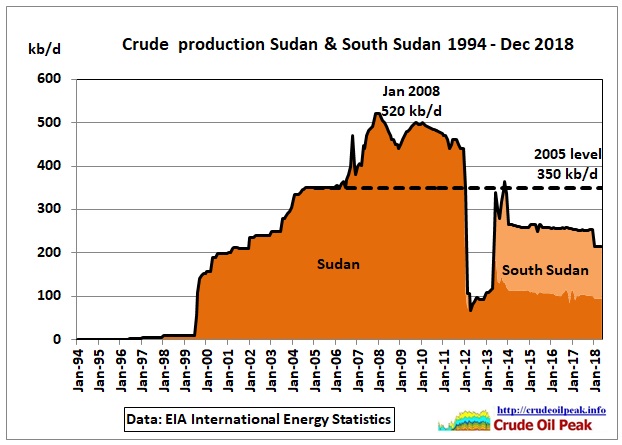 Fig 3: Separation of Sudan and South Sudan
Civil wars always reduce production, especially after the peak.
(B) Group growing after 2005 but then peaking and declining
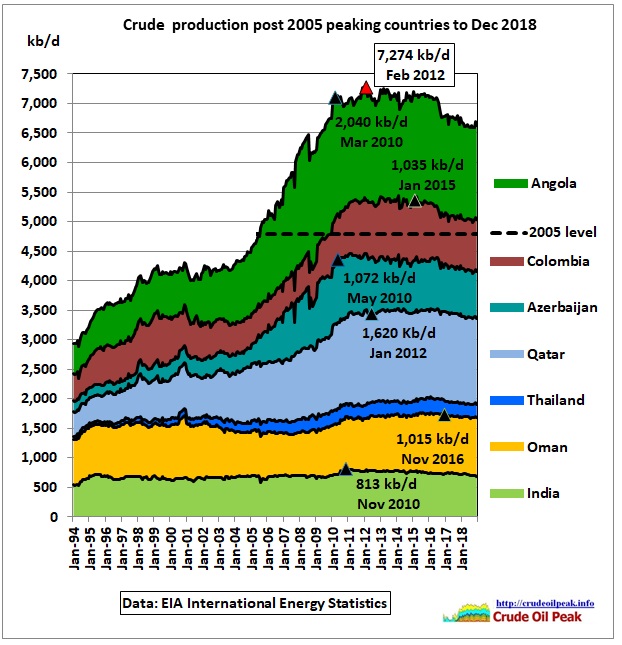 Fig 4: Group with peak after 2005
Black triangles denote monthly production peaks in each country. Annual peaks may be different. Production went down from a maximum of 7.2 mb/d in Feb 2012 to 6.6 mb/d in 2018.
6/12/2018 Qatar peak oil
http://crudeoilpeak.info/qatar-peak-oil
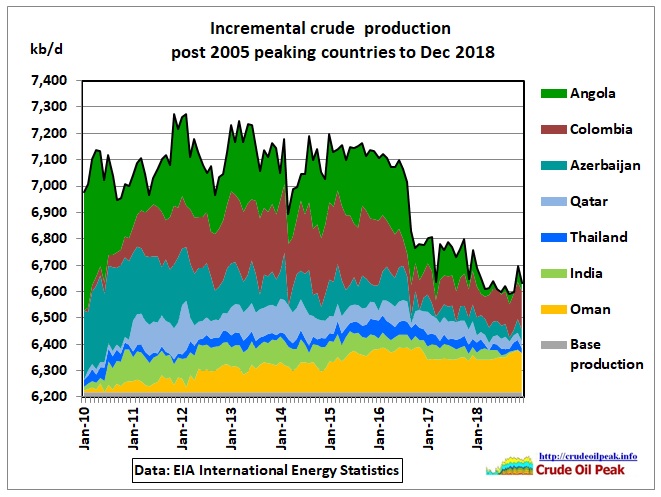 Fig 5: As Fig 4 but incremental production
Incremental production shows details more clearly. It is the production above the minimum of each country which is accumulated in the “base production”. The main contribution of the decline comes from Azerbaijan, Colombia and Angola. The peak in Angola is important because 12 % of China’s crude imports come from Angola.
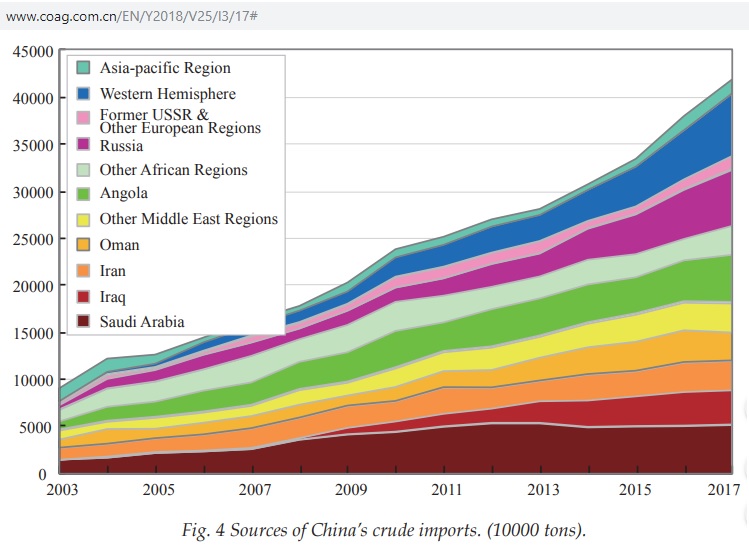 Fig 6: China’s crude oil imports
http://www.coag.com.cn/EN/Y2018/V25/I3/17#
(C) Group production in 2018 higher than in 2005
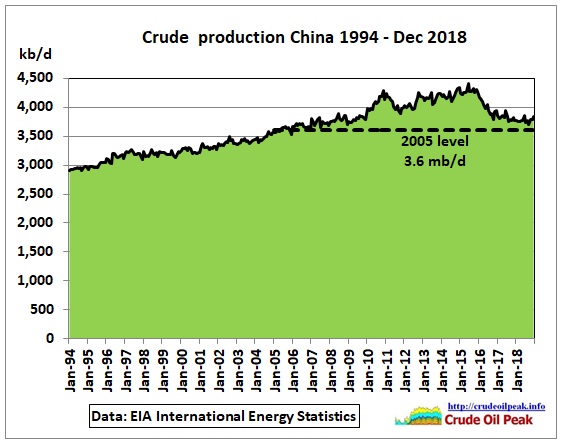 Fig 7: China crude production
China has peaked in 2015. Production is still a bit higher than in 2005. The IEA reports in its April 2019 oil market report following efforts to increase/maintain production in 2019 with higher CAPEX compared to 2018
PetroChina: +40 kb/d (CAPEX $34 bn, up 17%)
Sinopec: 0 kb/d (CAPEX $8.8 bn, up 41%)
CNOOC: “very slightly higher” (CAPEX $11.9 bn, up 20%)
That gives us an idea how costly the post-peak-oil battle will be. Here is an example:
 Fig 8: Bohai Bay offshore production
How about China going for tight oil? It’s a drop in a big bucket:
Morgan Stanley expects Chinese shale oil production could reach between 100,000 bpd and 200,000 bpd by 2025
https://oilprice.com/Energy/Crude-Oil/Chinas-Oil-Industry-Braces-For-Worst-Case-Trade-War-Scenario.html
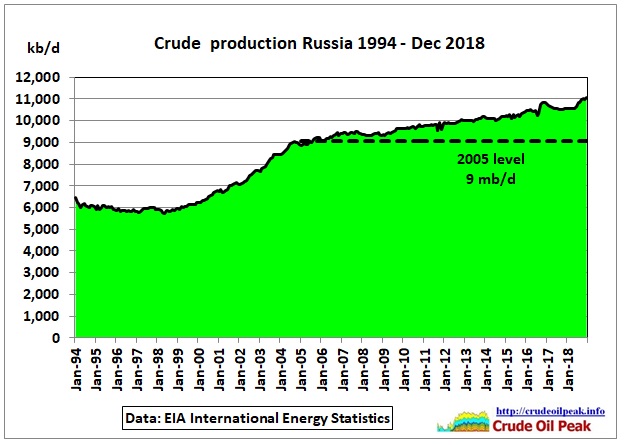 Fig 9: Russia
After the West Siberian peak in the mid 80s and the collapse of the Soviet Union production went down to 6 mb/d and then increased again to previous levels. However, there is a clear kink in the production curve in 2005
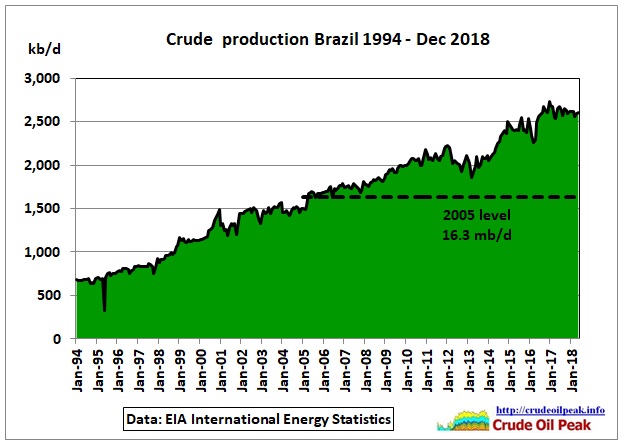 Fig 10: Brazil crude production
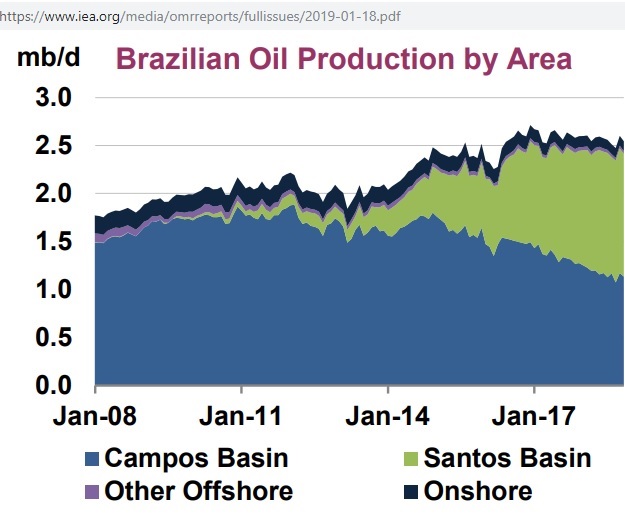 Fig 11: Brazil Campos and Santos (pre-salt) Basins
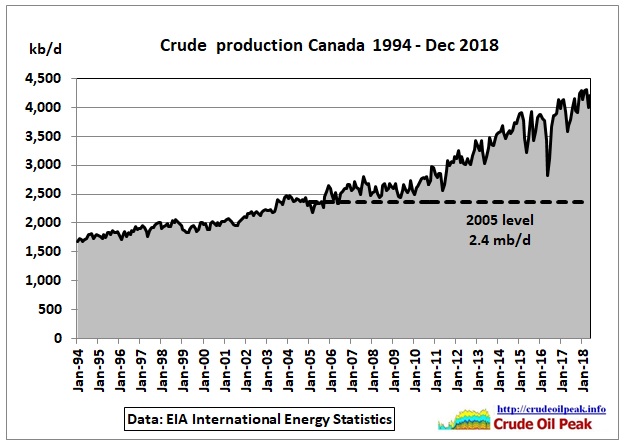 Fig 12: Canada crude production
The increase is mainly from tar sands as shown in the next graph:
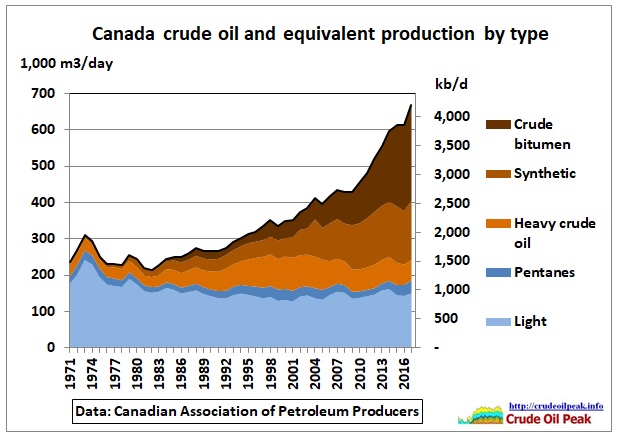 Fig 13: Canadian oil production by type
https://www.capp.ca/publications-and-statistics/crude-oil-forecast
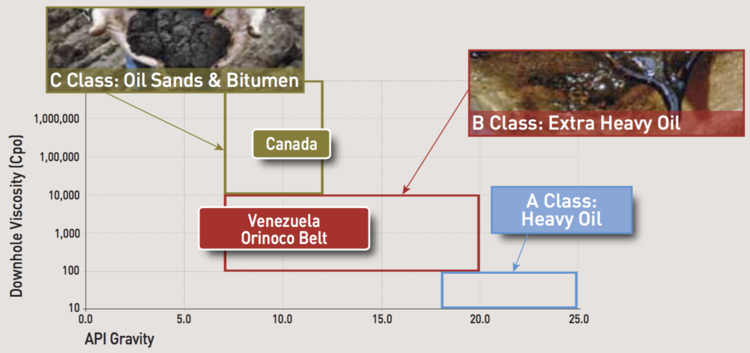 Fig 14: Difference between Canadian tar sands and Orinoco extra heavy oil
https://www.oilsandsmagazine.com/news/2016/2/15/why-venezuela-is-albertas-biggest-competitor
JAMES HANSEN: “If we introduce the tar shale and tar sands as a source and exploit those resources to a significant extent, then the [CO2] problem becomes unsolvable.”
http://www.publications.parliament.uk/pa/cm201314/cmselect/cmenvaud/uc60-i/uc6001.htm
(D) Middle East – Persian Gulf
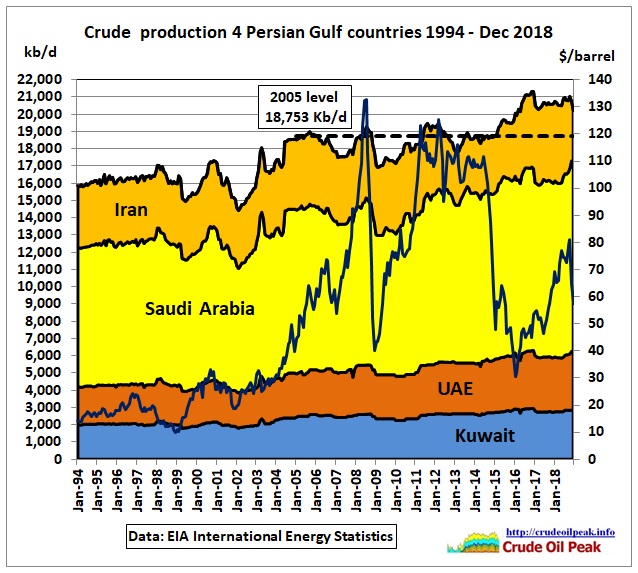 Fig 15: 4 Persian Gulf countries
Important years:
2005 – mid 2007 Saudi oil production declines. High oil prices cause US recession
End 2007 – mid 2008 Saudi production increase comes too late and is too little for Chinese Oilympic demand peak
2009 Financial system crashes and Saudis adjust to weaker oil demand
2/3/2011
WikiLeaks cable from Riyadh implied Saudis could pump only 9.8 mb/d in 2011
http://crudeoilpeak.info/wikileaks-cable-from-riyadh-implied-saudis-could-pump-only-9-8-mbd-in-2011
2012-2015 Iran sanctions
(E) Iraq
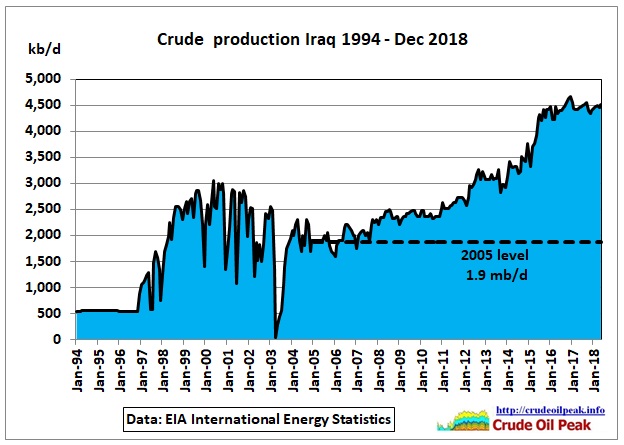 Fig 16: Iraq
This increase was the objective of the 2003 Iraq war. But it came too late and prices went up as shown in Fig 1.
16/3/2013 Iraq war and its aftermath failed to stop the beginning of peak oil in 2005
http://crudeoilpeak.info/iraq-war-and-its-aftermath-failed-to-stop-the-beginning-of-peak-oil-in-2005
Iraq is also important for China as its imports from there have been growing
(F) United States
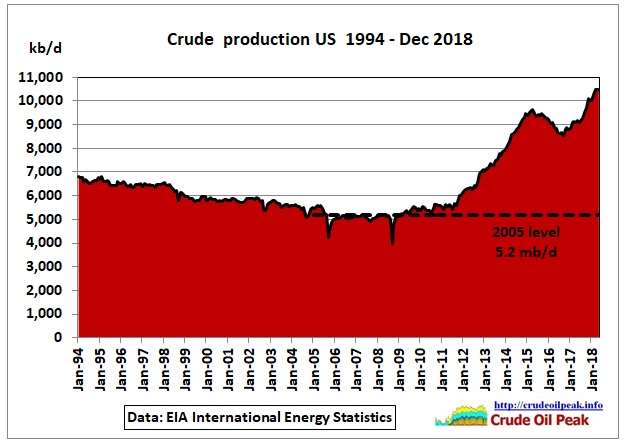 Fig 17: US crude production
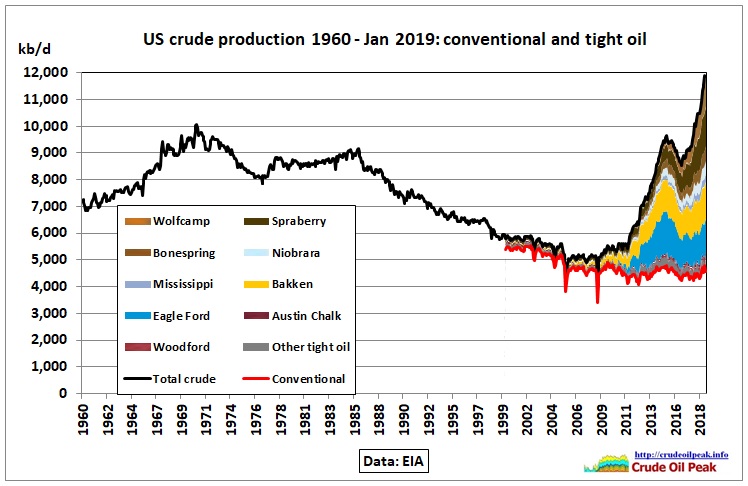 Fig 18: US conventional vs shale (tight) oil
The EIA predicts further shale oil growth but this may be too optimistic, especially if there is another credit crunch or oil prices go too low because of a global recession.
The Norwegian consultancy Rystad Energy calculated that only 10% of US shale oil companies are cash flow positive:
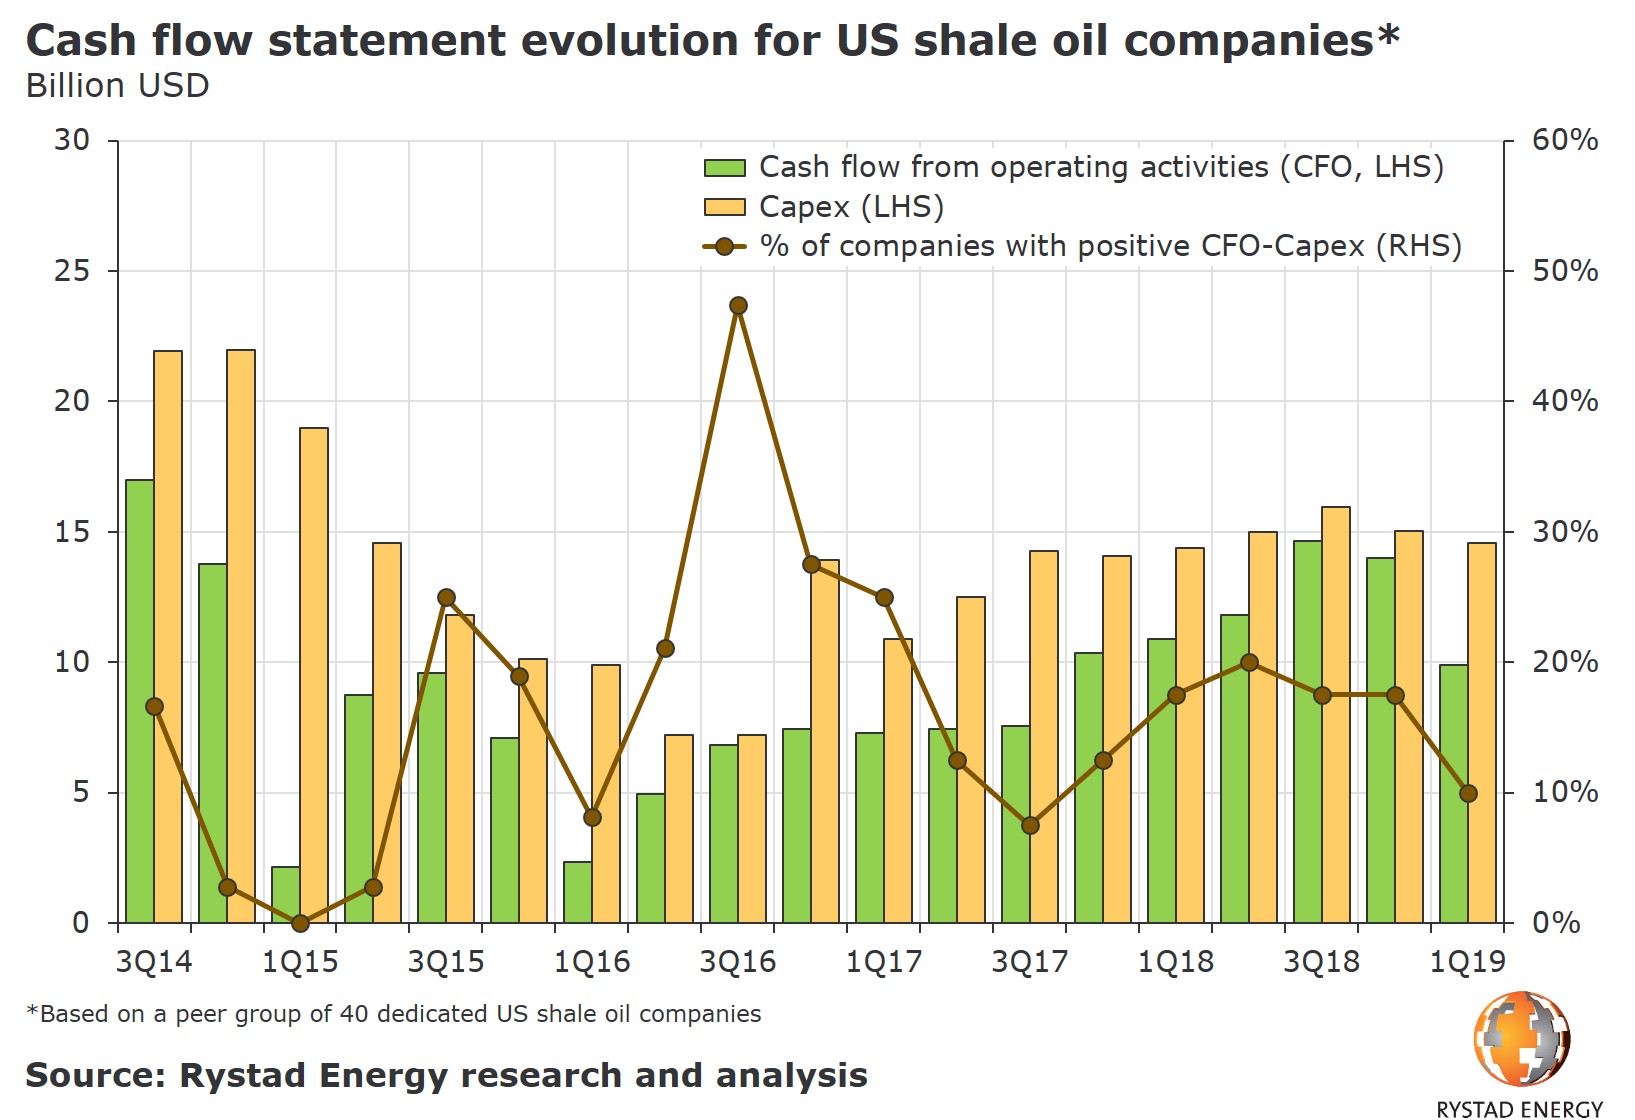 Fig 19: Cash flow and CAPEX of US shale oil companies
https://www.rystadenergy.com/newsevents/news/press-releases/Just-10-percent-of-shale-oil-companies-are-cash-flow-positive/
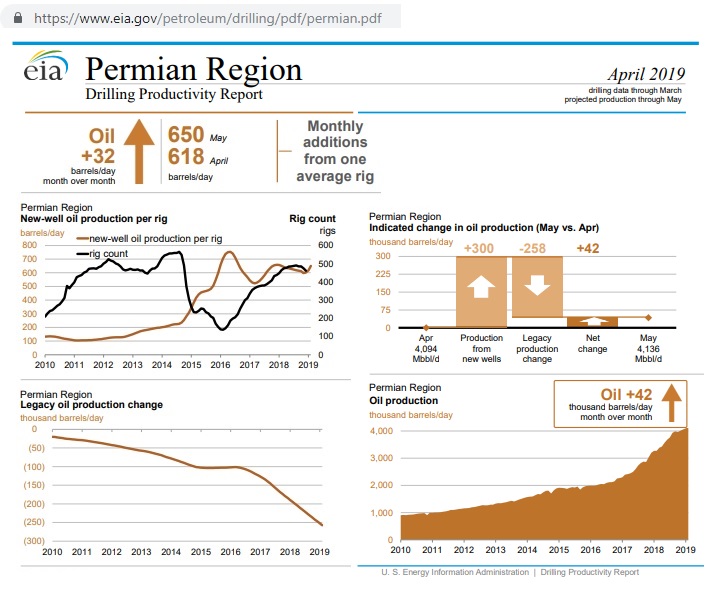 Fig 20: Permian drilling for shale oil
Monthly increase of production from new wells: 300 kb/d. Decline in same period: -258 kb/d. Net result is +42 kb/d. This poor efficiency of 42/300= 14% cannot last long.
Conclusion:
When US shale oil peaks and Iraq can no longer increase production there will be some surprises for a complacent world which should have used the 2008 oil price shock as a warning to get away from oil – voluntarily.