On hot days the truth comes out. Critical power plants for peak demand run on gas and that was short in supply, not only in South Australia, but also in NSW, as was shown in this previous post.
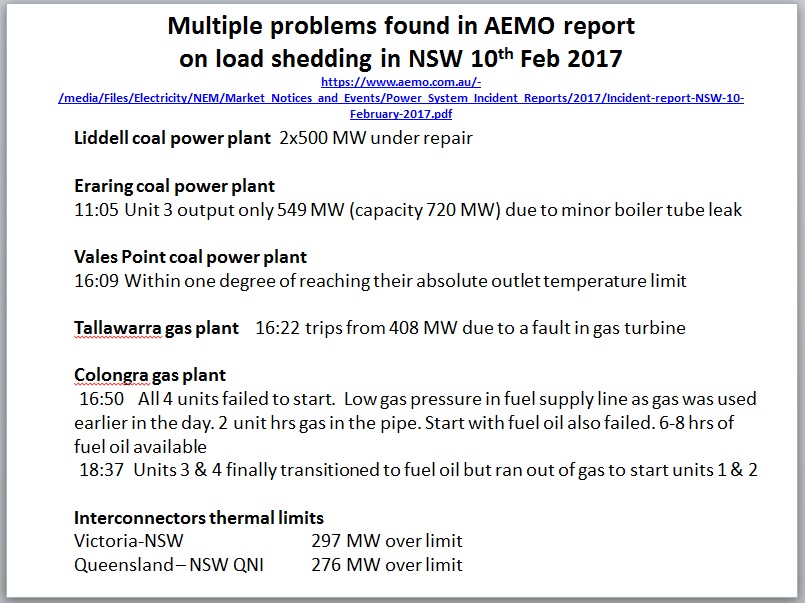 Fig 1: Gas shortage contributed to multiple systems failure
The above information is taken from AEMO’s website POWER SYSTEM OPERATING INCIDENT REPORTS
with this incident report for the 10th of February.
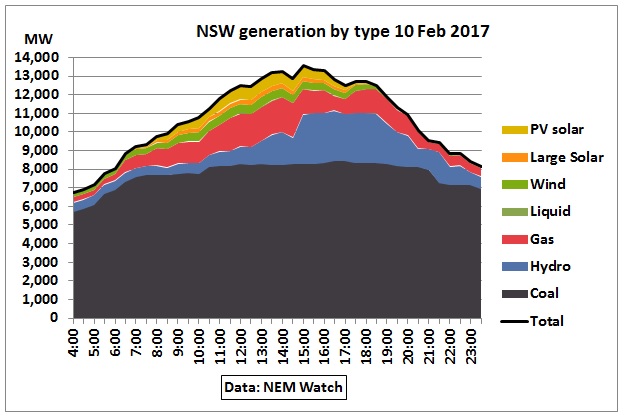
Fig 2: Electricity generation by fuel in a heat wave
In Fig 2 we can see the dependency of the power supply on gas.
In AEMO’s Gas Statement of Opportunities March 2017 we find a graph with declining gas production from proved and probable reserves, together with this statement:
“AEMO’s analysis highlights that these domestic gas markets will rely on production from currently uneconomic and undeveloped gas resources (contingent resources) from 2021, and even more uncertain resources (prospective resources) from 2025, to meet forecast demand over the 20-year outlook period.”
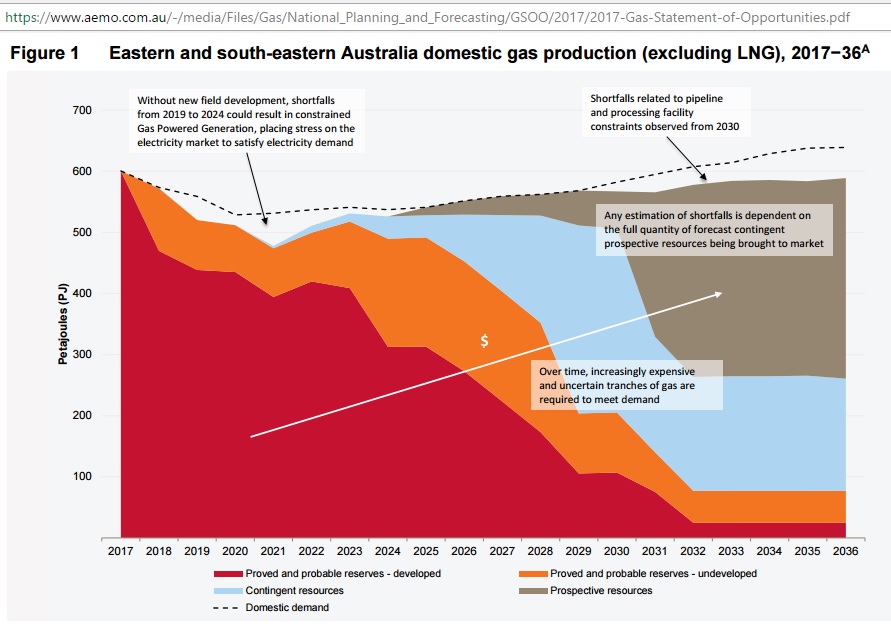
Fig 3: Domestic gas production profile from conventional sources,
compiled i.a. on the basis of advice from producers
“For the purposes of GSOO modelling, AEMO has assumed that all LNG demand will be met and that GPG [Gas Powered Generation] will be a lower priority for gas supply. In its modelling, AEMO has assumed that, if gas was unavailable for electricity generation, another fuel type (such as coal-fired or hydroelectric generation) could be substituted – an assumption likely to be increasingly challenged as the electricity supply demand balance tightens.”
“Industry data shows that the rate of exploration and development of oil and gas wells recently drilled in Australia has nearly halved. Gas extraction is becoming increasingly challenging for all producers, due to a variety of factors:
- Increasing geological complexity, which makes it harder to access and release gas deposits to the surface.
- Poor production flow rates, which also compromise the financial viability of field development.
- Negotiating land access agreements.
- Acquiring environmental approval.
- Securing finance and/or joint venture partners.
- Community opposition to gas development in certain areas.
- Government policy of drilling and exploration moratoria.
The challenges of extracting gas and transporting it to market have contributed to a decrease in forecast supply across nearly the whole outlook period.”
From the above graph we integrate over the areas and find following reserves and resources:
2P undeveloped
Contingent resources
Prospective resources
Total
1,955 PJ
2,210 PJ
2,040 PJ
11,040 PJ
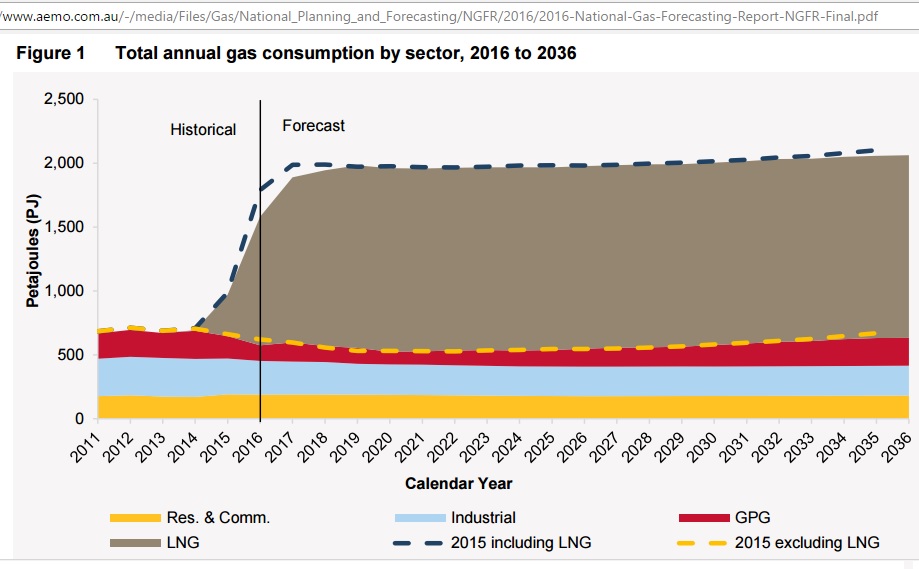
Fig 4: The elephant in the eastern room: Queensland’s LNG exports
https://www.aemo.com.au/-/media/Files/Gas/National_Planning_and_Forecasting/NGFR/2016/2016-National-Gas-Forecasting-Report-NGFR-Final.pdf
One may ask why residential consumption is assumed to remain flat although the Inter Generational Report 2015 https://www.treasury.gov.au/~/media/Treasury/Publications%20and%20Media/Publications/2015/2015%20Intergenerational%20Report/Downloads/PDF/2015_IGR.ashx
assumes an annual population growth of 1.3 % (page 3), based on an immigration of 215K pa – while no analysis was done whether there would be enough energy to support such growth.
Zooming into the above graph, the NGFR has a breakdown of GPG requirements by State:
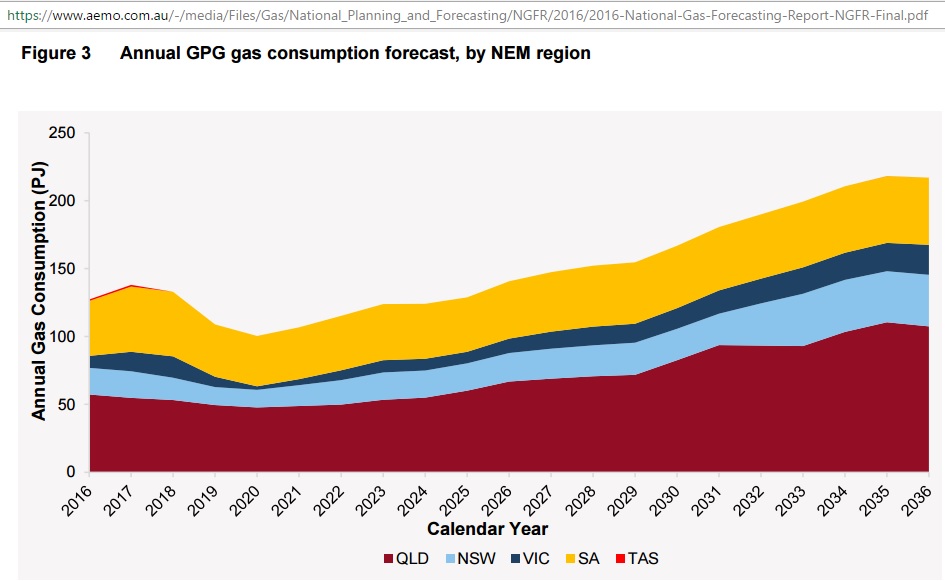
Fig 5: Gas consumption for power generation (GPG)
We can expect this to be updated as the gas and electricity crisis evolves. Note that the growth in GPG would come from more and more uncertain and expensive gas resources (not reserves) as shown in Fig 3.
The situation has become so urgent, that Prime Minister Turnbull had to invite CEOs from gas companies to get assurances they would supply the necessary domestic gas.
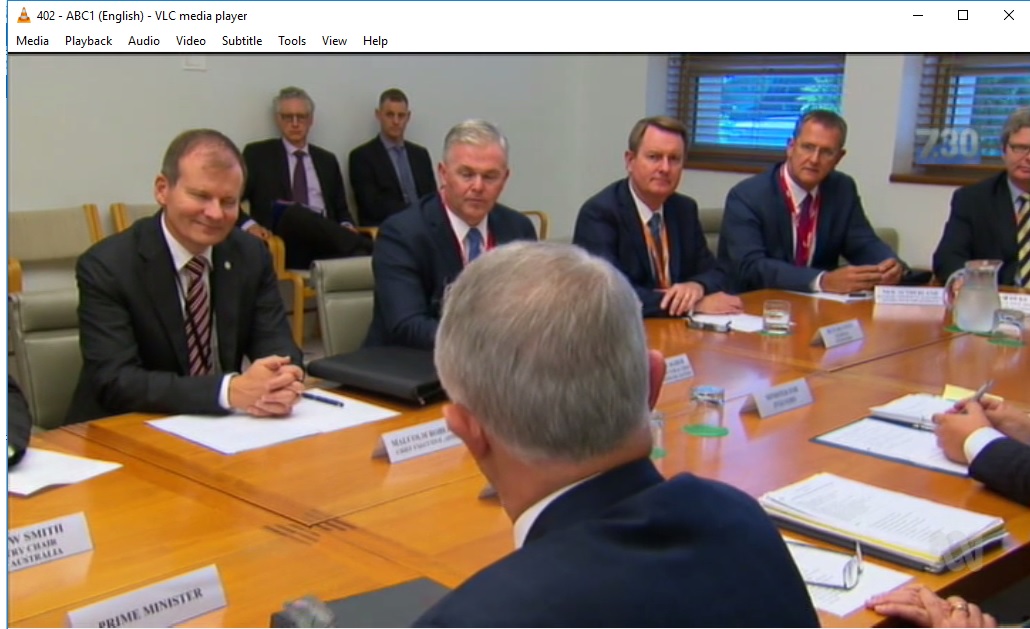
Fig 6: An embarrassing meeting for Malcolm Turnbull and gas CEOs.
http://www.abc.net.au/7.30/content/2017/s4636761.htm
Howard’s Energy Super Power
How did Australia manoeuvre itself into this situation?
We may remember that Malcolm himself – when he was Environment Minister in the Howard government – approved in October 2007 the Gorgon and Pluto LNG projects on the west coast.
10 Oct 2007 Turnbull approves Gorgon gas project
http://www.abc.net.au/news/2007-10-10/turnbull-approves-gorgon-gas-project/694512
Fast forward to 12/4/2016 and we read:
WA gas boom ‘will not boost national wealth for decades’
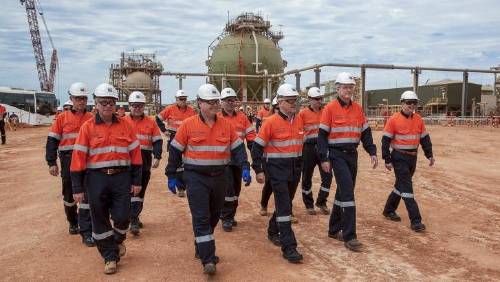
Fig 7: Malcolm Turnbull (centre) touring the Gorgon LNG project in 2016
http://www.smh.com.au/federal-politics/political-news/wa-gas-boom-will-not-boost-national-wealth-for-decades-20160412-go4kay.html
14 Oct 2007
Australia: Woodside gains environmental approval for Pluto LNG project
Federal Environment Minister Malcolm Turnbull was reportedly under pressure to approve the project before Prime Minister John Howard called an election, which is believed to be imminent.
http://www.energy-pedia.com/news/australia/woodside-gains-environmental-approval-for-pluto-lng-project-
This set off a new wave of LNG projects which had started in 1989 with the North West Shelf project, extended in a $25 bn gas deal with China, proudly announced by Howard in August 2002
http://www.smh.com.au/articles/2002/08/08/1028157991016.html .
The LNG ships sailed into troubled waters in January 2015
“Woodside Petroleum and its partners have been accused of holding back natural gas shipments to China as a negotiating tactic to raise the price of a contract guaranteeing 25 years of cheap energy.
The $US3.80 per MMBtu deal price was well below what Japanese buyers were paying at the time. But more amazingly, it was capped at an oil price equivalent of $US25 a barrel
By the time the North West Shelf partners began delivering on the contract in 2006, the oil price was trading around $US75 a barrel and two years later shot up above $US100 a barrel”
http://www.afr.com/news/economy/trade/woodside-in-china-gas-deal-debacle-20150128-130inx
Ah Yes. 2006 was the time conventional crude oil peaked. Had Howard only understood what peak oil was all about. His energy white paper released in June 2004 (EWP 2004) did not mention it. It was 1 year after the 1st peak oil war.
16/3/2013 Iraq war and its aftermath failed to stop the beginning of peak oil in 2005
http://crudeoilpeak.info/iraq-war-and-its-aftermath-failed-to-stop-the-beginning-of-peak-oil-in-2005
Let’s have a look at what Howard (and his resource minister Ian Macfarlane) said on gas:
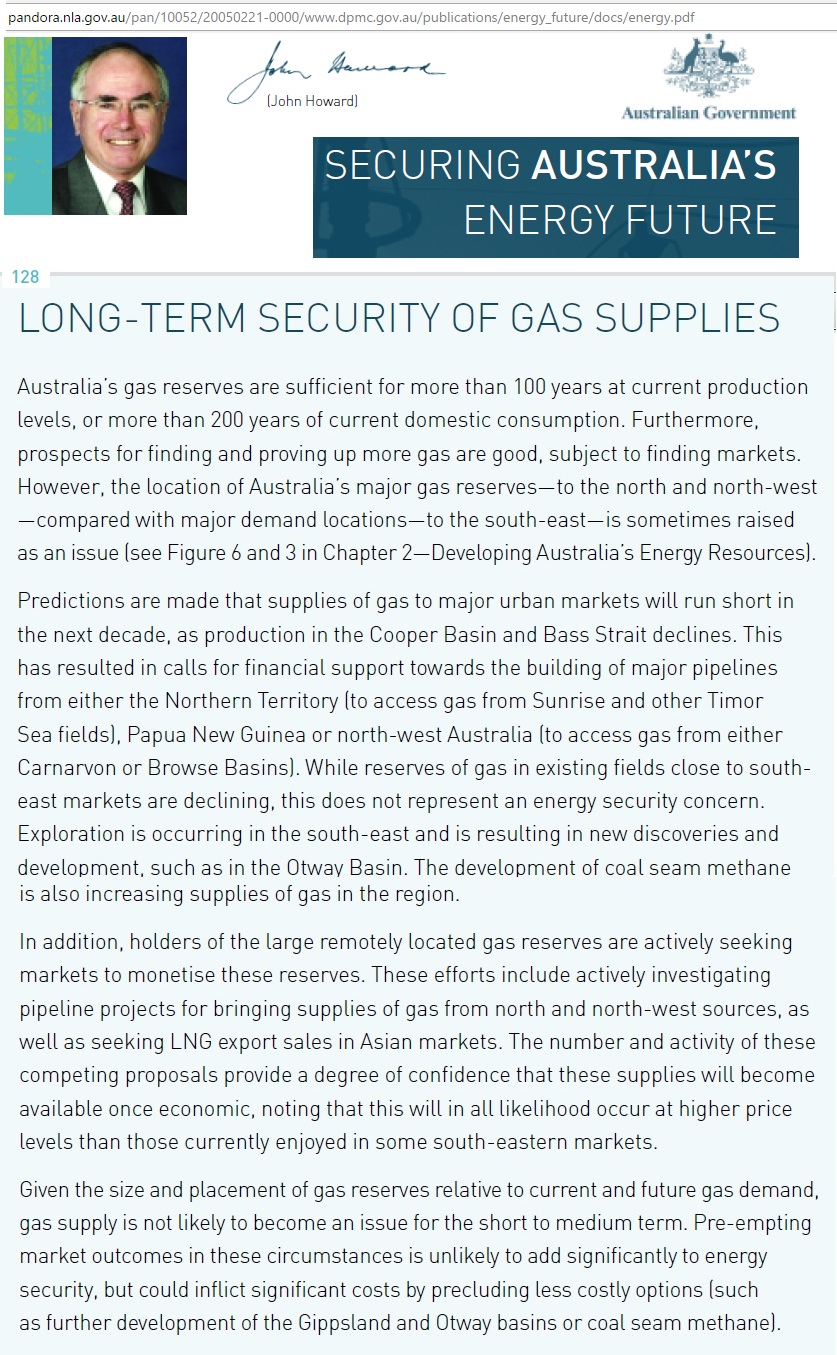
Fig 7: Excerpt from Howard’s energy white paper released in June 2004
http://pandora.nla.gov.au/pan/10052/20050221-0000/www.dpmc.gov.au/publications/energy_future/docs/energy.pdf
Reserve/Production ratio embellished
Geoscience Australia’s “Oil and Gas Resources of Australia 2003” published this graph:
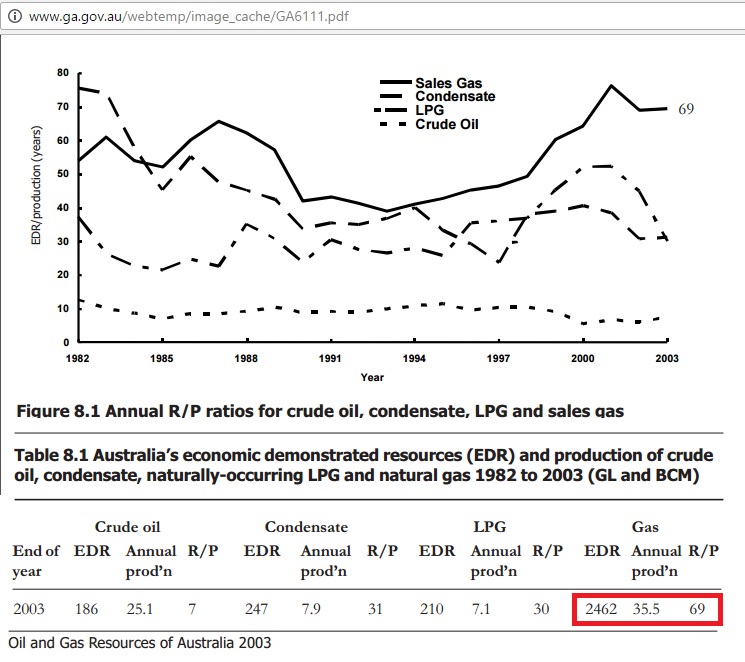
Fig 8: Reserve to production ratios (Fig 8.1 and extract from table 8.1)
http://www.ga.gov.au/webtemp/image_cache/GA6111.pdf
Maybe for many readers it does not matter whether it’s 69 years or 100 years but the underlying problem is that numbers were embellished. Moreover, as Howard initiated LNG export projects production would of course go up and R/P ratios down.
Gas decline warnings not taken seriously
Note that the EWP 2004 did not show any gas production profiles for the Cooper basin and Bass Straits, leaving the reader in the dark about the magnitude of the decline. In November 2003 Santos had published this graph in an investor seminar:
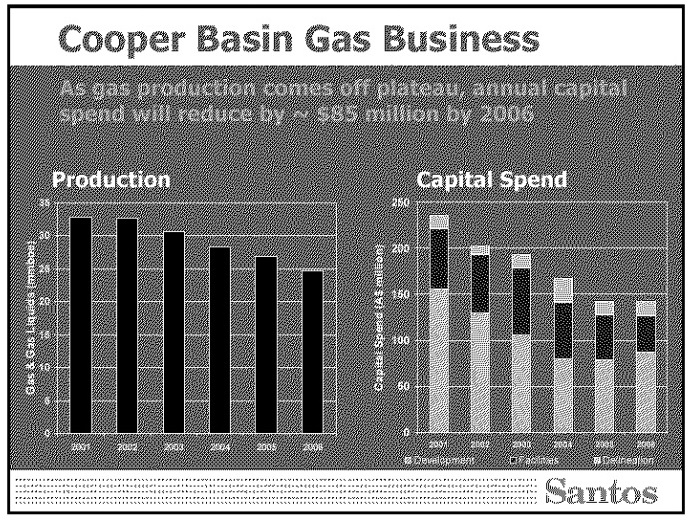 Fig 9: Gas decline in Cooper basin as presented by Santos in November 2003
In Fig 9, the expected gas decline after 2003 was between 5% and 7% pa. How about reserves?
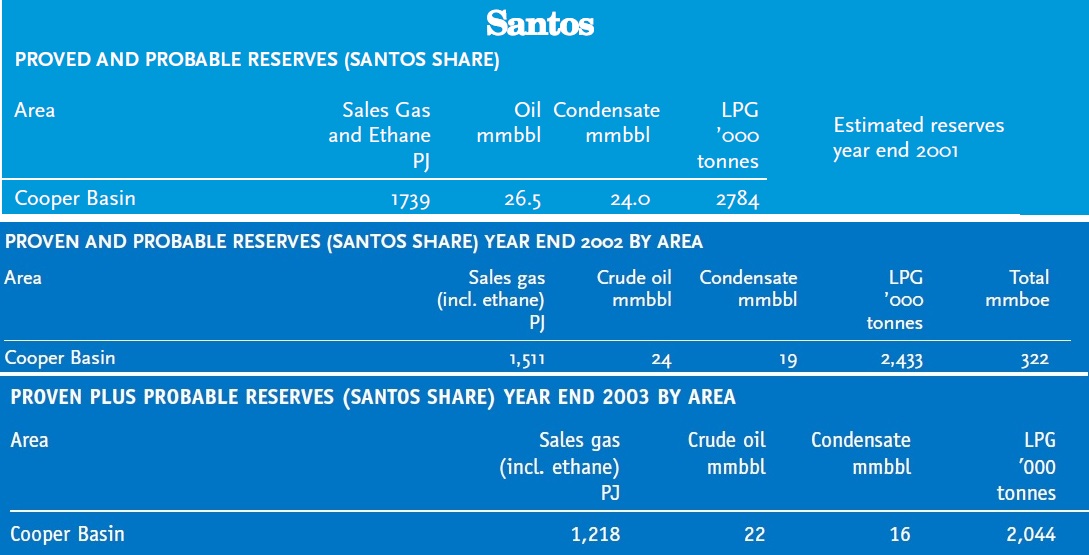
Fig 10: Santos 2P gas reserves for Cooper basin 2001-2003
https://www.santos.com/media-centre/announcements/2003-annual-report/
Santos 2P gas reserves in Cooper decreased by 30% from 1,739 PJ in 2001 to 1,218 PJ in 2003.
So where are we today with production and reserves?
Fast forward 13 years and reserves are only 672 PJ and more expensive to extract.
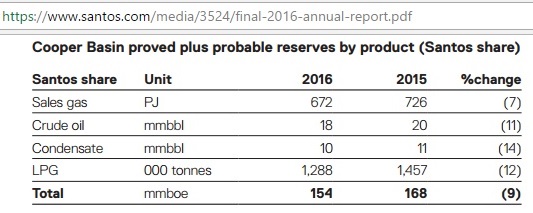
Fig 11: Cooper 2P reserves in 2016
https://www.santos.com/media/3524/final-2016-annual-report.pdf
The peaking of Cooper becomes very clear in this graph of the Chief Economist in the Gas Market Report 2015:
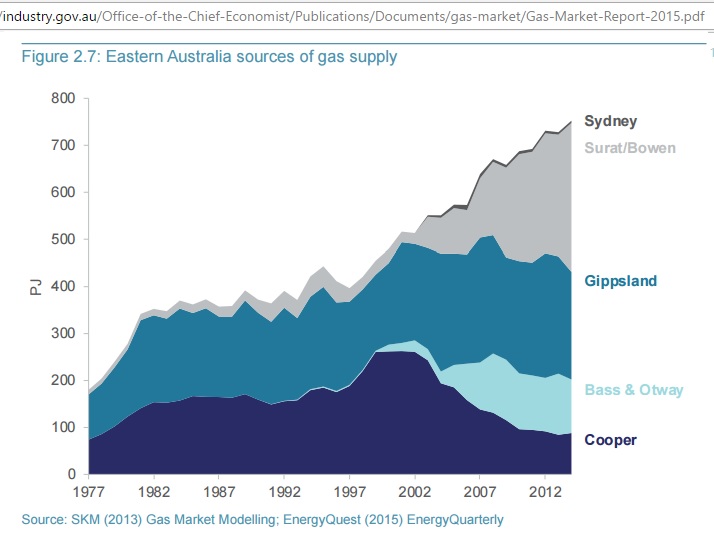
Fig 12: Eastern Australia gas supply (conventional and CSG) 1977-2013
The grey area is squandered in LNG exports
“Despite the absence of a deep, liquid market, there has been a measure of diversification of supply, particularly since the development of the Otway Basin in Victoria and the CSG reserves in the Surat and Bowen basins in Queensland from around 2000 (Figure 2.7). The diversification of supply has been accompanied by significant growth in the number of upstream market players (Figure 2.8). Furthermore, between 1998 and 2003 there was a significant expansion of gas transmission pipelines which has facilitated gas-on-gas competition and increased supply security”.
https://industry.gov.au/Office-of-the-Chief-Economist/Publications/Documents/gas-market/Gas-Market-Report-2015.pdf
So here we go again. Queensland CSG – although exported as LNG – is seen as diversification which is assumed to increase supply security. Whereas the graph very clearly shows the conventional gas peak. So the same mindset of either not recognising or covering up problems is still there.
Gas for power generation
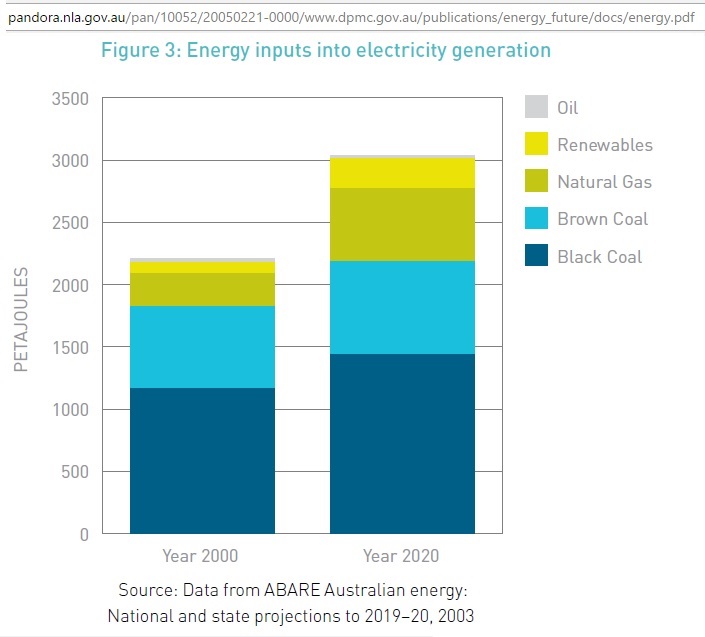
Fig 13: EWP 2004: primary energy mix for electricity generation
Interestingly, the EWP 2004 identified gas use for electricity generation increasing 2.5 fold, from 240 PJ in 2000 to 580 PJ in 2020. That is more than the total conventional gas production on the east coast in 2003. So this should have been another warning bell.
But no domgas action was taken to secure gas supplies for power generation.
We see that Howard’s complacency was based on following assumptions:
(a) New discoveries in the Otway basin (without quantifying them)
(b) Coal seam gas in the wings (at that time in statu nascendi compared to current production)
(c) Benefits for eastern gas market from vast reserves mobilised by LNG projects
(d) Absolute confidence in market forces to find low cost options
A prudent policy approach would have concluded:
“Although there are new discoveries of gas in the South East, it is not known whether they are sufficient to offset decline in existing fields like Cooper. Costs of coal seam gas production are uncertain and environmental impacts on agriculture and water are likely to be negative. In order to ensure energy security for the next decade and beyond, it is necessary to build gas pipelines from the north-west or north to supply eastern gas markets. The government will pro-actively negotiate with gas companies about the technical details of such pipelines and – if necessary – impose appropriate conditions when approving new LNG projects”
In July 2006 Howard declared Australia as an energy super power
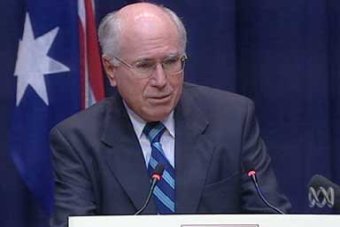
Fig 14: Howard spruiking LNG exports
http://www.abc.net.au/news/2006-07-17/howard-outlines-energy-superpower-vision/1803744
There was no way back since then.
All the while ABARE was preparing an updated version of its paper “National and State Projections 2029-30” (research report 06.26), published in December 2006, showing on page 42 following graph:
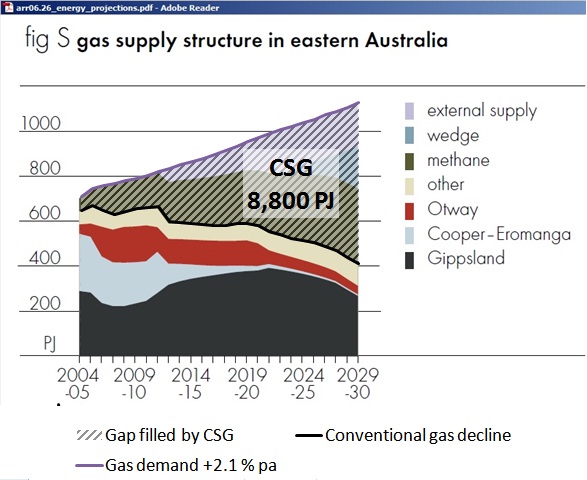
Fig 15: East coast gas production profile (CSG marked by author)
http://s3.amazonaws.com/zanran_storage/www.abare.gov.au/ContentPages/2249002001.pdf
Note the predicted conventional gas decline.
Conclusion
Although the beginning of the North West Shelf Venture pre-dates Howard as Prime Minister he actively promoted its extension and initiated 2 more LNG export projects on the west coast without understanding the geology of peaking conventional gas production on the east coast and without ensuring domestic gas supplies for where most of Australians live. This LNG bonanza created an atmosphere of competition for successive governments to excel in starting more big LNG export projects. So the next government after Howard repeated the same mistakes on the east coast.
This excursion into history has shown what happens when governments cannot do their energy homework. It was necessary because the lessons of the past have not been learnt and the same complacent mindset prevails until today.
Part 2:
Gasopoly continues
I told You so:
9/5/2012 Queensland plans to export more than 10 times the gas NSW needs (part 3)
http://crudeoilpeak.info/queensland-plans-to-export-more-than-10-times-the-gas-nsw-needs-part-3
13/10/2011 NSW gas as transport fuel. Where are the plans?
http://crudeoilpeak.info/nsw-gas-as-transport-fuel-where-are-the-plans
11/10/2011 Australia’s natural gas squandered in LNG exports
http://crudeoilpeak.info/australias-natural-gas-squandered-in-lng-exports
8/11/2004 Critique of Energy White Paper June 2004
http://crudeoilpeak.info/critique-of-energy-white-paper-june-2004