According to EIA data global crude & condensate production peaked in November 2018 at 84.5 mb/d. The peak was short-lived: 2 months above 83 mb/d plus 3 months above 84 mb/d while the average for the remaining months was 82.2 mb/d.
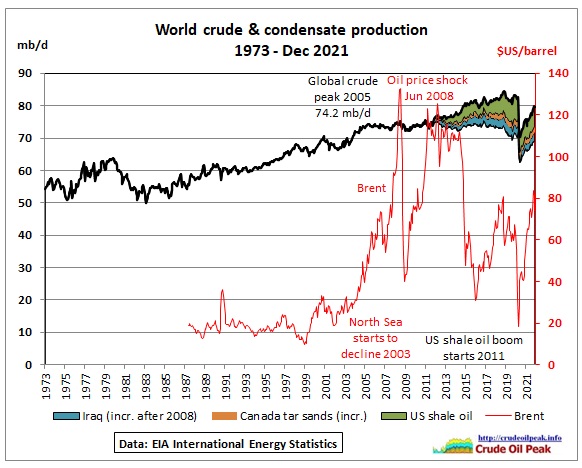 Fig 1: Graph showing additional unconventional and Iraqi crude production after 2008
US shale oil (incremental from 2011), Canadian tar sands (incremental from 2011) and Iraq’s oil (incremental from 2008) contributed to an increase in production above the Dec 2005 peak of 74.2 mb/d. The 2005 peak caused the 2008 oil price shock (Chinese demand for the Olympic games also played a role) and the 2009 financial crisis. The response in the US was quantitative easing QE1-QE3, copied and repeated by many countries, creating a gigantic asset bubble.
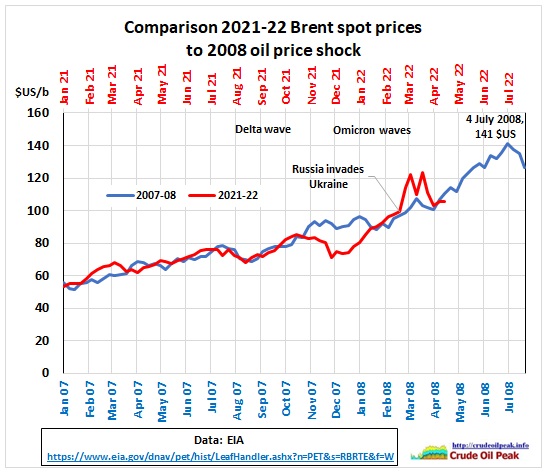 Fig 2: Current oil price path compared to 2007/08
Oil prices went up already before the war in Ukraine which is changing the whole world, including oil supply and demand. Lockdowns from Covid, as now again experienced in China, complicate matters.
https://oilprice.com/Energy/Energy-General/Demand-Destruction-Is-Delaying-An-Oil-Supply-Crisis.html
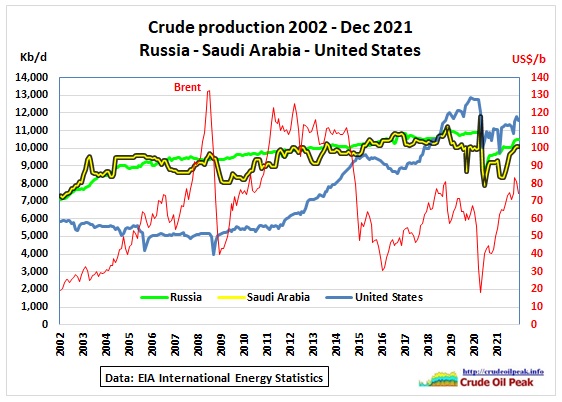 Fig 3: Crude oil production from the 3 big producers
Russia had been a steady producer over the last 15 years, slowly inching up production by 2 mb/d since 2005 but recently flattening out below 11 mb/d. A Rystad study predicted a peak in 2020. More details are in this previous post:
28 Feb 2022 Russian oil production update Nov 2021
https://crudeoilpeak.info/russian-oil-production-update-nov-2021
The Baker Institute for public policy did this analysis:
REROUTE, REDUCE, OR REPLACE?
HOW THE OIL MARKET MIGHT COPE WITH A LOSS OF RUSSIAN EXPORTS AFTER THE
INVASION OF UKRAINE
Mar 2022
https://www.bakerinstitute.org/media/files/files/3bf292f2/ces-pub-russian-oil-040822.pdf
Let’s have a look at the crude oil production changes in the last 5 years:
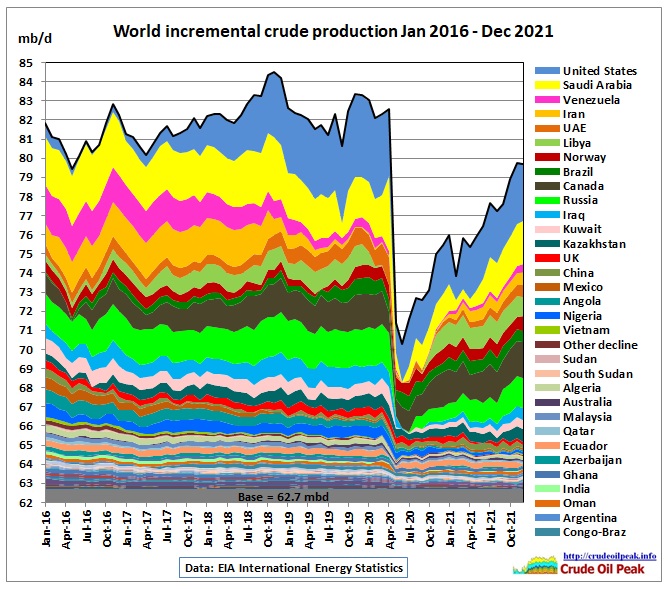 Fig 4: Countries with the largest changes are stacked on top
Incremental production is calculated as follows: monthly production minus the minimum production during the period under consideration. For many countries, this minimum happened in the 1st Covid year (around June 2020). A notable exception is Canada, where the Fort McMurray wildfires in May 2016 reduced tar sand production. https://wildfiretoday.com/tag/alberta/
The sum of all minimum production forms the base production (62.7 mb/d in this case).
Note the drop in Saudi production as a result of the attack on Abqaiq in Sep 2019.
Fig 4 shows 2 peaks, one in November 2018 and another a year later. We note:
(a) In order to reach the November 2018 peak, global production would have to increase by 4.8 mb/d above Dec 2021 levels
(b) In order to reach the November 2019 peak, global production would have to increase by 3.7 mb/d above Dec 2021 levels
(c) All countries together stacked below Kazakhstan (bottom group) could not increase their production after the demand shock in 2020
Peak shaping countries
We look at countries which shaped the 2 peaks in the period between January 2018 and Mar 2020:
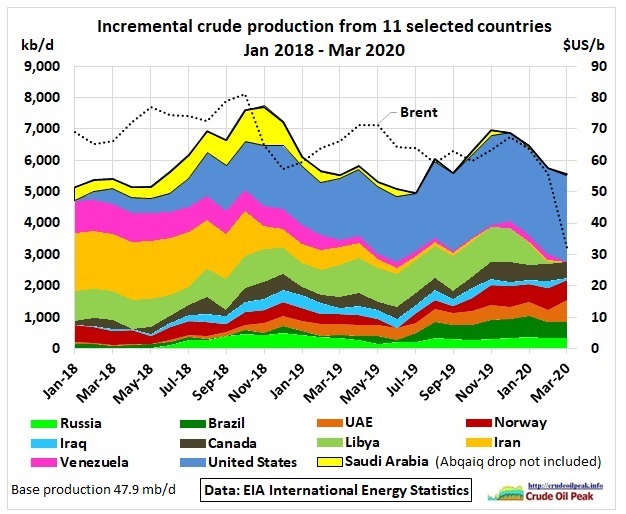 Fig 5: 11 selected countries which contributed to 2 peaks Pre-Covid
The base production for the above group is 47.9 mb/d. The peakiness in Nov 2018 (high) compared to July 2019 (low) was around 5 %. In order to illustrate Saudi Arabia’s incremental contribution, the drop in Saudi production in Sep 2019 (Abqaiq attack) has been omitted.
1st peak Nov 2018
On the upside: US and Saudi Arabia, Canada, UEA, Iraq
On the downside: Saudi Arabia, Iran and Venezuela
2nd peak Dec 2019
On the upside: US, Norway, Canada
On the downside: Libya
The following graph shows where these 11 countries were in December 2021:
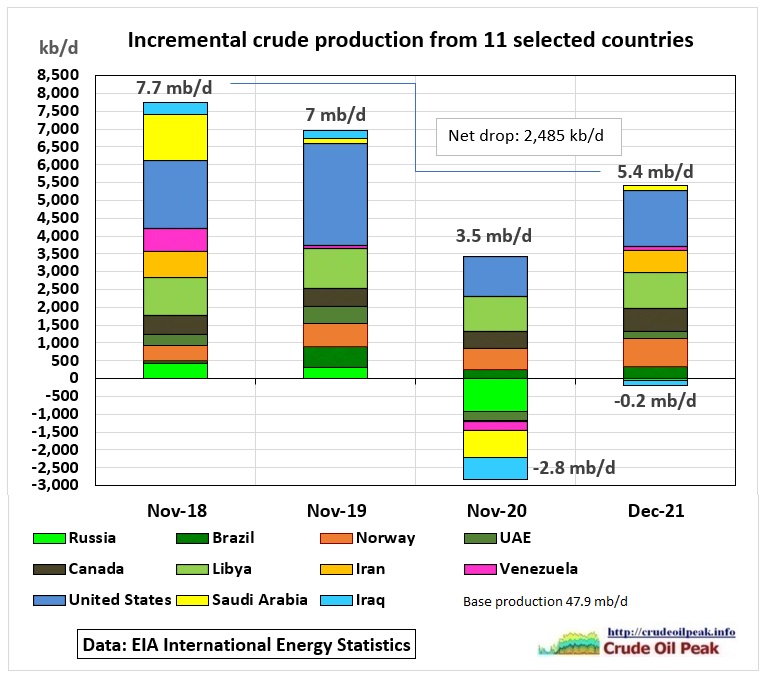 Fig 6: 11 selected countries in stacked column graph (can handle negative values)
This whole group was still around 2.5 mb/d lower in December 2021 than in November 2018 consisting of following changes:
Production drop:
Russia (-472 kb/d), UAE (-114 kb/d), Libya (-67 kb/d), Iran (-111 kb/d), Iraq (-470 kb/d),
Venezuela (-551 kb/d), US (-340 kb/d), Saudi Arabia (-1,107 kb/d)
Production increase:
Brazil (+271 kb/d), Norway (+ 337 kb/d), Canada (+136 kb/d)
Bumpy producers
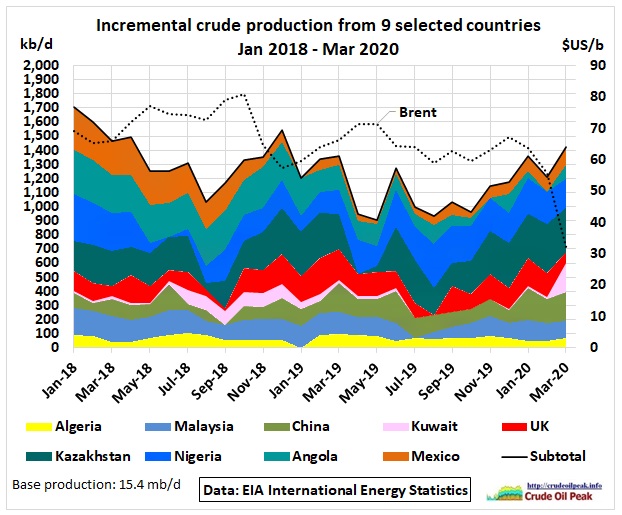 Fig 7: 9 selected countries on a bumpy production plateau pre-Covid
Except for Mexico and Angola which have steadily declined, monthly production in this group went up and down in irregular intervals.
When looking at the production changes between Nov 2018 and Dec 2021 we spilt up this group into countries which have lost production (6 countries) and where production just marginally increased (3 countries)
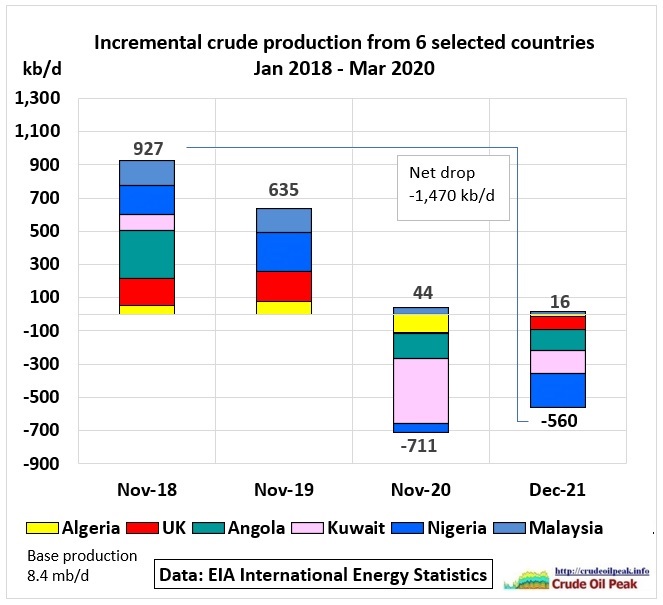 Fig 8: 6 selected countries with production drops
A stacked column graph was again used here because it can handle negative values.
Production drops: Angola -420 kb/d, Nigeria -371 kb/d, UK – 242 kb/d, Kazakhstan -239 kb/d, Malaysia – 137 kb/d, Algeria -62 kb/d = -1,470 kb/d
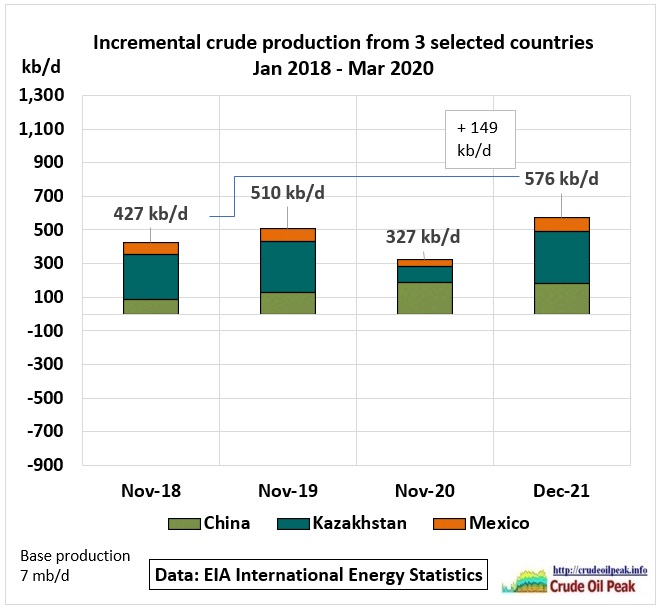 Fig 9: 3 selected countries with marginal production increases
China + 99 kb/d, Kazakhstan + 39 kb/d, Mexico +11 kb/d = + 140 kb/d. These numbers could well be within the accuracy of data.
Tail end producers
Minor incremental players in long term decline anyway
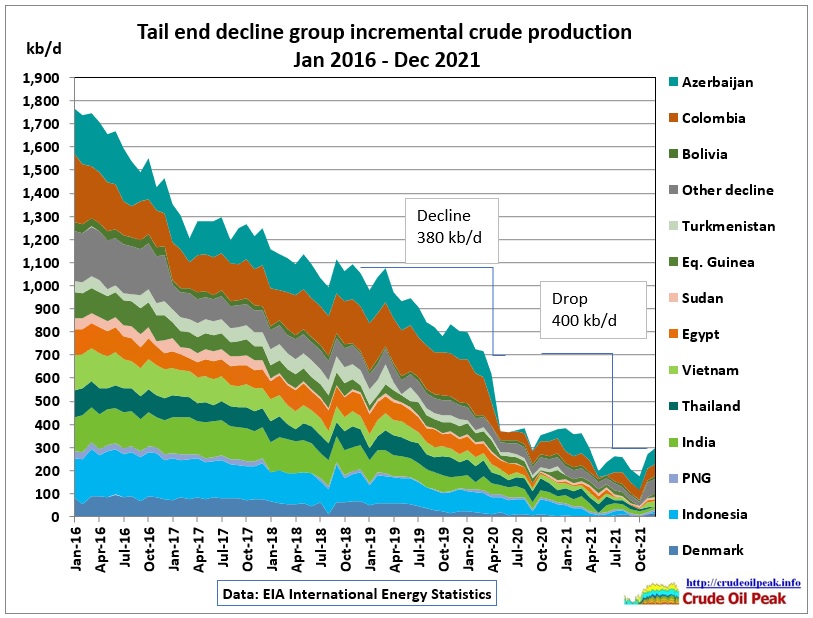 Fig 10: This group of 14 countries was in decline anyway
Between Nov 2018 and March 2020 production declined by 380 kb/d and dropped a further 400 kb/d by December 2021 during Covid.
Mixed Bag of minor producers
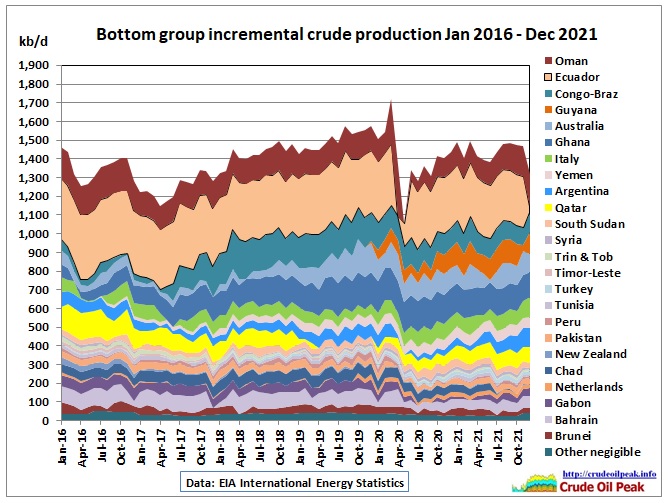 Fig 11: The difference between Nov 2018 and Dec 2021 is around – 100 kb/d
Ecuador is a special case. There are continuing problems with export pipelines (oil spills resulting from erosion and rock-fall)
4 Jan 2022
https://www.argusmedia.com/en/news/2288626-ecuador-oil-flow-drops-for-second-year-in-a-row
So we have following changes between Nov 2018 to Dec 2021: -2,485 kb/d, -1,470 kb/d + 140 kb/d – 780 kb/d -100 kb/d = -4.7 mb/d. This is the volume which has to be produced in order to go back to the November 2018 peak
To be continued. In the next posts we are going to look at incremental production region by region.